
The Market Reaction to ROCE and ROCE Components










- Slides: 41
The Market Reaction to ROCE and ROCE Components Eli Amir London Business School Itay Kama London Business School February 2006
Financial Ratios • Perhaps the most common tool in financial statement analysis. • Summarizing financial data, analyzing current performance and financial position and comparing performance and financial position across companies and over time. 2
Financial Ratios • Investors, lenders, rating agencies and regulators use them to analyze company performance, strategy, the probability of default and risks. • Analytical auditing, imposing debt restrictions (covenants), comparison with industry norms and company budgets, and equity valuation. 3
ROCE Indicator of profitability “For the common shareholders, the profitability of their investment is the accounting ROCE” (S. H Penman) 4
ROCE: The Du. Pont Decomposition • Interesting and popular because it captures the three main activities of a company: net profitability, efficiency in investing and financing. • The ratios identified are tied together in a structured way that explains how they “sum up” as building blocks of net income. • Establishes hierarchy & tradeoff between components. 5
Notwithstanding the Importance… Previous research has not examined immediate market reaction to ROCE and its components. 6
Motivation • An increase in one of the ROCE components, holding the other constant, leads to an increase in ROCE (assuming positive NI), but the market reaction to ROCE may depend on the source of ROCE – the components. • Investigating market reaction around quarterly earnings announcement dates is potentially useful in identifying ratios that are important for investors, used in practice and are relevant for valuation. 7
Research Questions • What is the role of ROCE and ROCE components in explaining stock returns? • Do ROCE and ROCE components have an incremental effect on stock returns after controlling for earnings and revenues surprises? • Is there a dominant component or does the market reacts to each component in a similar fashion? • Does the market react differently to ROCE depending on the source of income? 8
Implications • Answering these questions will extend our understanding of the role financial ratios play in financial statement analysis. • It may also assist internal and external financial statement users in analyzing firm performance. 9
Related Literature • Nissim and Penman (2001) • Fairfield and Yohn (2001) • Soliman (2004) • Penman and Zhang (2004) • Fairfield at al. (2005) 10
Related Literature • Nissim and Penman (2001): Identify financial ratios that are linked to MV (e. g. RNOA and LEV). Document the behavior and persistent of this ratios over the last three decades. 11
Related Literature • Fairfield and Yohn (2001): Decomposing the change in RNOA assist in forecasting change in RNOA. • Penman and Zhang (2004): Changes in profit margin and asset turnover forecast stock returns only one year ahead, and RNOA assists in forecasting stock returns two years ahead. 12
Related Literature • Soliman (2004): Decomposing RNOA into NPM and ATO assist in predicting RNOA. Further, NPM and ATO revert to industry average; hence, using industry-adjusted ratios improve the prediction power of ratios. • Fairfield at al. (2005): Industry analysis have only marginal incremental information over firm-specific figures forecasting RNOA, ROCE and growth in NOA. However, industry analysis assist in predicting future sales growth. 13
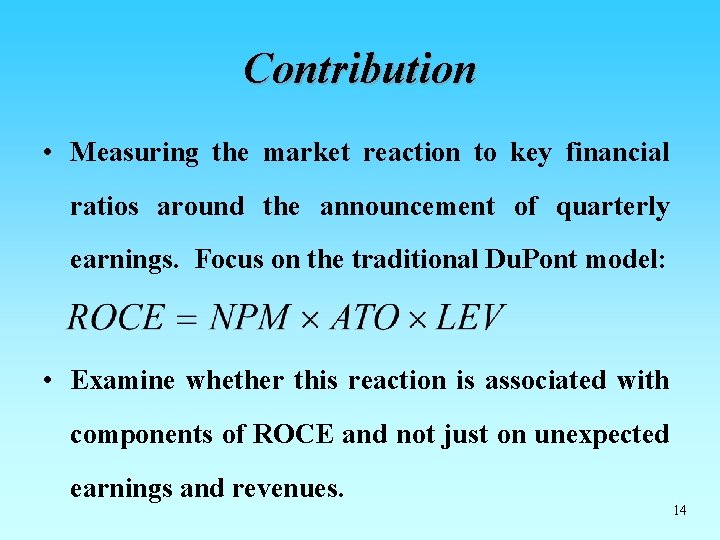
Contribution • Measuring the market reaction to key financial ratios around the announcement of quarterly earnings. Focus on the traditional Du. Pont model: • Examine whether this reaction is associated with components of ROCE and not just on unexpected earnings and revenues. 14
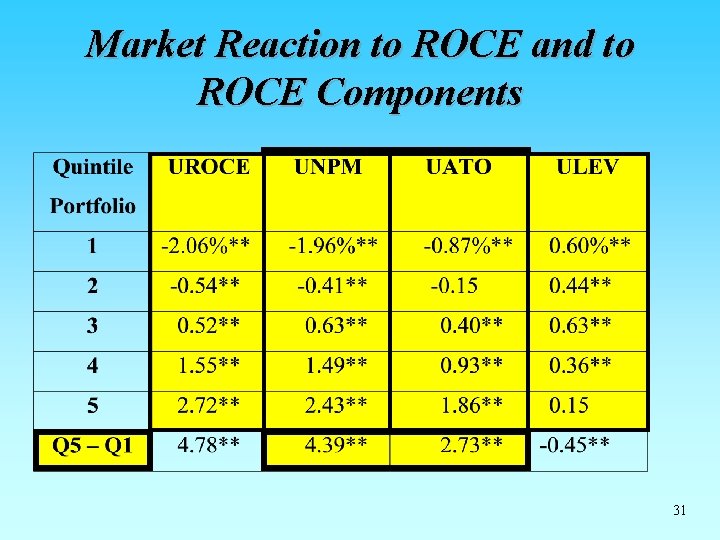
Prediction 1: Market reaction is stronger for increases in NPM than to ATO or LEV • Changes in ATO or LEV are more likely to be perceived by the market as temporary. • Changes in NPM are perceived by investors to be more permanent. • NPM contains more valuable information about the firm cost structure and its ability to handle changes in demand. 15
Prediction 1: Market reaction is stronger for increases in NPM than to ATO or LEV • The reaction to NPM is expected to be stronger because this ratio includes more information on NI. • Financial analysts have long considered NPM as a critical variable that constrains the increase in ROCE and thus the perceived growth in expected dividends (Babcock 1970, Reilly 1997). 16
Prediction 1: Market reaction is stronger for increases in NPM than to ATO or LEV • Managers usually refrain from changing resources in response to economic shocks that are perceived to be temporary (Anderson et al. 2003). • ATO and LEV depend on the amount of resources invested in the production of sales. Þ Changes in ATO or LEV are more likely to be perceived by the market as temporary. 17
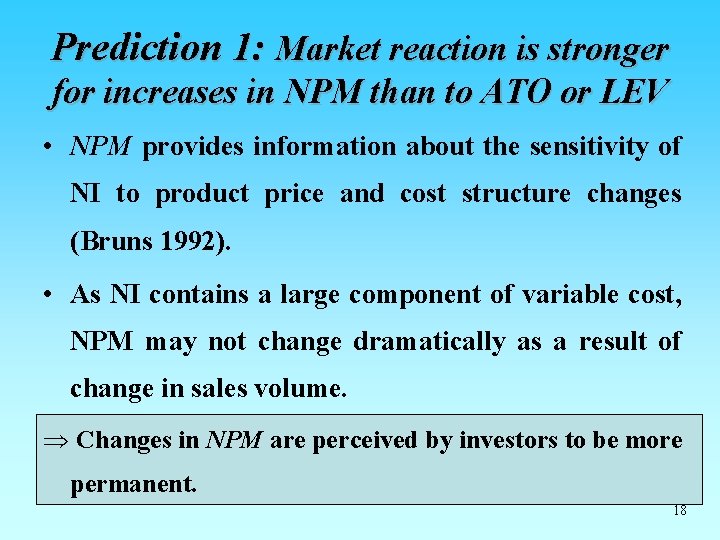
Prediction 1: Market reaction is stronger for increases in NPM than to ATO or LEV • NPM provides information about the sensitivity of NI to product price and cost structure changes (Bruns 1992). • As NI contains a large component of variable cost, NPM may not change dramatically as a result of change in sales volume. Þ Changes in NPM are perceived by investors to be more permanent. 18
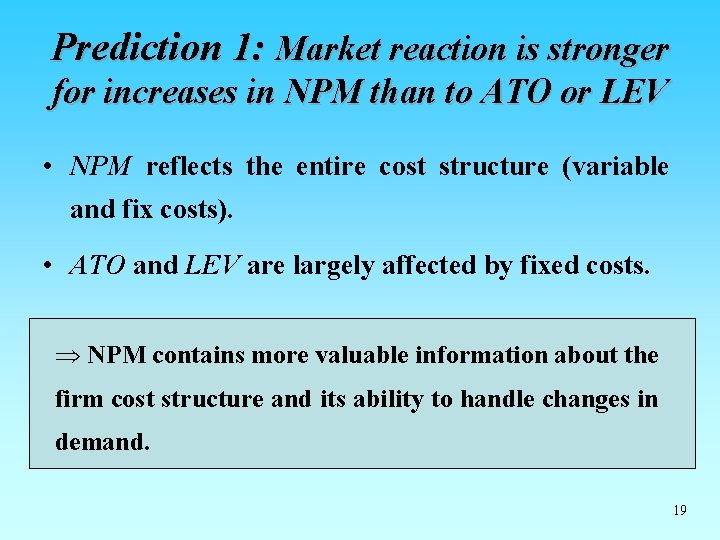
Prediction 1: Market reaction is stronger for increases in NPM than to ATO or LEV • NPM reflects the entire cost structure (variable and fix costs). • ATO and LEV are largely affected by fixed costs. Þ NPM contains more valuable information about the firm cost structure and its ability to handle changes in demand. 19
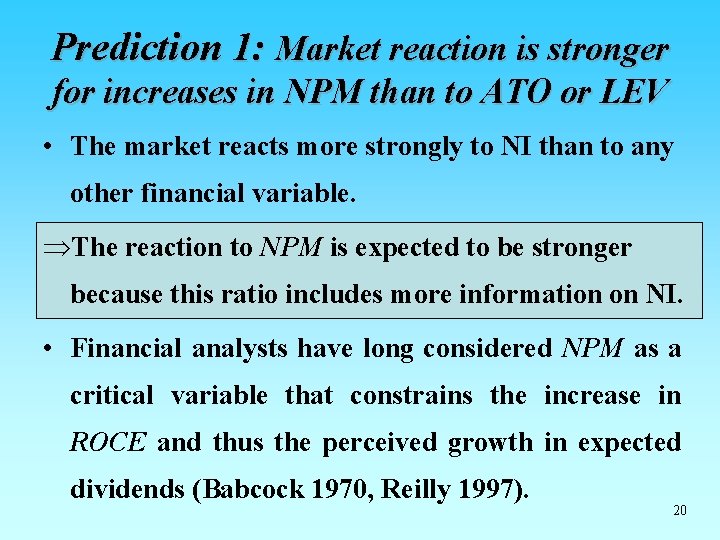
Prediction 1: Market reaction is stronger for increases in NPM than to ATO or LEV • The market reacts more strongly to NI than to any other financial variable. ÞThe reaction to NPM is expected to be stronger because this ratio includes more information on NI. • Financial analysts have long considered NPM as a critical variable that constrains the increase in ROCE and thus the perceived growth in expected dividends (Babcock 1970, Reilly 1997). 20
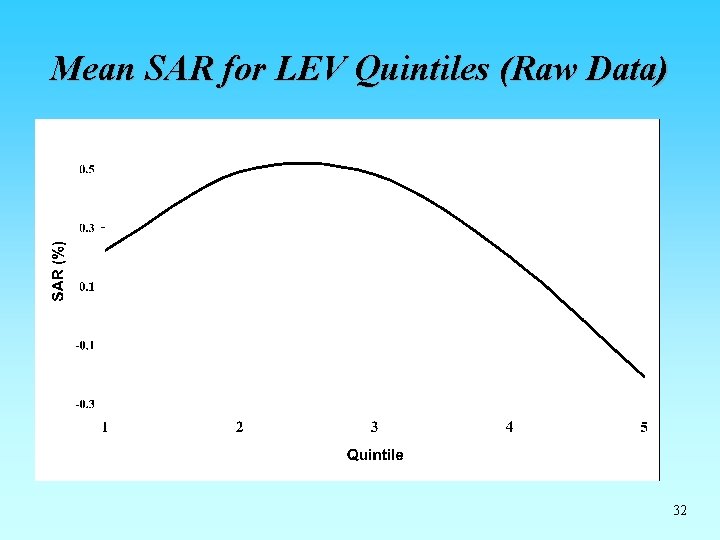
Prediction 2: Nonlinear relation between LEV and stock returns • Trade-off between tax shield from borrowing and expected costs of financial distress. • Other factor that might influence capital structure: Agency cost, personal taxes, asymmetric information. 21
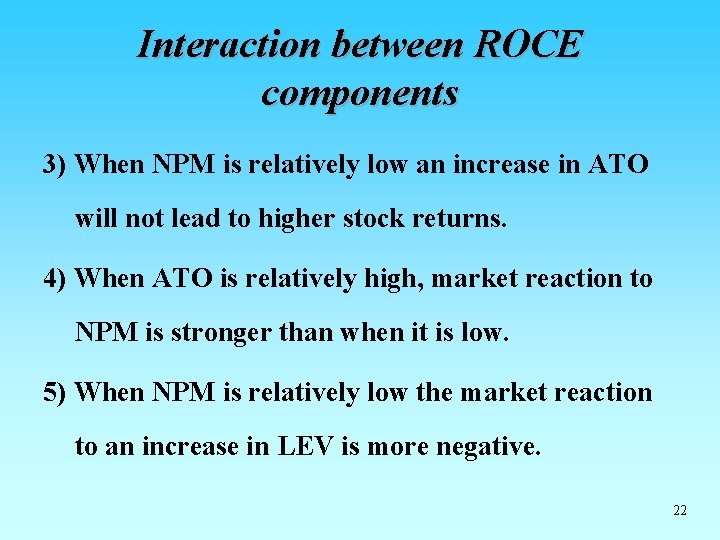
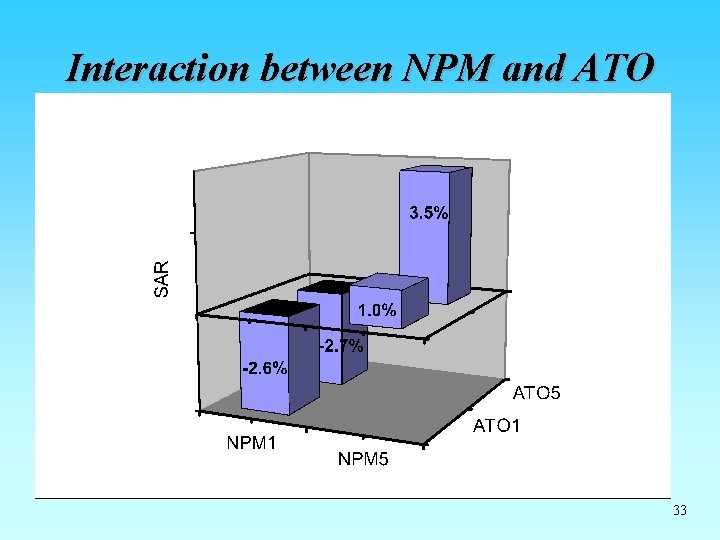
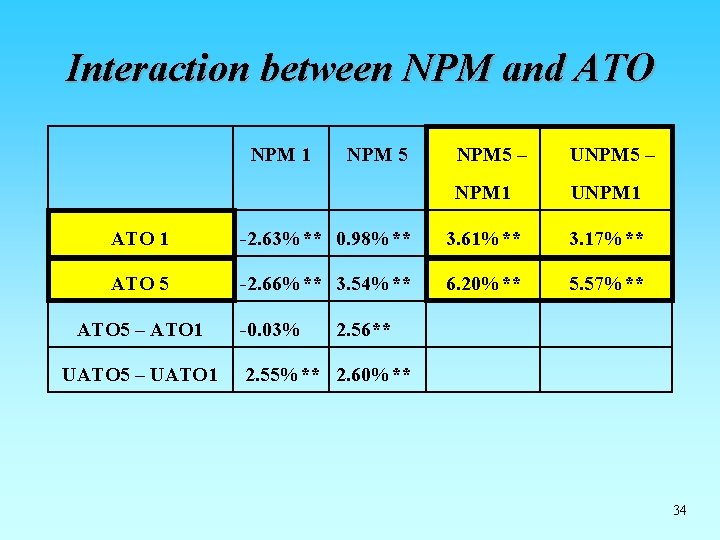
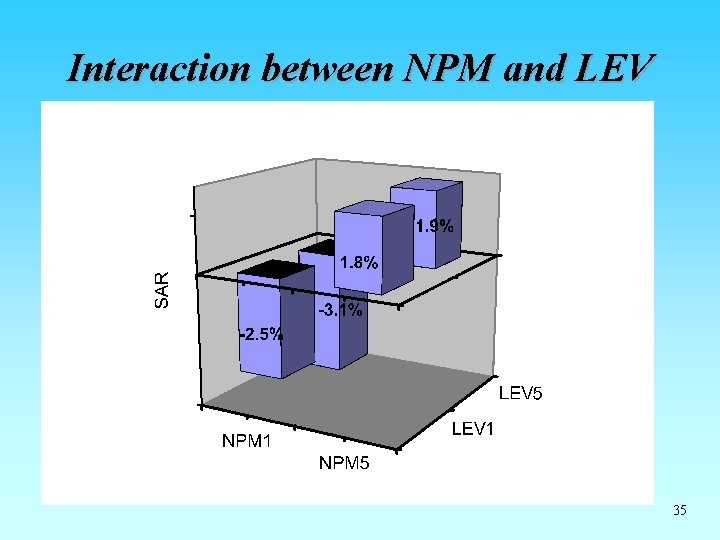
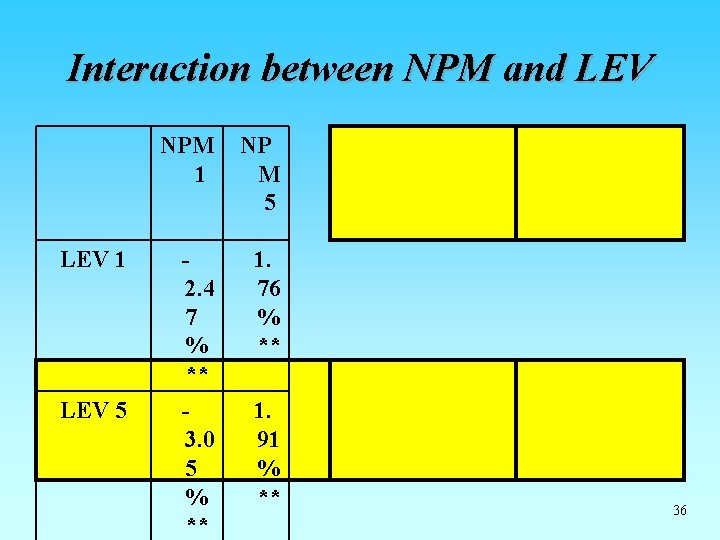
Interaction between ROCE components 3) When NPM is relatively low an increase in ATO will not lead to higher stock returns. 4) When ATO is relatively high, market reaction to NPM is stronger than when it is low. 5) When NPM is relatively low the market reaction to an increase in LEV is more negative. 22
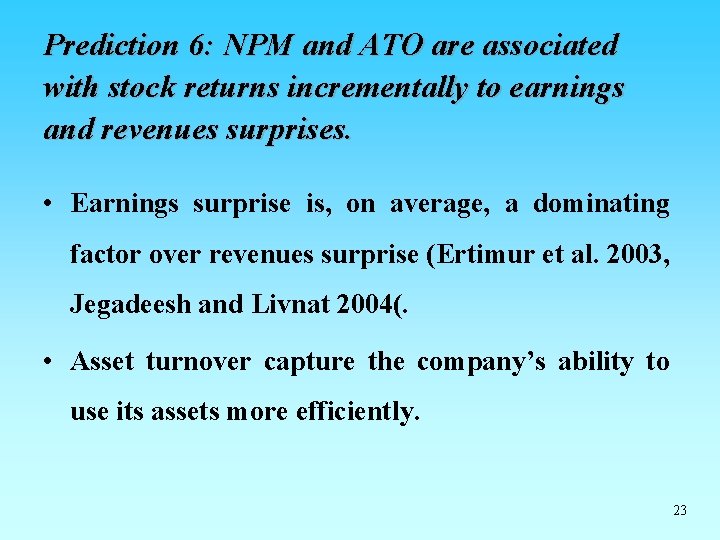
Prediction 6: NPM and ATO are associated with stock returns incrementally to earnings and revenues surprises. • Earnings surprise is, on average, a dominating factor over revenues surprise (Ertimur et al. 2003, Jegadeesh and Livnat 2004(. • Asset turnover capture the company’s ability to use its assets more efficiently. 23
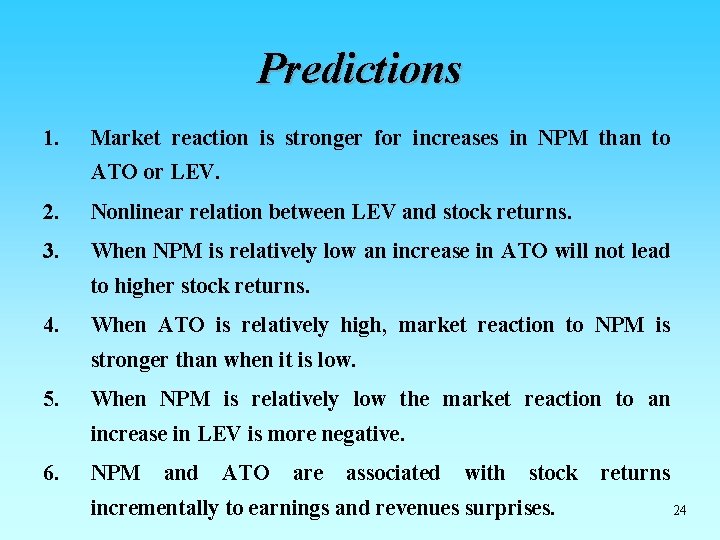
Predictions 1. Market reaction is stronger for increases in NPM than to ATO or LEV. 2. Nonlinear relation between LEV and stock returns. 3. When NPM is relatively low an increase in ATO will not lead to higher stock returns. 4. When ATO is relatively high, market reaction to NPM is stronger than when it is low. 5. When NPM is relatively low the market reaction to an increase in LEV is more negative. 6. NPM and ATO are associated with stock incrementally to earnings and revenues surprises. returns 24
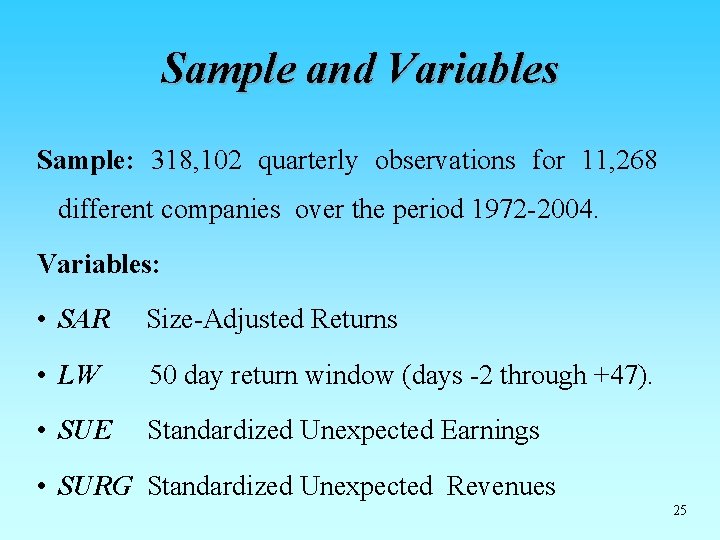
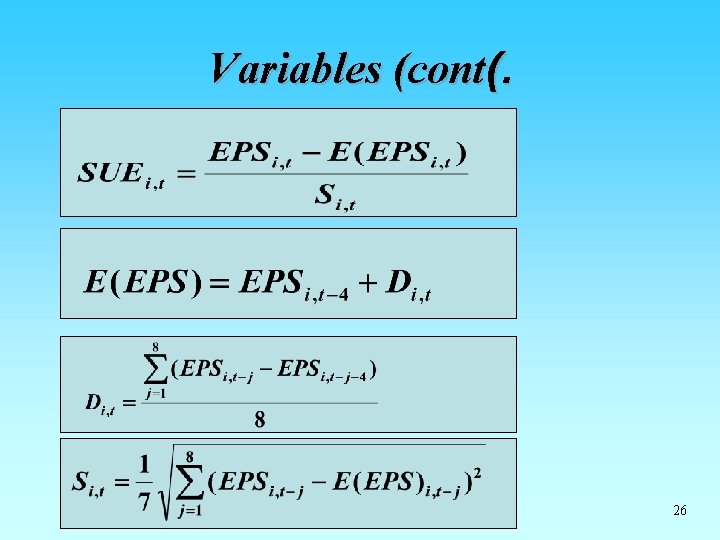
Sample and Variables Sample: 318, 102 quarterly observations for 11, 268 different companies over the period 1972 -2004. Variables: • SAR Size-Adjusted Returns • LW 50 day return window (days -2 through +47). • SUE Standardized Unexpected Earnings • SURG Standardized Unexpected Revenues 25
Variables (cont(. 26
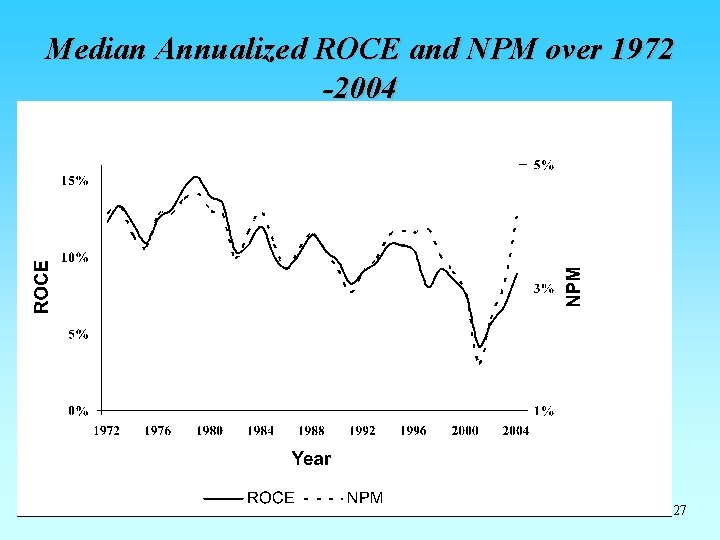
Median Annualized ROCE and NPM over 1972 -2004 27
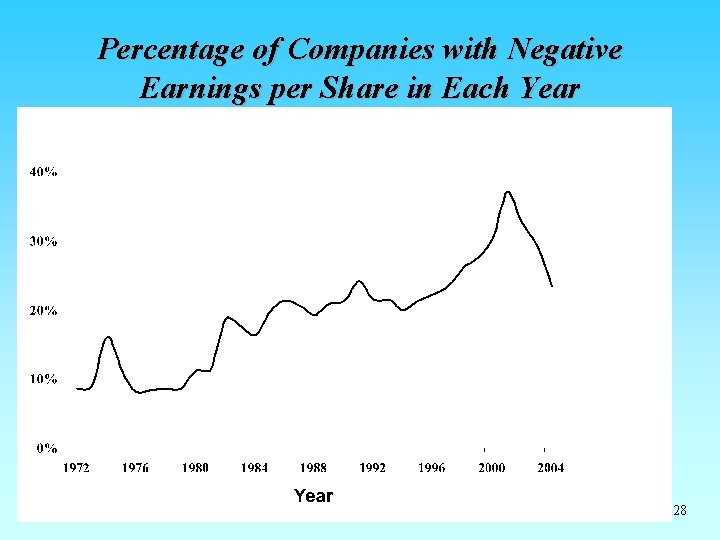
Percentage of Companies with Negative Earnings per Share in Each Year 28
Median ATO and LEV over 1972 -2004 29
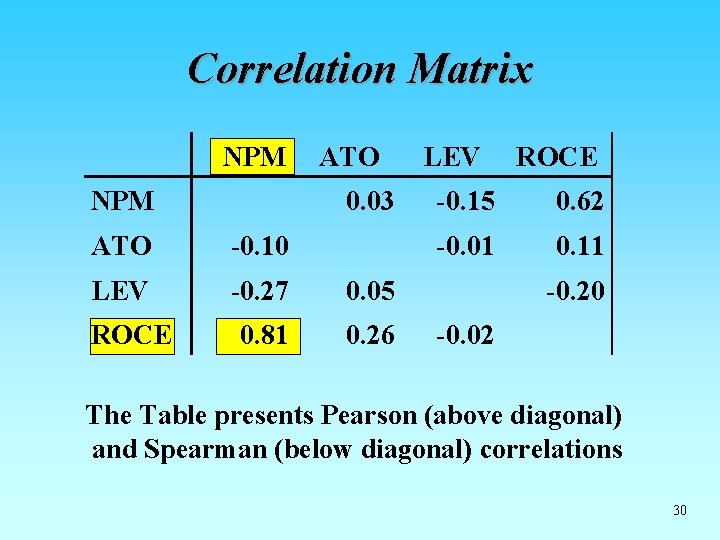
Correlation Matrix NPM ATO 0. 03 ATO -0. 10 LEV -0. 27 0. 05 0. 81 0. 26 ROCE LEV ROCE -0. 15 0. 62 -0. 01 0. 11 -0. 20 -0. 02 The Table presents Pearson (above diagonal) and Spearman (below diagonal) correlations 30
Market Reaction to ROCE and to ROCE Components 31
Mean SAR for LEV Quintiles (Raw Data) 32
Interaction between NPM and ATO 33
Interaction between NPM and ATO NPM 1 NPM 5 – UNPM 5 – NPM 1 UNPM 1 ATO 1 -2. 63%** 0. 98%** 3. 61%** 3. 17%** ATO 5 -2. 66%** 3. 54%** 6. 20%** 5. 57%** ATO 5 – ATO 1 UATO 5 – UATO 1 -0. 03% 2. 56** 2. 55%** 2. 60%** 34
Interaction between NPM and LEV 35
Interaction between NPM and LEV NPM 1 NP M 5 LEV 1 2. 4 7 % ** 1. 76 % ** LEV 5 3. 0 5 % ** 1. 91 % ** 36
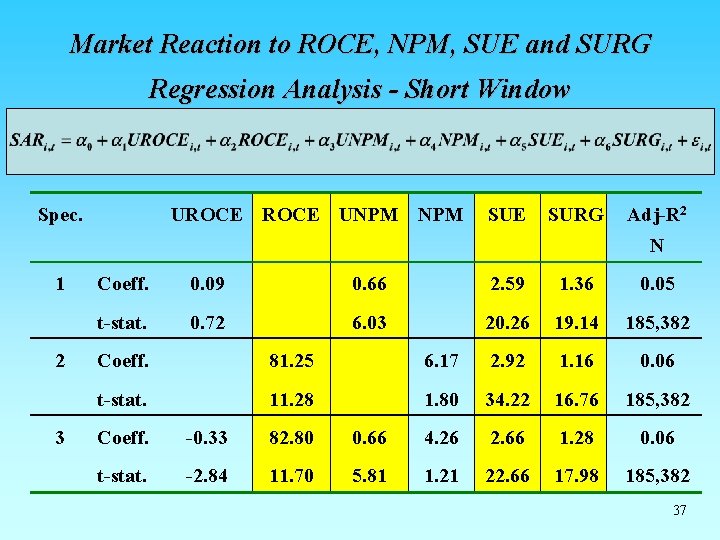
Market Reaction to ROCE, NPM, SUE and SURG Regression Analysis - Short Window Spec. UROCE UNPM SUE SURG Adj-R 2 N 1 2 3 Coeff. 0. 09 0. 66 2. 59 1. 36 0. 05 t-stat. 0. 72 6. 03 20. 26 19. 14 185, 382 Coeff. 81. 25 6. 17 2. 92 1. 16 0. 06 t-stat. 11. 28 1. 80 34. 22 16. 76 185, 382 Coeff. -0. 33 82. 80 0. 66 4. 26 2. 66 1. 28 0. 06 t-stat. -2. 84 11. 70 5. 81 1. 21 22. 66 17. 98 185, 382 37
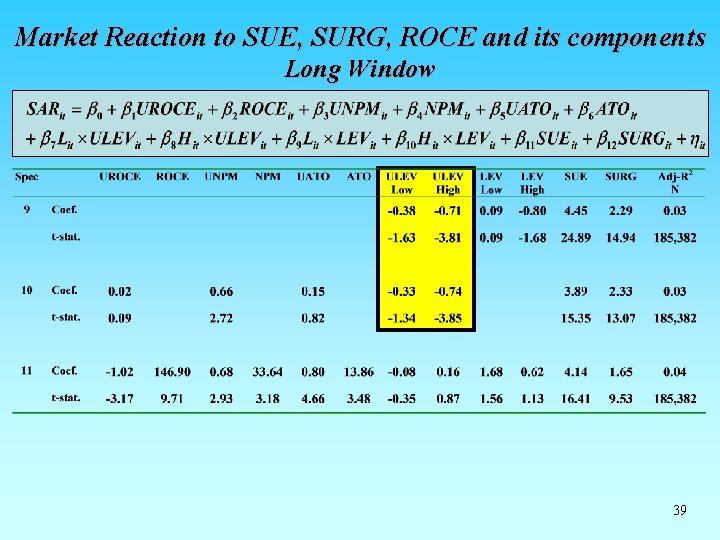
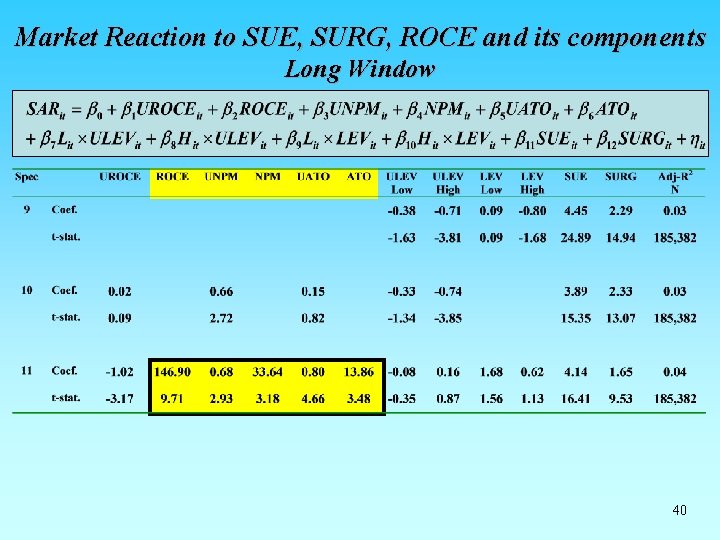
Market Reaction to SUE, SURG, ROCE and its components Long Window 39
Market Reaction to SUE, SURG, ROCE and its components Long Window 40
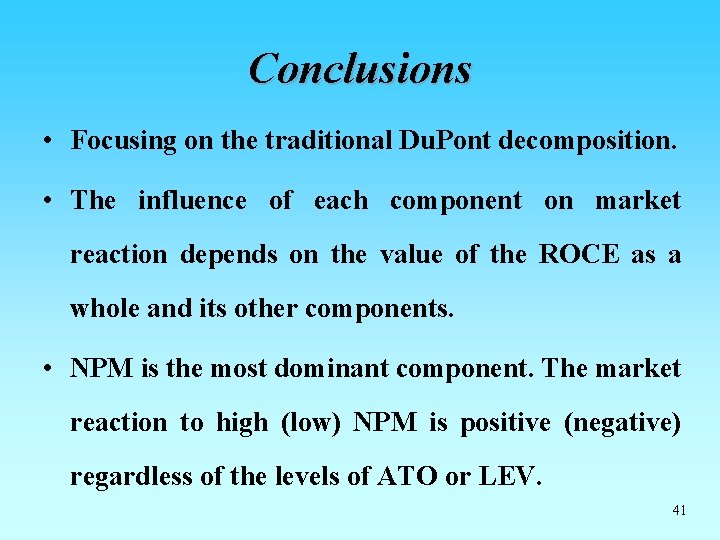
Conclusions • Focusing on the traditional Du. Pont decomposition. • The influence of each component on market reaction depends on the value of the ROCE as a whole and its other components. • NPM is the most dominant component. The market reaction to high (low) NPM is positive (negative) regardless of the levels of ATO or LEV. 41
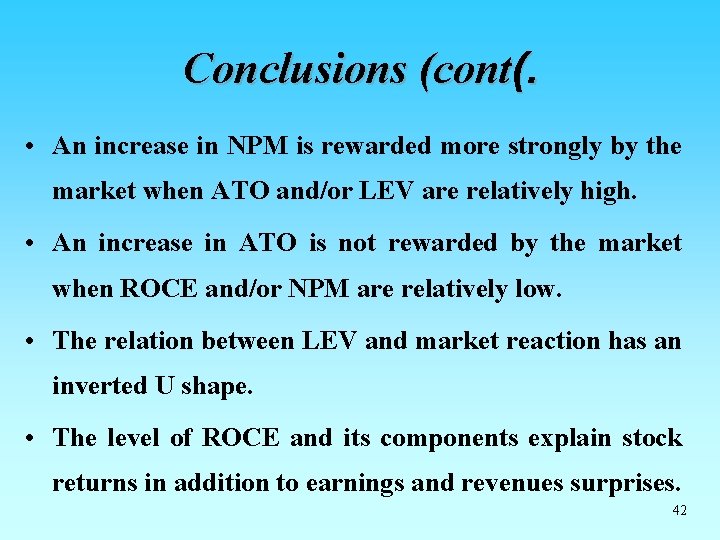
Conclusions (cont(. • An increase in NPM is rewarded more strongly by the market when ATO and/or LEV are relatively high. • An increase in ATO is not rewarded by the market when ROCE and/or NPM are relatively low. • The relation between LEV and market reaction has an inverted U shape. • The level of ROCE and its components explain stock returns in addition to earnings and revenues surprises. 42