The Market for Corporate Control Market for Corporate

 reallocation of assets • External governance mechanism")


 be the smallest solution to (2)")
 denote the minimal realization")

 b) c) d) e) • •")


 are not")


- Slides: 43
The Market for Corporate Control
Market for Corporate Control • A (major) reallocation of assets • External governance mechanism – One argument that has been raised is that managerial (mis)behavior is not particularly interesting because there is a market for control • A market for managerial talent we might say • Any suboptimal or inefficient behavior that leads to a reduction in firm value will lead to an “arbitrage opportunity” and replacement of existing management
Market for Corporate Control • The main point of this discussion and set of papers is that it appears difficult for a corporate acquirer to capture the value of any gains they add to a corporation. • Example: – Current stock price is $10 per share – The raid succeeds if and only if the raider acquires 50% of the outstanding shares – Post-raid value will be $20 per share
Market for Corporate Control • At what price will the raider make a tender offer? • No current shareholder will tender shares for any price less than $20 (if it is legitimate to assume that each shareholder believes his decision will not affect the success of the offer). • Therefore, the raider receives none of the gains from trade. If the improvements involve a personal cost to the raider, value enhancing takeovers will not occur. • The market for control becomes suspect as a governance mechanism.
Market for Corporate Control • Solutions: – The raider can make a “two-tiered” offer. In our example suppose he makes a first tier offer of $13 per share. If he acquires 50%, anyone who has not tendered their shares will automatically receive a bundle of securities worth $12. 75. It is then optimal for all shareholders to immediately tender. – The raider can dilute a non-tendering shareholder’s value ex post, so the reservation value for not tendering is no longer $20. – The raider can acquire a “toehold” anonymously (or before it is known he plans to make improvements). Takeover costs can then be compensated through toehold profits. Kyle and Vila (1991) use noise traders as a way for raider to acquire a toehold. – If there a finite number of shareholders the assumption that all shareholders not pivotal may no longer be valid. Bagnoli and Lipman (1988).
Grossman and Hart • Let be the firm profit under current management – where a is the action chosen by the management. • Let be the profit under the raider. • We will be most interested in the case where ε is positive.
GH • For this discussion we can also ignore the effect of the manager’s choice. – This is not true for all of GH’s results but it is for the results I will discuss. • Thus is a constant. The question of whether the possibility of a hostile takeover alters managerial behavior is an interesting one but separate from this discussion.
GH • We assume that raids succeed if and only if the raider is able to acquire 50% of the outstanding shares. • Let p be the tender offer price. – Shareholders tender if and only if p is at least v. – If raids involve costs (under rational expectations), they should not occur.
GH • Resolving the dilemma – Assume the raider can dilute the value of minority shareholders ex post. • He may make advantageous deals with firms of which he is an owner. • May pay himself excess compensation. Etc. – Let Φ be the maximum possible dilution so, ex post, shares are worth.
GH • Consider the bid: • Shareholders will tender for this offer and will not do so for any lower offer. • The raider’s profit is: – where c is the cost of the raid (or the cost of improvements). • Raids occur if and only if both dilution and improvements exceed the cost.
GH • Grossman and Hart go on to assert that firms can determine (or at least affect) the level of dilution that is possible. – Firms do so when setting up their charter. They choose structures/rules that either encourage or penalize takeovers.
GH • Grossman and Hart characterize the optimal level of dilution when the value of a raid is given as – i. e. when improvements are unknown ex ante. • Their main result is that the optimal level of dilution is interior. – If dilution is too low, too few raids will occur and if it is too high, more raids occur but shareholders will be diluted by too much ex post. – They also examine the impact of the dilution choice on the incumbent manager’s behavior.
Shleifer and Vishney • Now, dilution is out, the focus is on toeholds. • A large risk neutral monitor L owns a stake α which we take as fixed for now. • The question: will L implement stochastic value additions? • The other 1 – α shares are held by atomistic investors. L can only implement the value additions if he purchases a controlling stake in the firm (assumed to be 50%).
SV • L’s value addition is uncertain: – Invests in “research” with intensity I in order to 1) ascertain whether he can add value and 2) how large the value improvement will be. – Assume that with probability I the improvements will be possible – Value additions Z are distributed according to cdf F(Z) – Research has a cost c(I), increasing and concave – The takeover itself has a deadweight cost of c. T
SV • Current share value is q • Thus the post improvement value, if a takeover occurs, will be q+z, where z is the realization of the value improvement – q plays no role in the analysis so I will set it to 0 • Let π be the tender offer price • Assume that if fewer than. 5 – α shares are tendered all shares are returned to their owners
SV • Will the monitor act? For a given realization z of the value of improvements, the monitor will implement a takeover if • where. 5 – α shares are purchased for π • Note equation (1) can be written • This makes it clear that π may exceed z • Monitor may overbid, losing some on purchased shares if he profits enough on his toehold
SV • Will shareholders tender? Shareholders do not know z, they have only their expectations based on knowledge of F(Z) and that knowledge L has acted (a tender is on the table) • There are potentially two types of equilibria – Separating – bids by monitors reveal z – SV consider semi-pooling in which all types with a z larger than some threshold implement a takeover and use the same bid π* – No argument is made that a separating equilibrium does not exist, however similar to GH’s argument it seems they may not. If bids revealed type, shareholders would not tender for bids less than z. Thus no research and no takeovers given the costs.
SV • Shareholders tender if • Let π*(α) be the smallest solution to (2) • Theorem: there is a sequential eq in which the monitor bids π*(α) • Lemma 1: takeover premia decrease in the insider’s position – The insider can offer a low takeover premium if he can convince investors little value has been added – With a large ex ante stake, it takes less of a value addition to implement a takeover, lowering the investors conditional expectation – Perhaps a bit counter-intuitive, one might expect that the larger the toehold the more value would be expected to be created and that larger value creation would be associated with higher premia. – Also note that when α = 0 eqn (1) can be written z > π and no one would tender. Takeovers occur only when monitor has a non-trivial stake – replicating GH’s result.
SV • How much research gets done? – Let zc(α) denote the minimal realization of Z for which takeovers are profitable. – Eqn (1) tells us that zc(α) is a decreasing function of α – The expected profit of monitors , conditional on finding a value improvement is – Thus the monitor’s unconditional profit is I times (3) minus c(I).
SV • Writing the FOC and applying the implicit function theorem gives • Lemma 3: I(α) is an increasing function of α • An insider with a large position is more likely to effect change – higher research intensity – that’s nice to see. • However, the average amount of change he effects is smaller than if he had a smaller stake. – Here the distribution of Z is independent of I – The result is different with a different research production function but much messier
M&A gains • Potential sources of gains: a) b) c) d) e) • • Economies of scale or scope (synergies) Target is being mismanaged Transfer from other “stakeholders” Target is simply undervalued Market power From a social and macro standpoint, a) and b) are (maybe) positive, c) and d) are (maybe) neutral, and e) is negative Q: How big are the gains? How are they distributed? (What are their sources? ) – Policy implications?
• “Fact” 1: Bidders’ average market reaction is effectively zero. – Jensen and Ruback: early studies has this negative – Perhaps slightly positive for successful tender offers* …but decreasing over time? (Jarrell, Brickley and Netter 1990) – Perhaps slightly negative for unsuccessful mergers. ** – Negative for large acquirers and stock financed • Caution: In most cases, these studies use a short “window. ” Market reaction may lie outside this window or may contain other information. – Bayazitova et. al. , information “leakage” and findings of long run event studies. *Open market purchases of stock **Purchases of stock at terms negotiated with target management. To further complicate matters, some authors use the term merger only for stock-for-stock deals and acquisition for cash deals, whereas some use the term merger more generically.
• “Fact” 2: Return to targets is large and positive. – For mergers it is larger for successful deals. – For tender offers it is larger for unsuccessful deals (an indication that offer is likely to go higher? ) • “Fact” 3: Joint gains are positive and large. – 40 -50% of target pre-acquisition value in some studies – Most give this at about 20 -25% • “Fact” 4: Distribution of gains between target and bidder depends on the number of potential targets and number of potential bidders in the expected way. – James and Wier (1987), Jarrell and Bradley (1980)
Extensions of These Original Studies • Early studies were based on samples of public firms (bidders and targets). – Show significant acquirer losses on average • Why are firms allowed to acquire other firms? • SDC data base allowed consideration of private targets. • Acquirer losses apply only to acquisitions of public targets (which account for only 20% of all mergers). – Acquisitions of non-public targets have positive acquirer returns. Moeller, Schlingemann and Stulz (2004) – Using SDC data, stock financed acquisitions as well as all mergers together have positive acquirer returns. – Data source changes conclusions. But why?
Sorting out the source of gains… • Undervalued target theory – No real support. The price of targets which are not ultimately acquired is not higher than their pre-event value. • Other stakeholders? – IRS: Taxes might explain some of it, but not all. (Auerbach and Reishus 1987) – Bondholders: Do not appear to lose (Denis and Mc. Connell 1986 and Lehn and Poulsen 1987) – Labor: Little systematic evidence. – Jensen/Ruback and Jarrell/Brickley/Netter seemed convinced that redistribution cannot explain the gains, although the evidence is not complete.
Market Power Hypothesis • Some literature looks at the stock price reaction of rivals. – Stillman (1983), Eckbo (1983) little reaction • But the testable hypothesis is not clear. – In the standard Cournot model, a decrease in the number of firms raises prices and benefits all producers. • One merger may also signal the beginning of a wave. – But in some industries being the small guy might be bad news when the big guy gains market power. In other words Cournot may not be the right model of industry competition.
Morck Shleifer and Vishney • Why do the acquirers’ managers choose to acquire? • Hubris Hypothesis – “The others have failed but I’m different” • “Bad” managers want to diversify to protect themselves • Bad managers may want growth for growth’s sake
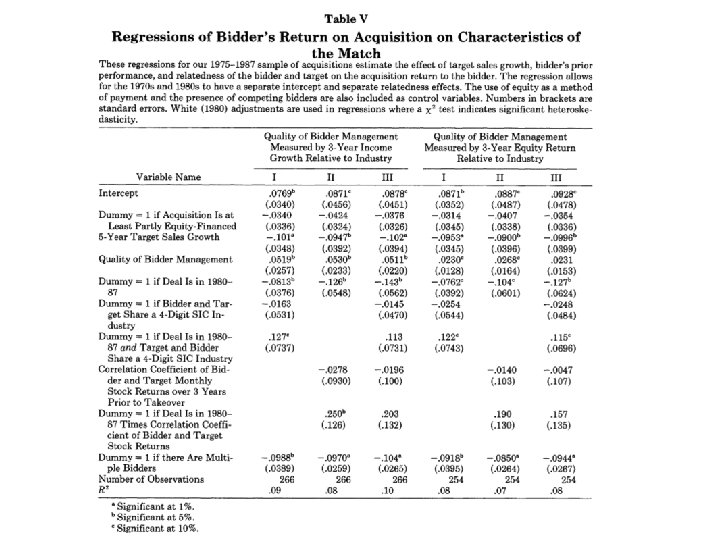
MS&V Table V • Most of their explanatory variables (for bidder gains) are not significant. The exceptions: – Multiple bidders tend to reduce gains to bidders (competition) – Target sales growth has a negative coefficient (buying growth is bad) – Quality of bidder management has a positive sign – Weak evidence that diversifying purchases are bad – Coefficient on “equity-financed” has the predicted negative sign but is insignificant – We have to remember that these results are based on public targets.
MS&V Conclusions • The evidence is – inconsistent with hubris hypothesis • Better managers see higher returns – “suggestive” of managerial conflict-of-interest, managers pursuing their own agendas with shareholder’s money • eg. Buying growth is a bad idea – but that is one of the most commonly discussed motivations for mergers by managers • However Seyhun finds – Prior to takeover announcements, insiders actually increase purchases on their own account – Insiders are betting on their own decisions
Bayazitova et. al. • Consider “mega” and “non-mega” mergers – Largest 1% of mergers by absolute transaction size (normalized by total market capitalization on day of announcement) • Motivated by Moeller, Schlingemann, and Stulz finding that large acquirers have zero announcement returns and small acquirers have positive returns. • These mergers tend to cluster in time between 96 - 01 – Mega-mergers are small subsets of “large acquirers” (2%) and “public targets” (4%) but about 50% of money spent on mergers is spent on mega-mergers – Data considers public and private targets
Bayazitova et. al. • Straight announcement returns say: – Acquirers in mega-mergers have announcement returns of -3. 2% • Average dollar loss $1. 7 b or $415 b in aggregate – Acquirers in non-mega-mergers have announcement returns of 1. 5%. • Difference is robust to known determinants of acquirer returns (acquirer size, target’s public/private status, etc. ) • Difference is robust to measuring deal size excluding the premium (not driven by premium) – Acquirers of public targets have negative returns in both mega-mergers (-3. 77%) and non-mega-mergers (-0. 93%)
Bayazitova et. al. • A nice innovation in this paper is that they use 3 approaches to try to separate any acquirer “revaluation” effect from “value creation” – Consider acquirer’s abnormal return at announcement that a bid has failed • If a merger creates value the news of its failure should lead to negative returns – Infer value creation from Value Line analyst forecasts • Pre-closing forecasts are for stand alone firms, post-closing forecasts are for combined firm – Consider stock market response for the initial bidder when a competing bid arrives • Similar to first approach
Bayazitova et. al. • Acquirers of public targets do not destroy value, value creation measures are positive despite negative announcement returns. – Negative value creation only in mega-mergers – Large acquirers (non-mega) create value – Acquisitions (non-mega) of public companies create value – However public/private and acquirer size remains important • Large acquirers create less value than small • Acquisitions of public companies create less value than acquisitions of private companies
Bayazitova et. al. • Mega-mergers are different • Acquirers only destroy value in mega-mergers – Average value creation – mega-mergers, -18%, nonmega-mergers, 8% • Acquirer returns, when a bid fails, are positive for mega-mergers and negative for non-megamergers • Findings suggest managerial motives are behind mega-mergers – More free cash flow, more likely to do a mega-merger – Poor corporate governance, more likely – Higher acquirer valuation, more likely
Merger Waves • Efficient? – Response to an industry-specific shock – Add macro-economic value? • Or distortionary? – Hubris, herding, or free cash flow driven
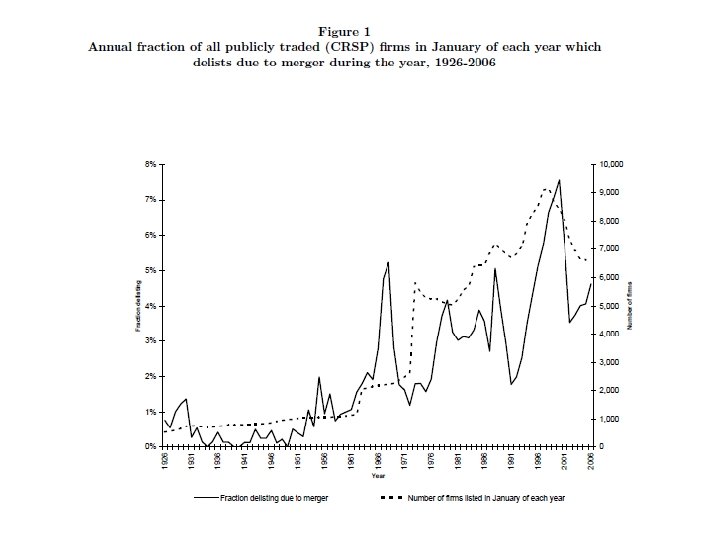
Andrade et al
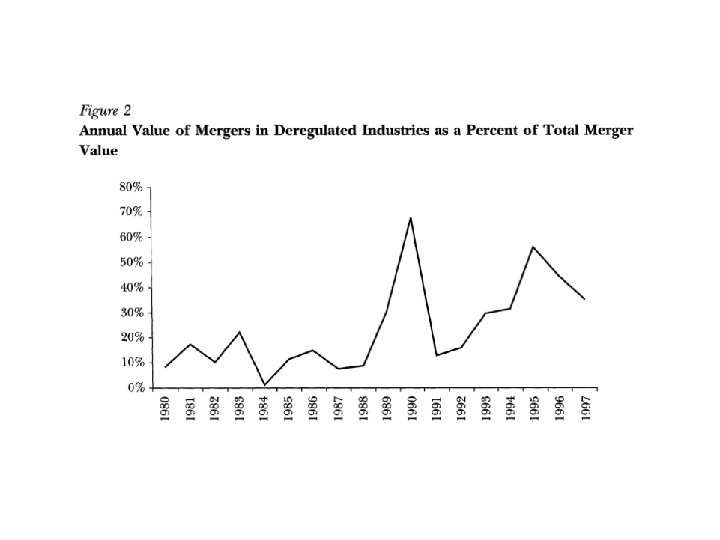
Waves • Rank industries in each decade by merger activity. Correlation of these rankings across time is nearly zero. – Industries that exhibit high levels of merger in one decade are no more likely to do so in other decades. • Mergers come in waves and each wave is different in terms of industry composition. – Then, a significant portion of merger activity may be due to industry level shocks. They cite deregulation as a prime candidate but note that technology shocks or supply shocks may also qualify.
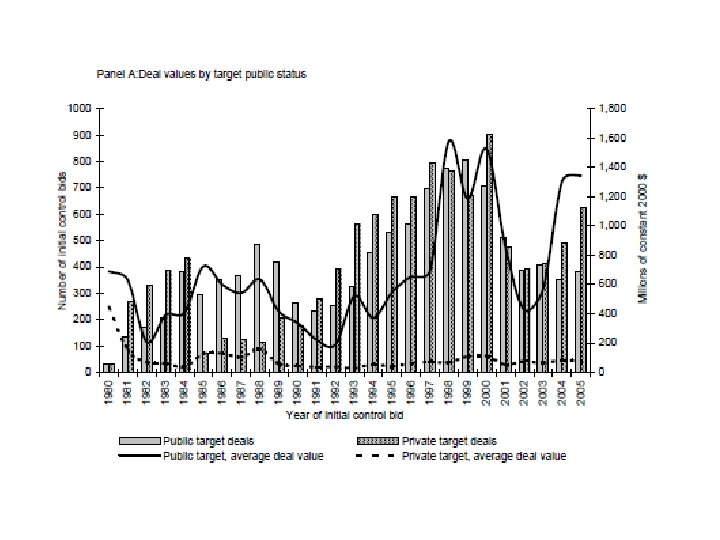
Andrade et. al.
Andrade et. al.