
The living standards of families reporting low incomes

- Slides: 36
The living standards of families reporting low incomes Mike Brewer http: //www. ifs. org. uk/publications/4523 © Institute for Fiscal Studies
Background • “HBAI uses household disposable incomes, adjusted for household size and composition, as a proxy for the material living standards of individuals” • But impression given by income does not always agree with impression given by other measures of living standards, especially for very low incomes • Asked by Child Poverty Unit to investigate this – for families with children only – comparing families with different work states (ie, is mismatch worse for or confined to self-employed? ) – across several datasets and measures of living standards © Institute for Fiscal Studies
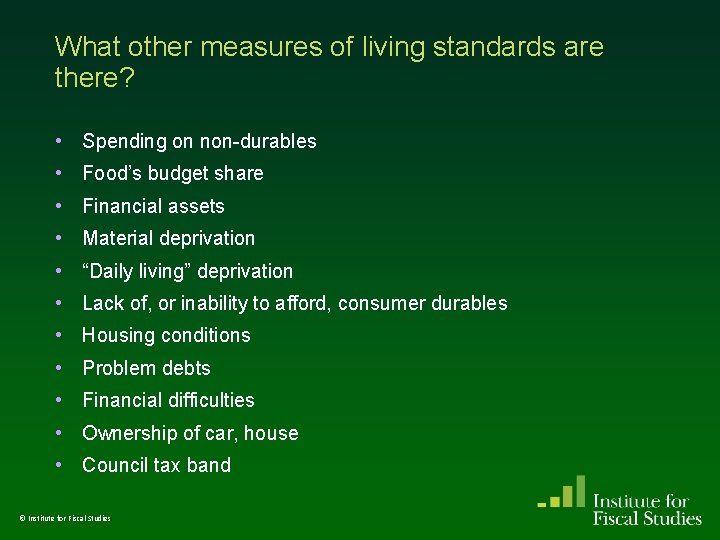
What other measures of living standards are there? • Spending on non-durables • Food’s budget share • Financial assets • Material deprivation • “Daily living” deprivation • Lack of, or inability to afford, consumer durables • Housing conditions • Problem debts • Financial difficulties • Ownership of car, house • Council tax band © Institute for Fiscal Studies
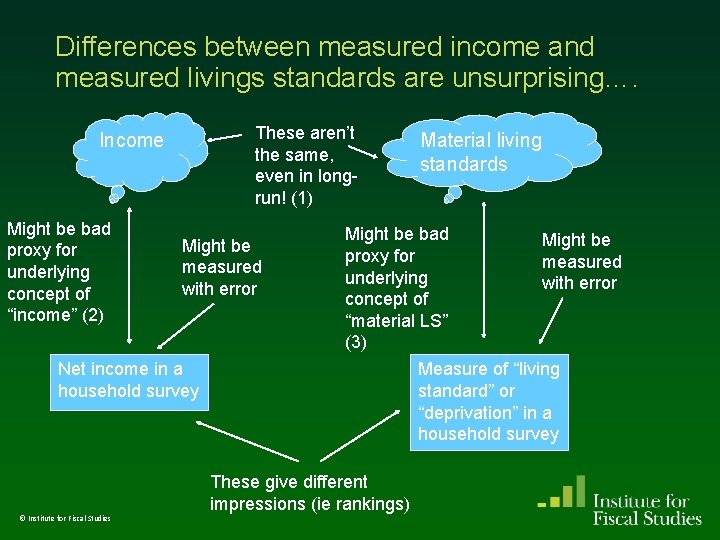
Differences between measured income and measured livings standards are unsurprising…. These aren’t the same, even in longrun! (1) Income Might be bad proxy for underlying concept of “income” (2) Might be measured with error Net income in a household survey Might be bad Might be proxy for measured underlying with error concept of “material LS” (3) Measure of “living standard” or “deprivation” in a household survey These give different impressions (ie rankings) © Institute for Fiscal Studies Material living standards
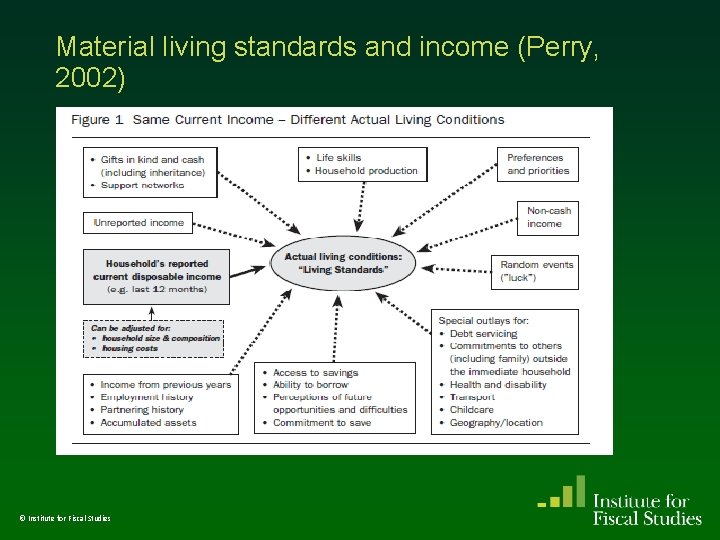
Material living standards and income (Perry, 2002) © Institute for Fiscal Studies
Issues in measuring income • Typical measure of “net income” in UK household surveys has following features: – Measured over short period – Many benefits-in-kind not valued – “Outgoings/costs” not deducted, unless mandated by state, or (as variant) housing – No imputed income for home-owners – No value of home production – Full sharing within a household – Equivalised using Modified OECD scale • In other words, its “equivalised household cash income (plus some very-near-cash Bi. Ks) net of government taxes” • Can take issue with all of these… © Institute for Fiscal Studies
Issues in measuring “living standards”, or collecting proxies for living standards in surveys • “Household spending on non-durables” – “Consumption” not equal to “spending” – Not everyone faces same prices • Engel curves (food’s budget share) – Only ever intended as a proxy • Material deprivation indicators (“enforced lack of…”), or other “hardship” or “financial difficulties” indices – Answers are subjective – Conflates preferences and constraints • Durable ownership, home ownership, car ownership, CT band – Conflates preferences and constraints © Institute for Fiscal Studies
Previous literature (1) • Expenditure vs income – UK: DSS (1991), Saunders et al (2002), Goodman and Oldfield (2004), Attanasio et al (2006), Blundell and Etheridge (2008). – US: Meyer and Sullivan (2003, 2007, 2008) – Spending poverty risk differs from income poverty risk for eg unemployed, self-employed, pensioners – Different trends in inequality and relative poverty – Brewer et al (2006): “a more reliable picture of who is genuinely poor may therefore be obtained from an examination of the bottom of the spending distribution than the income distribution” • Food’s budget share and income – Compare income of households w/ same food budget share to infer • Missing income (of self-employed) • Equivalence scale (given income reported correctly) • Bias in measures of RPI (if comparing over time) © Institute for Fiscal Studies • Difference in price levels (if comparing different groups)
Previous literature (2) • Material deprivation or hardship indices – Internationally: Boarini and Mira d’Ecole (2006) – “Enforced lack”: Townsend (1979), Mack and Lansley (1985), Gordon and Pantazis (1997), Gordon et al (2000) – Official measure in FRS: Mc. Kay and Collard (2004), Willits (2006), DWP (2008), Brewer et al (2008) – From FACS [enforced lack plus others] : Marsh et al (2001), Vegeris and Mc. Kay (2002), Barnes et al. (2008) – From BHPS [enforced lack plus others] : Berthoud et al (2004), Magadi and Middleton (2005 + others) • The mismatch with income is well-known – In UK data: Bradshaw and Finch (2003), Calandrino (2003), Berthoud et al (2004), Brewer et al (2008) – Internationally: Hallerod et al (2006), Perry (2002) © Institute for Fiscal Studies
Previous literature (3) • Dynamics of material deprivation and income: – Material deprivation/hardship indices change by little even when income changes (Berthoud et al, 2004; Barnes et al, 2008) – “Low income and not deprived” more likely to have transitory low income than “low income and deprived” (Mc. Kay and Collard, 2004) • Consistent with – material deprivation being a measure of longer-run living standards than income – measure of income being more error-prone than measure of material deprivation © Institute for Fiscal Studies
So what did we do? • For families with children, compared income to – Spending on non-durables – Food’s budget share – Financial assets – Material deprivation – Daily living deprivation – Lack of, or inability to afford, consumer durables – Housing conditions – Problem debts – Financial difficulties • Looked at different work states (emp, self-employed, workless) • Used EFS, FRS, FACS, BHPS, usually from 2001 to 2006 • Considerable degree of consistency © Institute for Fiscal Studies
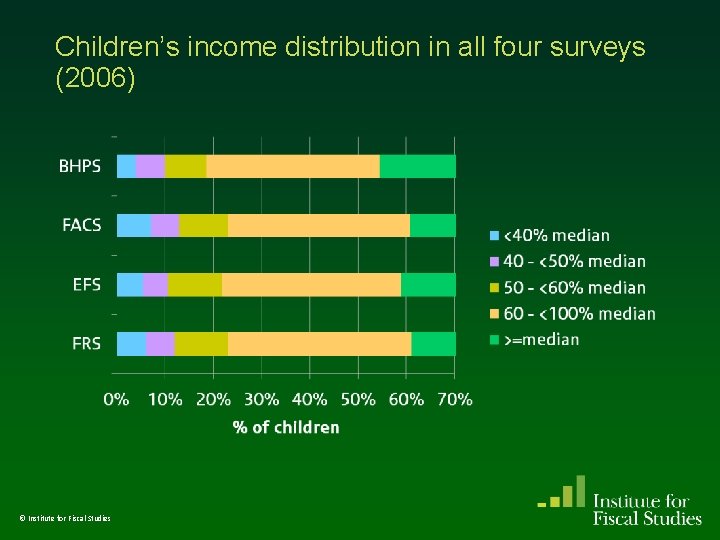
Children’s income distribution in all four surveys (2006) © Institute for Fiscal Studies
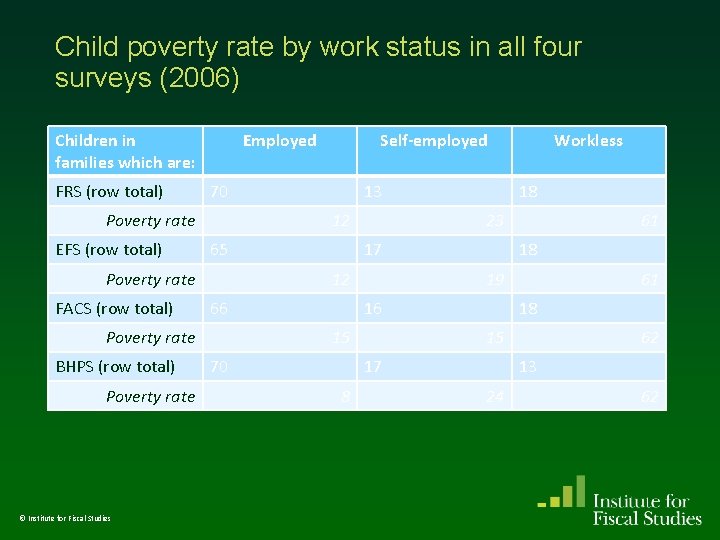
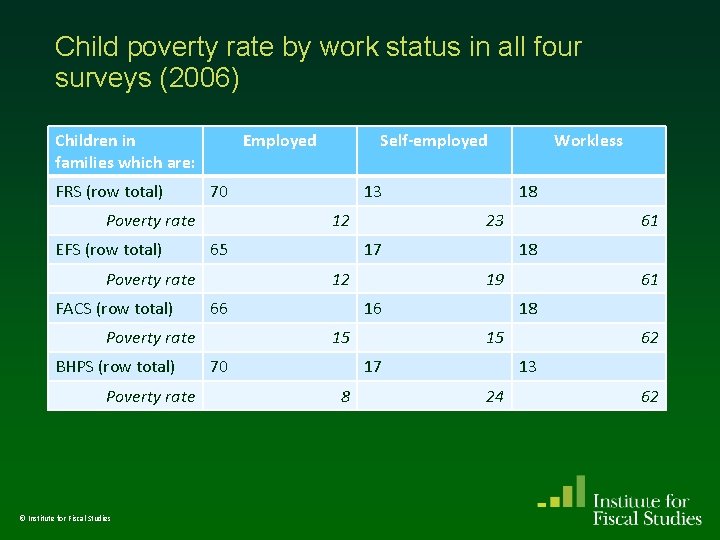
Child poverty rate by work status in all four surveys (2006) Children in families which are: FRS (row total) Employed 70 Poverty rate EFS (row total) 65 Poverty rate © Institute for Fiscal Studies 18 17 66 19 15 61 18 15 17 8 61 18 16 70 Workless 23 12 Poverty rate BHPS (row total) 13 12 Poverty rate FACS (row total) Self-employed 62 13 24 62
Child poverty rate by work status in all four surveys (2006) Children in families which are: FRS (row total) Employed 70 Poverty rate EFS (row total) 65 Poverty rate © Institute for Fiscal Studies 18 17 66 19 15 61 18 15 17 8 61 18 16 70 Workless 23 12 Poverty rate BHPS (row total) 13 12 Poverty rate FACS (row total) Self-employed 62 13 24 62
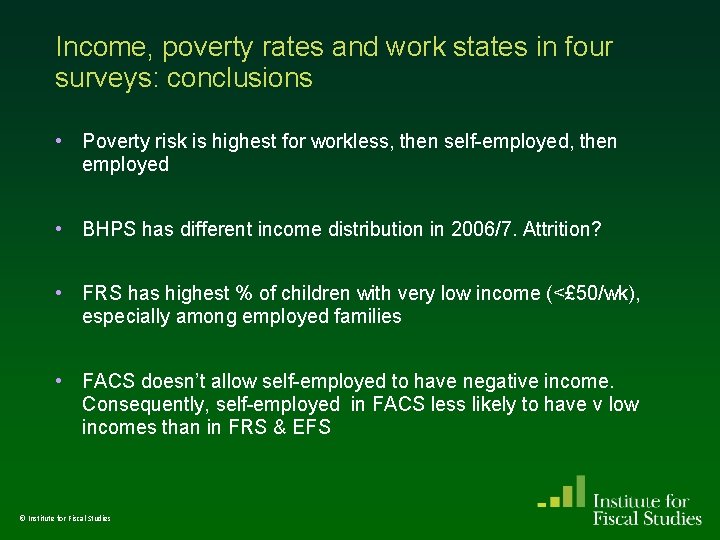
Income, poverty rates and work states in four surveys: conclusions • Poverty risk is highest for workless, then self-employed, then employed • BHPS has different income distribution in 2006/7. Attrition? • FRS has highest % of children with very low income (<£ 50/wk), especially among employed families • FACS doesn’t allow self-employed to have negative income. Consequently, self-employed in FACS less likely to have v low incomes than in FRS & EFS © Institute for Fiscal Studies
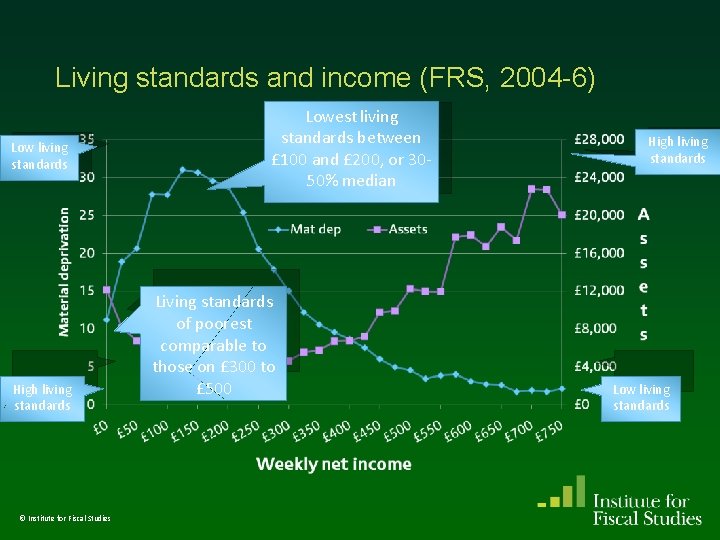
Living standards and income (FRS, 2004 -6) Low living standards High living standards © Institute for Fiscal Studies Lowest living standards between £ 100 and £ 200, or 3050% median Living standards of poorest comparable to those on £ 300 to £ 500 High living standards Low living standards
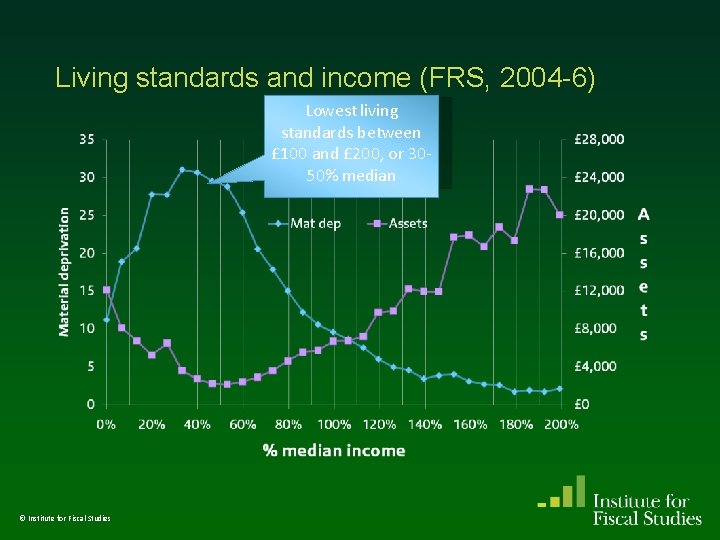
Living standards and income (FRS, 2004 -6) Lowest living standards between £ 100 and £ 200, or 3050% median © Institute for Fiscal Studies
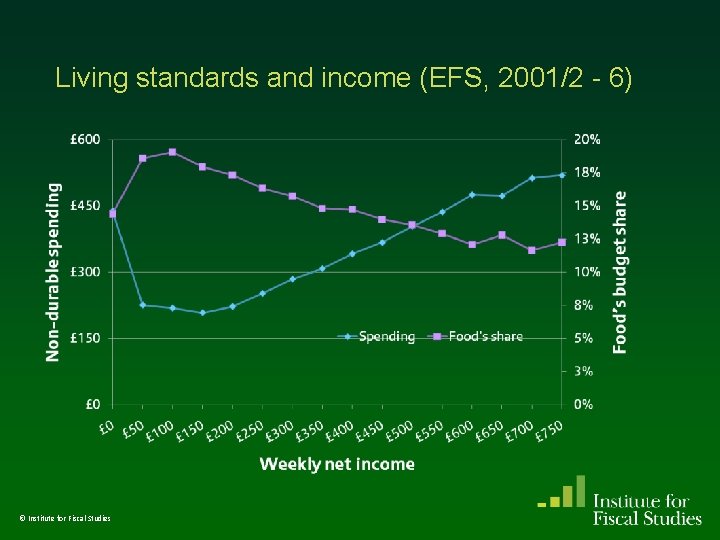
Living standards and income (EFS, 2001/2 - 6) © Institute for Fiscal Studies
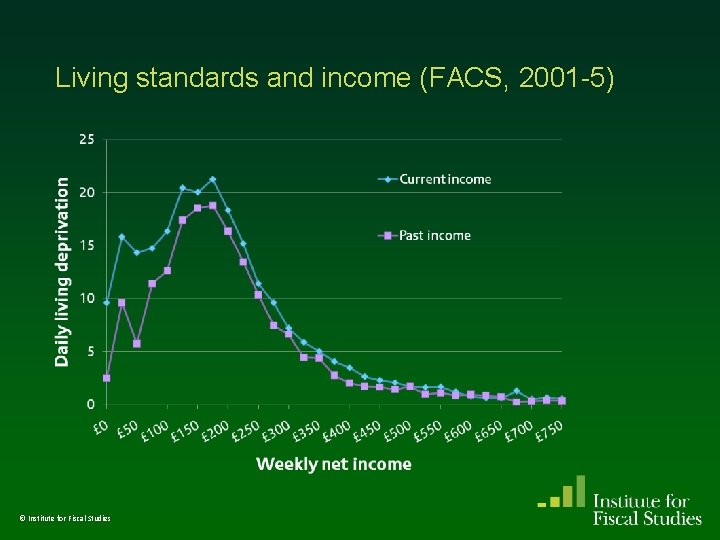
Living standards and income (FACS, 2001 -5) © Institute for Fiscal Studies
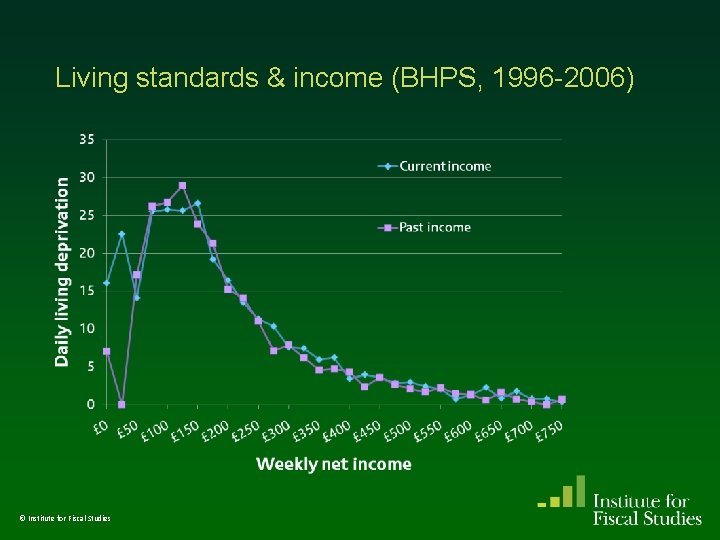
Living standards & income (BHPS, 1996 -2006) © Institute for Fiscal Studies
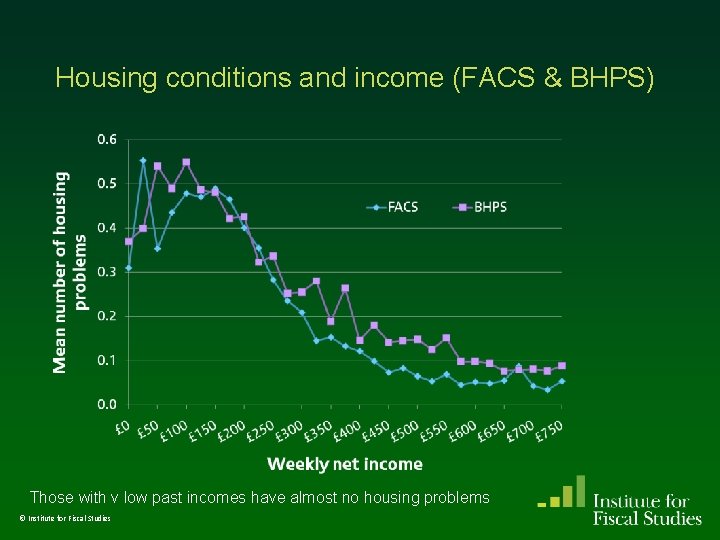
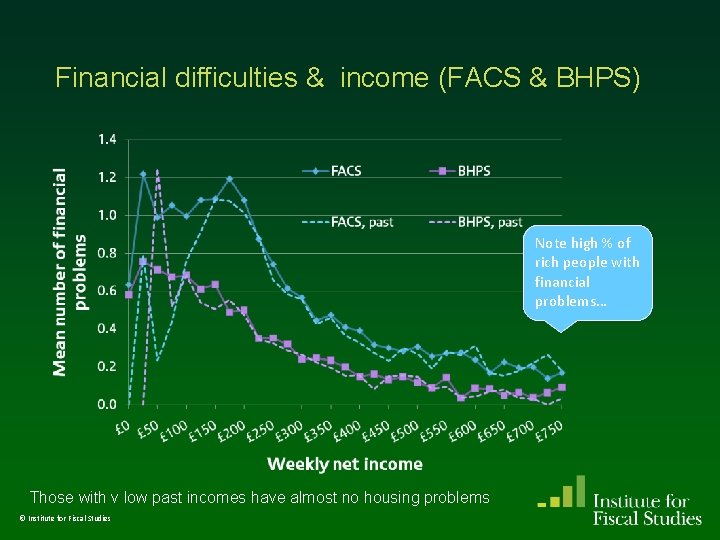
Housing conditions and income (FACS & BHPS) Those with v low past incomes have almost no housing problems © Institute for Fiscal Studies
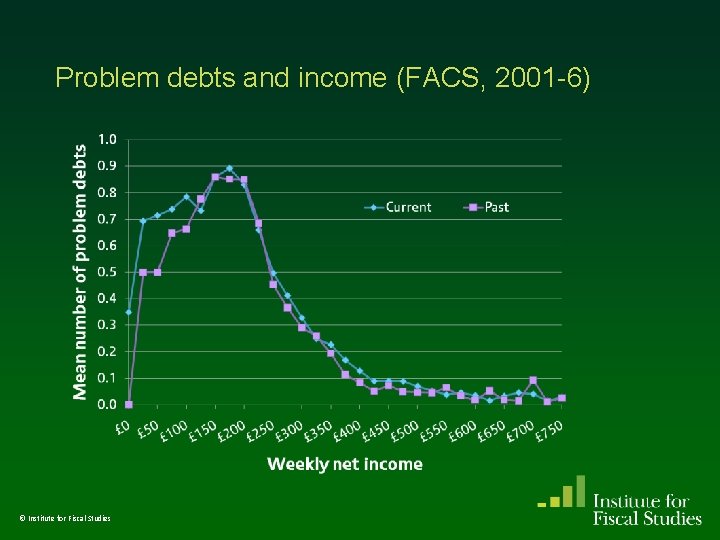
Problem debts and income (FACS, 2001 -6) © Institute for Fiscal Studies
Financial difficulties & income (FACS & BHPS) Note high % of rich people with financial problems… Those with v low past incomes have almost no housing problems © Institute for Fiscal Studies
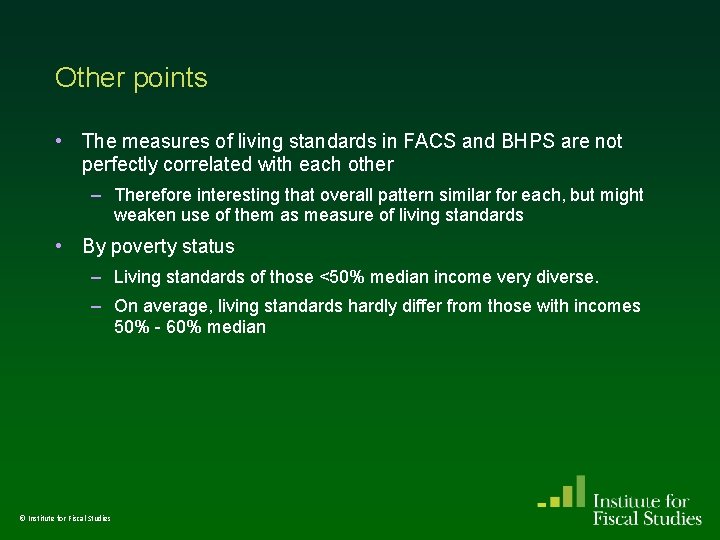
Other points • The measures of living standards in FACS and BHPS are not perfectly correlated with each other – Therefore interesting that overall pattern similar for each, but might weaken use of them as measure of living standards • By poverty status – Living standards of those <50% median income very diverse. – On average, living standards hardly differ from those with incomes 50% - 60% median © Institute for Fiscal Studies
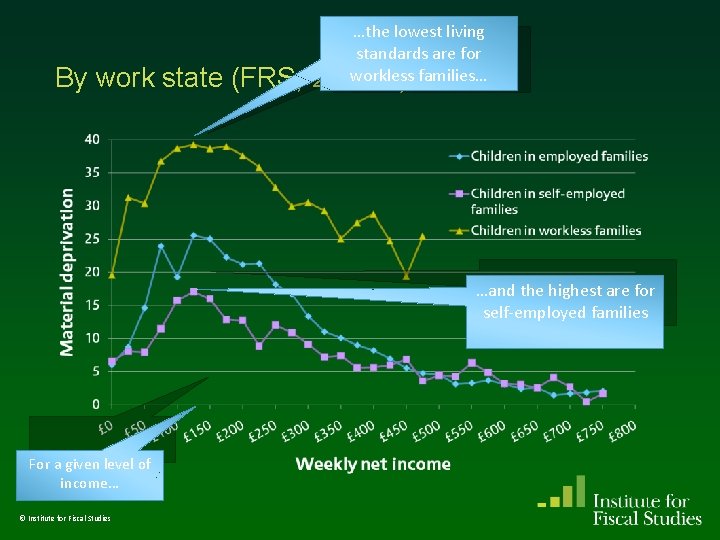
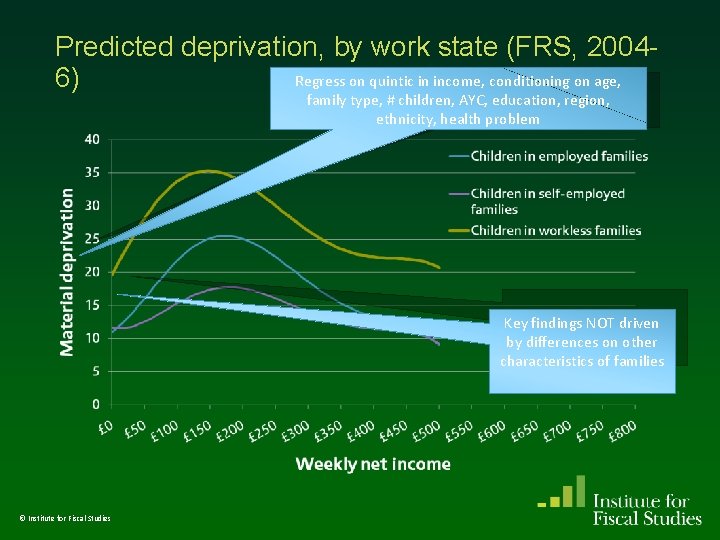
By work state (FRS, …the lowest living standards are for workless families… 2004 -6) …and the highest are for self-employed families For a given level of income… © Institute for Fiscal Studies
Predicted deprivation, by work state (FRS, 2004 Regress on quintic in income, conditioning on age, 6) family type, # children, AYC, education, region, ethnicity, health problem Key findings NOT driven by differences on other characteristics of families © Institute for Fiscal Studies
Other measures omitted to preserve sanity… • Overview – For measures in FACS, and for food’s budget share (EFS), there is less difference between self-employed and employed than other measures/surveys – Conditioning on other variables reduces the difference between s/e and employed families – for all 3 work states, average living standards of those below 50% median income similar to those between 50% and 60% median income © Institute for Fiscal Studies
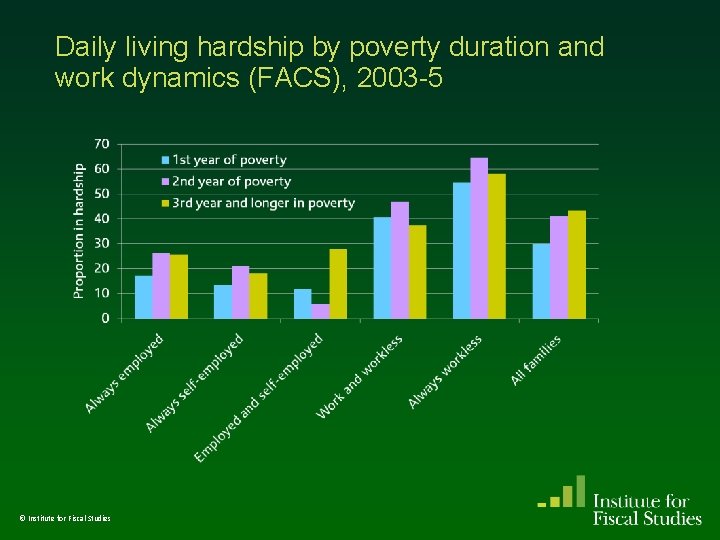
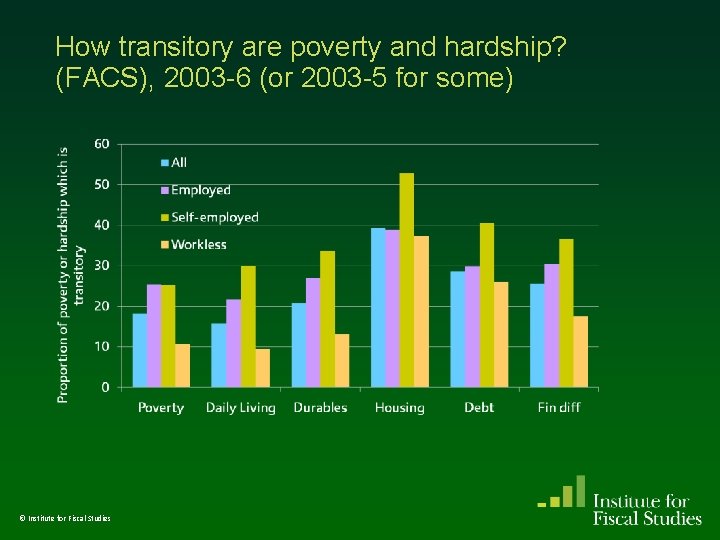
Dynamics of work, poverty and living standards • This was small part of project; much more could be investigated – See also Browne and Paull, 2010, on work and poverty dynamics amongst families with children • Some findings support previous analysis – Differences between work states in living standards exists even if condition on years in poverty • Some are in line with past research – Hardship rates rise with poverty duration, but slowly, and some longterm-poor families are not in any sort of hardship • Some findings are surprising – Most (discrete) hardship measures show at least as much transiency as (discrete) poverty measure © Institute for Fiscal Studies
Daily living hardship by poverty duration and work dynamics (FACS), 2003 -5 © Institute for Fiscal Studies
How transitory are poverty and hardship? (FACS), 2003 -6 (or 2003 -5 for some) © Institute for Fiscal Studies
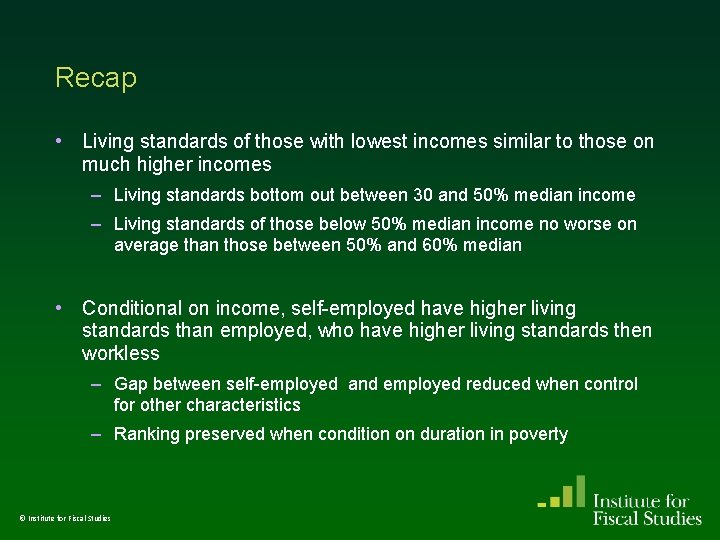
Recap • Living standards of those with lowest incomes similar to those on much higher incomes – Living standards bottom out between 30 and 50% median income – Living standards of those below 50% median income no worse on average than those between 50% and 60% median • Conditional on income, self-employed have higher living standards than employed, who have higher living standards then workless – Gap between self-employed and employed reduced when control for other characteristics – Ranking preserved when condition on duration in poverty © Institute for Fiscal Studies
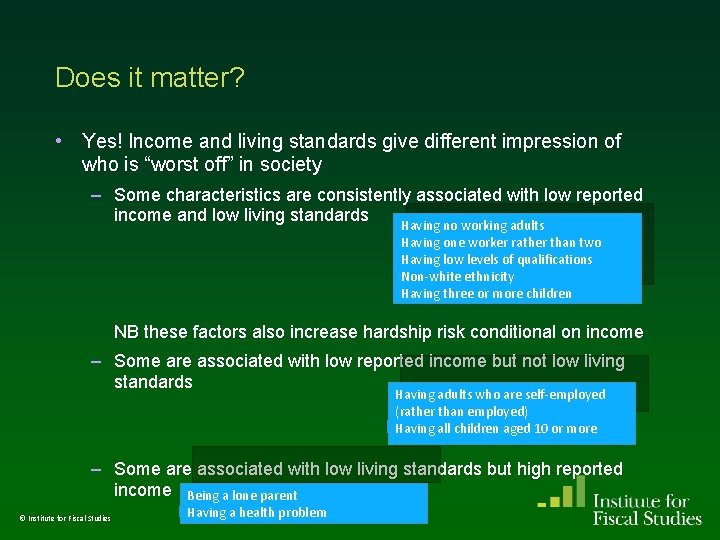
Does it matter? • Yes! Income and living standards give different impression of who is “worst off” in society – Some characteristics are consistently associated with low reported income and low living standards Having no working adults Having one worker rather than two Having low levels of qualifications Non-white ethnicity Having three or more children NB these factors also increase hardship risk conditional on income – Some are associated with low reported income but not low living standards Having adults who are self-employed (rather than employed) Having all children aged 10 or more – Some are associated with low living standards but high reported income Being a lone parent © Institute for Fiscal Studies Having a health problem
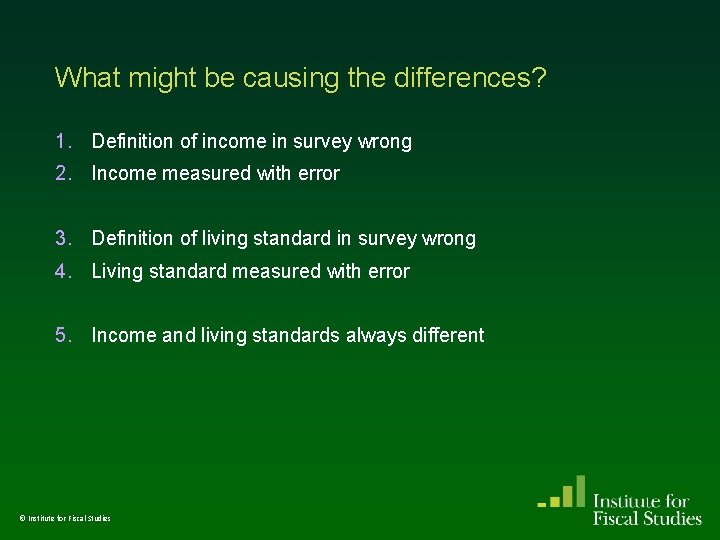
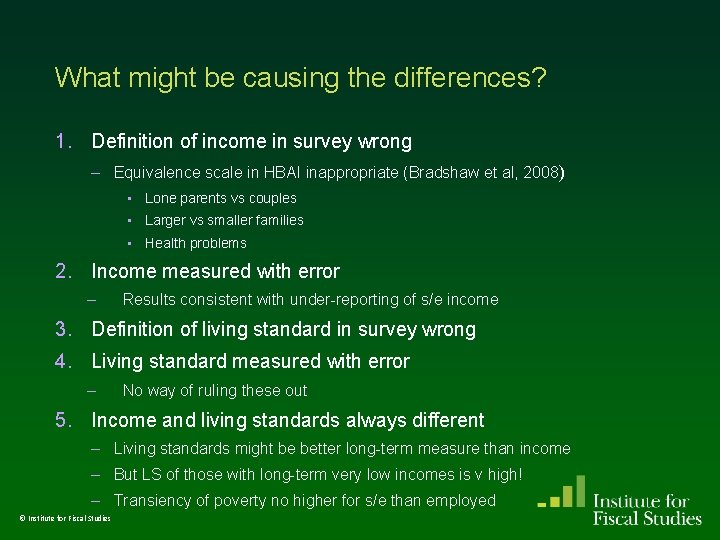
What might be causing the differences? 1. Definition of income in survey wrong 2. Income measured with error 3. Definition of living standard in survey wrong 4. Living standard measured with error 5. Income and living standards always different © Institute for Fiscal Studies
What might be causing the differences? 1. Definition of income in survey wrong – Equivalence scale in HBAI inappropriate (Bradshaw et al, 2008) • Lone parents vs couples • Larger vs smaller families • Health problems 2. Income measured with error – Results consistent with under-reporting of s/e income 3. Definition of living standard in survey wrong 4. Living standard measured with error – No way of ruling these out 5. Income and living standards always different – Living standards might be better long-term measure than income – But LS of those with long-term very low incomes is v high! – Transiency of poverty no higher for s/e than employed © Institute for Fiscal Studies
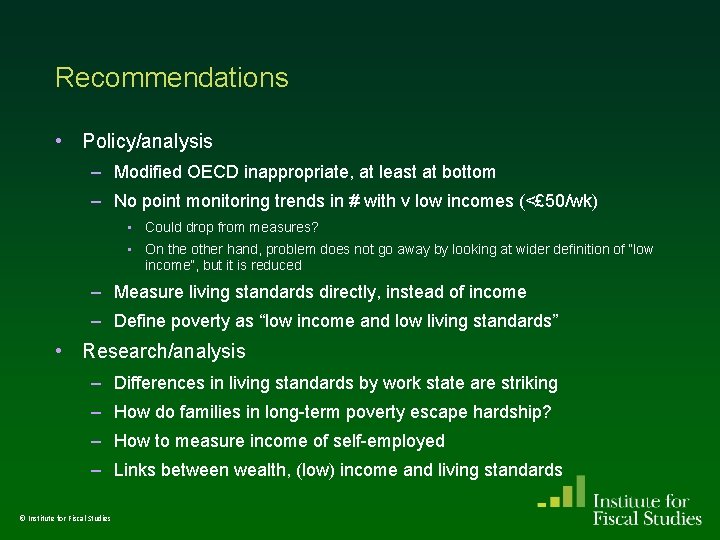
Recommendations • Policy/analysis – Modified OECD inappropriate, at least at bottom – No point monitoring trends in # with v low incomes (<£ 50/wk) • Could drop from measures? • On the other hand, problem does not go away by looking at wider definition of “low income”, but it is reduced – Measure living standards directly, instead of income – Define poverty as “low income and low living standards” • Research/analysis – Differences in living standards by work state are striking – How do families in long-term poverty escape hardship? – How to measure income of self-employed – Links between wealth, (low) income and living standards © Institute for Fiscal Studies
The living standards of families reporting low incomes Mike Brewer, Cormac O’Dea, Gillian Paull, Luke Sibieta Department for Work and Pensions Research Report 577 http: //www. ifs. org. uk/publications/4523 © Institute for Fiscal Studies