The linear systems model of f MRI Strengths


 estimated temporal MTF in V 1 – Showed")

 estimated spatial MTF in V 1 – Showed")


 measured responses to 3, 6,")


- Slides: 48
The linear systems model of f. MRI: Strengths and Weaknesses Stephen Engel UCLA Dept. of Psychology
Talk Outline • Linear Systems – Definition – Properties • Applications in f. MRI (Strengths) • Is f. MRI Linear? (Weaknesses) • Implications – Current practices – Future directions
Linear systems · System = input -> output Stimulus or Neural activity -> f. MRI responses · System is linear if shows two properties Homogeneity & Superposition
Useful properties of linear systems • Can add and subtract responses meaningfully • Can characterize completely using impulse response • Can use impulse response to predict output to arbitrary input via convolution • Can characterize using MTF
Subtracting responses
Characterizing linear systems
Predicting block response
Characterizing linear systems
Talk Outline • Linear Systems – Definition – Properties • Applications in f. MRI (Strengths) • Is f. MRI Linear? (Weaknesses) • Implications – Current practices – Future directions
Uses of linear systems in f. MRI • If assume f. MRI signal is generated by a linear system can: – Create model f. MRI timecourses – Use GLM to estimate and test parameters – Interpret estimated parameters – Estimate temporal and spatial MTF
Simple GLM Example
Model fitting assumes homogeneity
Rapid designs assume superposition
Wagner et al. 1998, Results
Zarahn, ‘ 99; D’esposito et al.
D’Esposito et al.
More on GLM • Many other analysis types possible – ANCOVA – Simultaneous estimate of HRF • Interpretation of estimated parameters – If f. MRI data are generated from linear system w/neural activity as input – Then estimated parameters will be proportional to neural activity • Allows quantitative conclusions
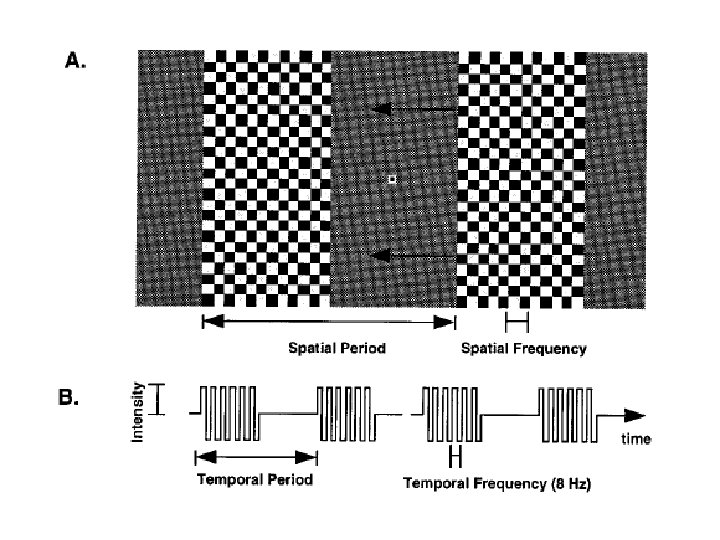
MTF • Boynton et al. (1996) estimated temporal MTF in V 1 – Showed moving bars of checkerboard that drifted at various temporal frequencies – Generated periodic stimulation in retinotopic cortex – Plotted Fourier transform of MTF (which is impulse response)
Characterizing linear systems
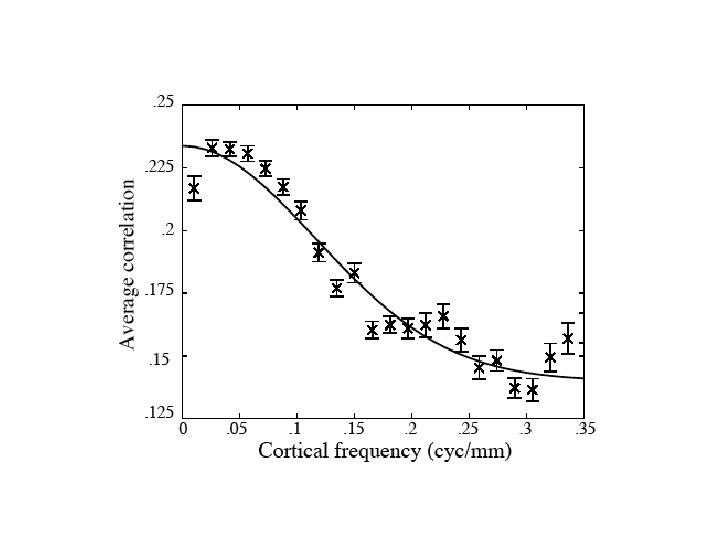
MTF • Engel et al. (1997) estimated spatial MTF in V 1 – Showed moving bars of checkerboard that varied in spatial frequency but had constant temporal frequency – Calculated cortical frequency of stimulus – Plotted MTF – Some signal at 5 mm/cyc at 1. 5 T in ‘ 97!
Talk Outline • Linear Systems – Definition – Properties • Applications in f. MRI (Strengths) • Is f. MRI Linear? (Weaknesses) • Implications – Current practices – Future directions
Is f. MRI really based upon a linear system? • Neural activity as input f. MRI signal as output • f. MRI tests of temporal superposition • Electrophysiological tests of homogeneity • f. MRI test of spatial superposition
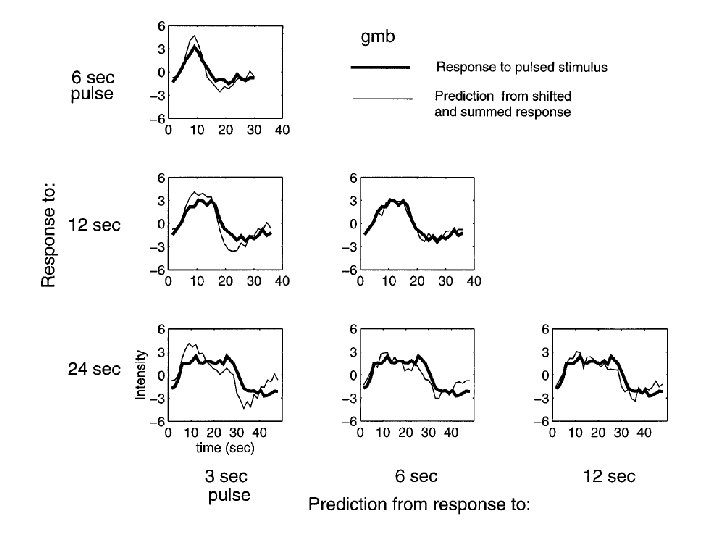
Tests of temporal superposition • Boynton et al. (1996) measured responses to 3, 6, 12, and 24 sec blocks of visual stimulation • Tested if r(6) = r(3)+r(3) etc. • Linearity fails mildly
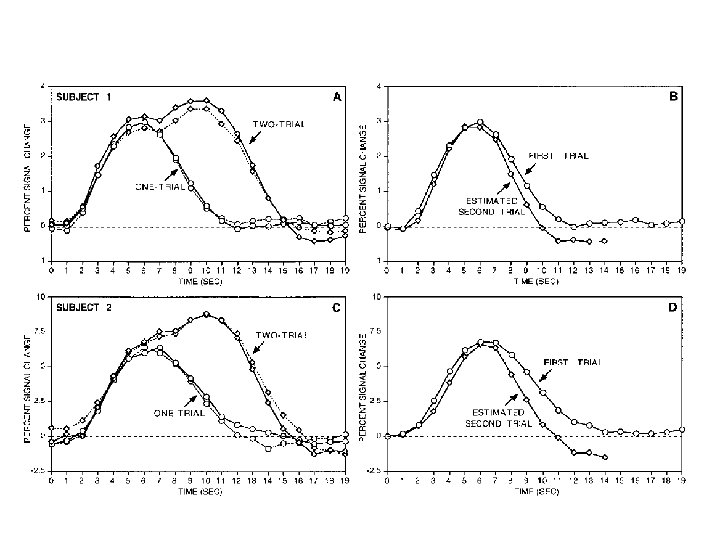
Dale & Buckner ‘ 97 • Tested superposition in rapid design · Full field stimuli · Groups of 1, 2, or 3 – Closely spaced in time – Responses overlap · Q 1: 2 -1 = 1?
Dale and Buckner, Design
f. MRI fails temporal superposition • Now many studies • Initial response is larger than later response • Looks OK w/3 -5 second gap • Possible sources – Attention – Neural adaptation – Hemodynamic non-linearity
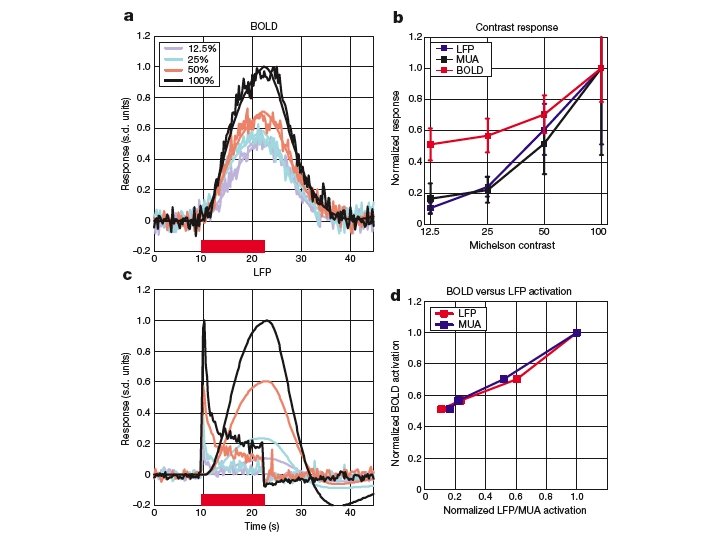
Test of homogeneity • Simultaneous measurements of neural activity and f. MRI or optical signal • Q: As neural activity increases does f. MRI response increase by same amount?
Logothetis et al. , ‘ 01
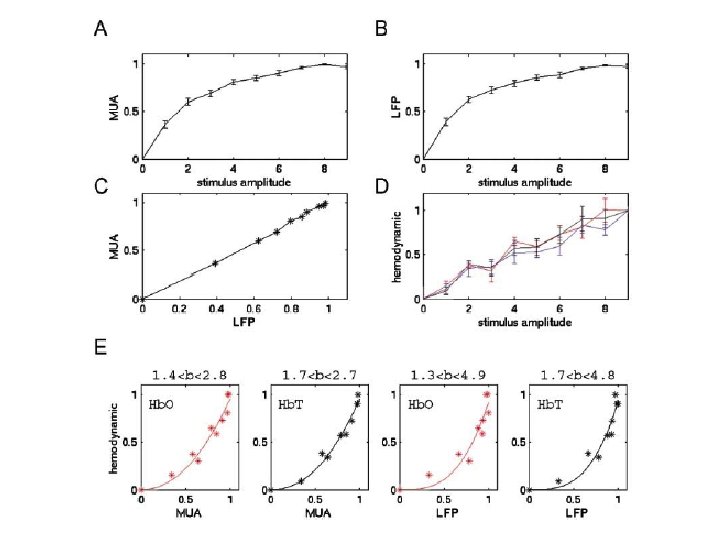
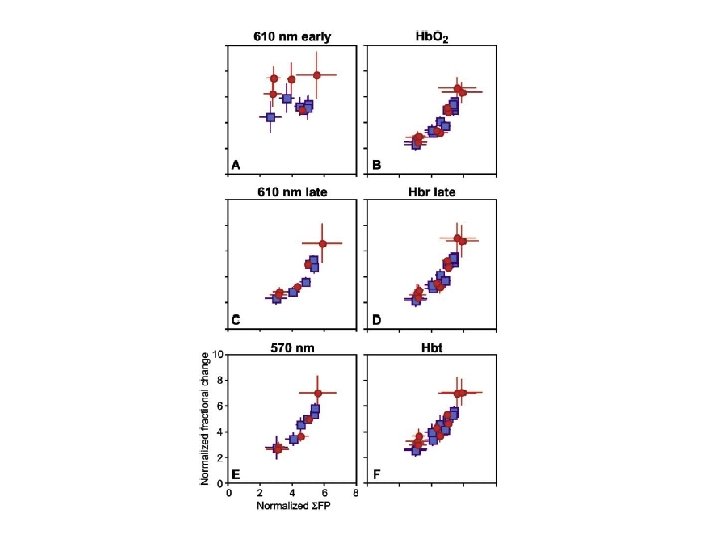
Optical imaging studies • Measure electrophysiological response in rodents • Various components of hemodynamic response inferred from reflectance changes at different wavelengths • Devor ‘ 03 (whisker) and Sheth ‘ 04 (hindpaw)
Nonlinearities • Optical imaging overestimates large neural responses relative to small ones – But Logo. found opposite • f. MRI overestimates brief responses relative to long ones – Amplified neural adaptation?
Spatial issue • W/in a local region does signal depend upon sum or average activity? • Or “is the whole garden watered for the sake of one thirsty flower? ” (Grinvald)
Spatial Properties of HRF Thompson et al. , 2003
Testing spatial superposition • Need to measure responses of neurons from population a, population b, and both • Where have intermingled populations that can activate separately? – LGN – Prediction twice as much f. MRI response for two eye stimulation than for one eye • Should be different in V 1
Conclusions • Linear model successful and useful but… • Hemodynamic responses possibly not proportional to neural ones – Though could be pretty close for much of range – Take care interpreting • differences in f. MRI amplitude • GLM results where neural responses overlap
Conclusions • Temporal superposition of hemodynamic responses could still hold – Most applications of GLM may be OK w/proper interpretation and spacing to avoid neural adaptation – Run estimated f. MRI amplitude through inverse of nonlinearity relating hemodynamics to neural activity (static nonlinearity)
Rapid designs assume superposition
Future Directions • Better characterization of possible nonlinearities • Modeling of non-linearities • Further tests of linearity – Hemodynamic superposition – Spatial superposition