
The Level and Quality of ValueatRisk Disclosure by

The Level and Quality of Value-at-Risk Disclosure by Commercial Banks Christophe Pérignon, HEC Paris Daniel R. Smith, Simon Fraser University Risk Management in Financial Institutions 23 -25 April 2009 1
Introduction “Disclosure of quantitative measures of market risk, such as value-at-risk is enlightening only when accompanied by a thorough discussion of how the risk measures were calculated and how they related to actual performance” Alan Greenspan 2
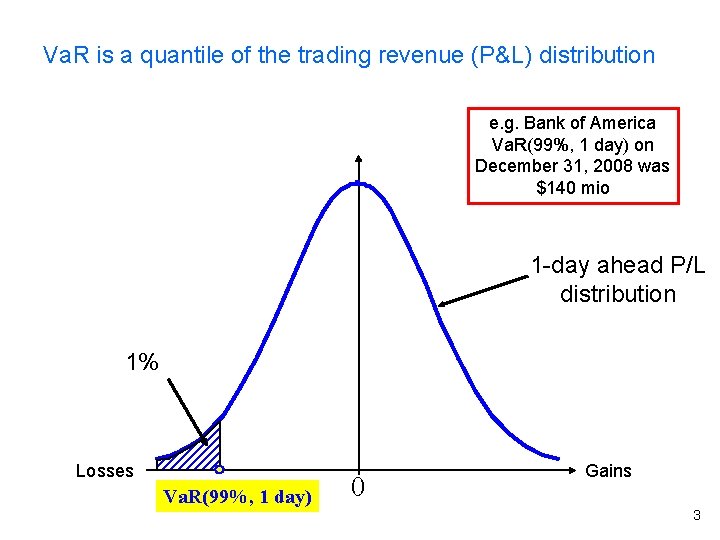
Va. R is a quantile of the trading revenue (P&L) distribution e. g. Bank of America Va. R(99%, 1 day) on December 31, 2008 was $140 mio 1 -day ahead P/L distribution 1% Losses Va. R(99%, 1 day) 0 Gains 3
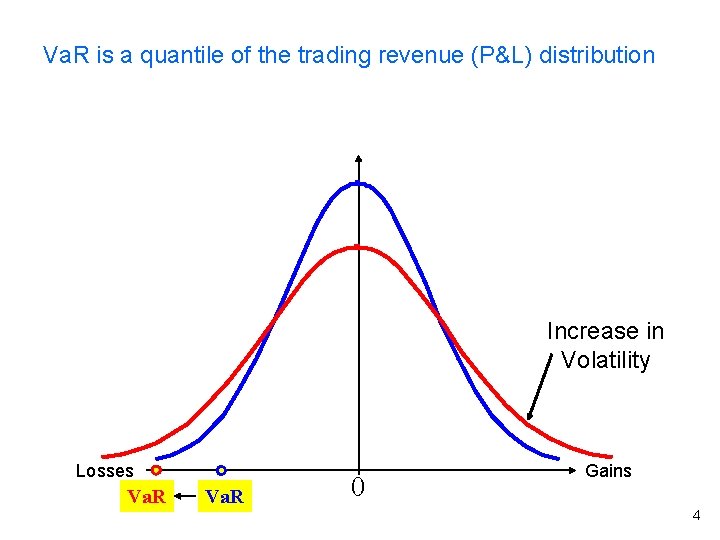
Va. R is a quantile of the trading revenue (P&L) distribution Increase in Volatility Losses Va. R 0 Gains 4
Our Objective • Joint Assessment of: Level Quality of Va. R disclosure by commercial banks • When quantity and quality are both at acceptable levels Reduction in information asymmetry 5
Our Contributions • Survey of actual Va. R disclosures in the world • Formal test of whether daily Va. Rs are – Accurate: Lead to the correct number of exceptions – Informative: Forecast next-day volatility of trading revenues 6
Part 1: Level of Va. R Disclosure • Va. R Disclosure Index (Va. RDI) • Sample: 10 largest US commercial banks, 6 largest Canadian commercial banks, and top-50 international commercial banks • Sample Period: Entire post-1996 Market Risk Amendment period for US and Canadian banks, and year 2005 for top-50 international banks • Data Source: Annual reports 7
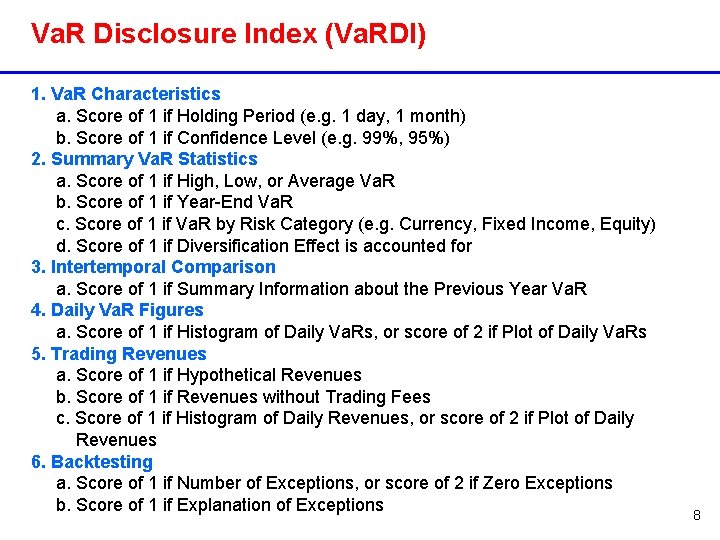
Va. R Disclosure Index (Va. RDI) 1. Va. R Characteristics a. Score of 1 if Holding Period (e. g. 1 day, 1 month) b. Score of 1 if Confidence Level (e. g. 99%, 95%) 2. Summary Va. R Statistics a. Score of 1 if High, Low, or Average Va. R b. Score of 1 if Year-End Va. R c. Score of 1 if Va. R by Risk Category (e. g. Currency, Fixed Income, Equity) d. Score of 1 if Diversification Effect is accounted for 3. Intertemporal Comparison a. Score of 1 if Summary Information about the Previous Year Va. R 4. Daily Va. R Figures a. Score of 1 if Histogram of Daily Va. Rs, or score of 2 if Plot of Daily Va. Rs 5. Trading Revenues a. Score of 1 if Hypothetical Revenues b. Score of 1 if Revenues without Trading Fees c. Score of 1 if Histogram of Daily Revenues, or score of 2 if Plot of Daily Revenues 6. Backtesting a. Score of 1 if Number of Exceptions, or score of 2 if Zero Exceptions b. Score of 1 if Explanation of Exceptions 8
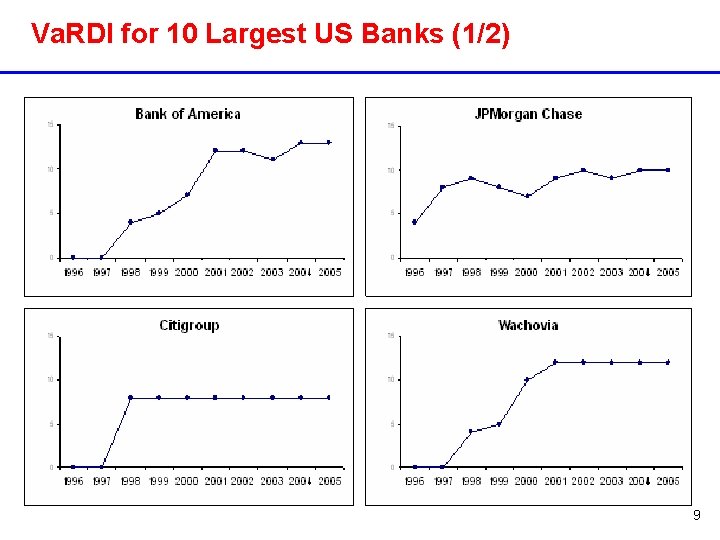
Va. RDI for 10 Largest US Banks (1/2) 9
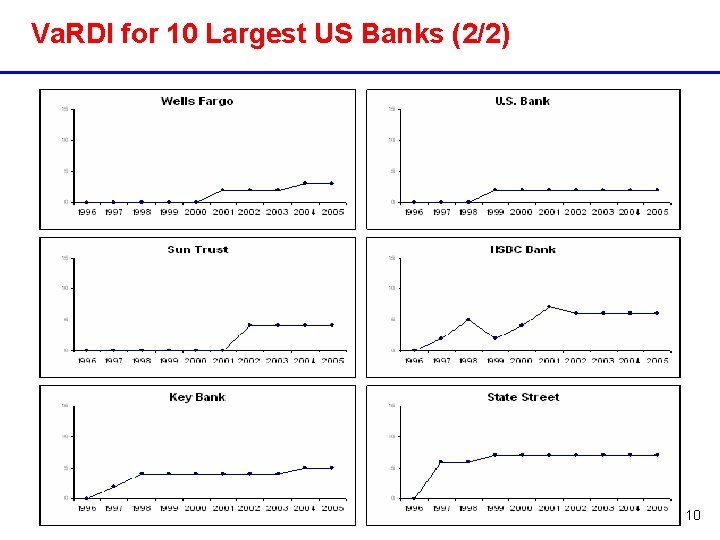
Va. RDI for 10 Largest US Banks (2/2) 10
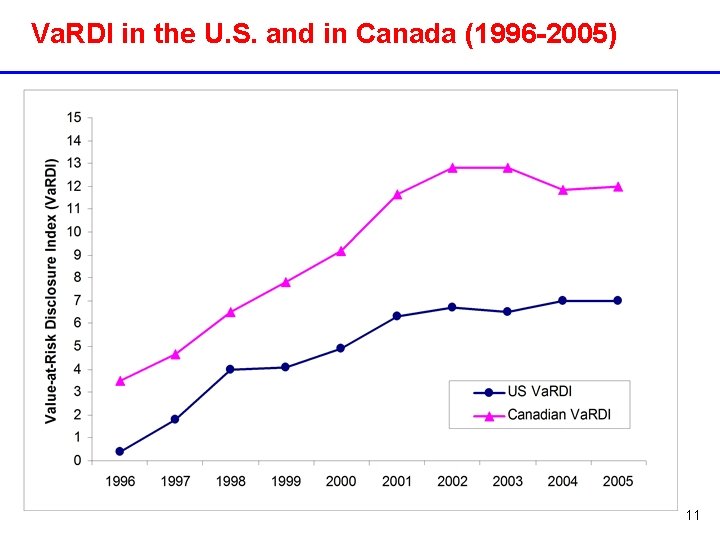
Va. RDI in the U. S. and in Canada (1996 -2005) 11
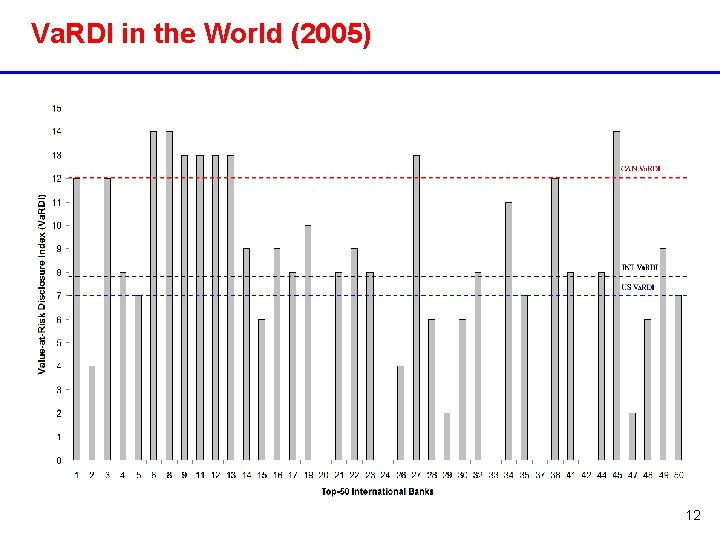
Va. RDI in the World (2005) 12
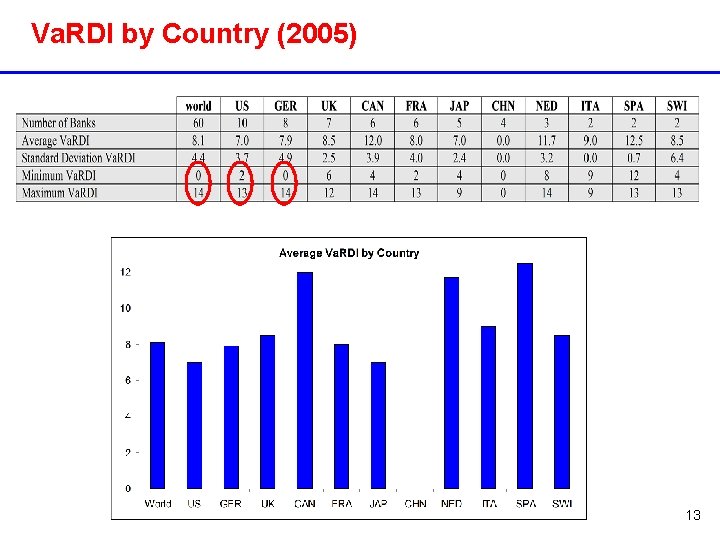
Va. RDI by Country (2005) 13
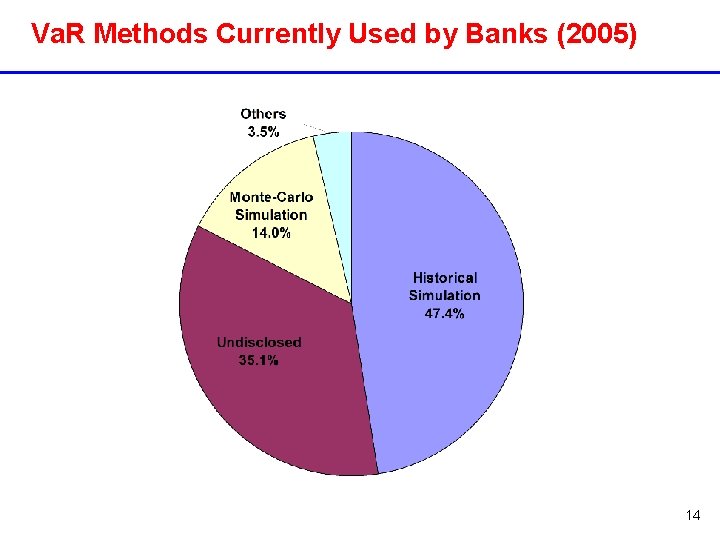
Va. R Methods Currently Used by Banks (2005) 14
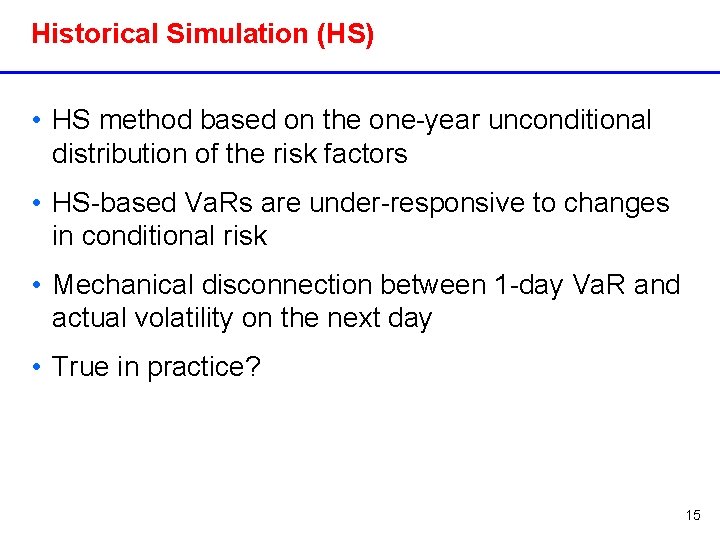
Historical Simulation (HS) • HS method based on the one-year unconditional distribution of the risk factors • HS-based Va. Rs are under-responsive to changes in conditional risk • Mechanical disconnection between 1 -day Va. R and actual volatility on the next day • True in practice? 15
Part 2: Quality of Va. R Disclosure • Backtesting • Forecast Trading Revenue Volatility 16
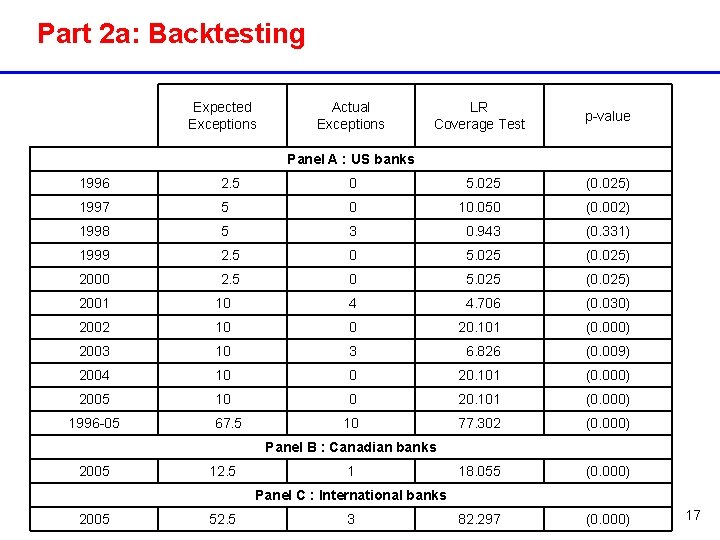
Part 2 a: Backtesting Expected Exceptions Actual Exceptions LR Coverage Test p-value Panel A : US banks 1996 2. 5 0 5. 025 (0. 025) 1997 5 0 10. 050 (0. 002) 1998 5 3 0. 943 (0. 331) 1999 2. 5 0 5. 025 (0. 025) 2000 2. 5 0 5. 025 (0. 025) 2001 10 4 4. 706 (0. 030) 2002 10 0 20. 101 (0. 000) 2003 10 3 6. 826 (0. 009) 2004 10 0 20. 101 (0. 000) 2005 10 0 20. 101 (0. 000) 10 77. 302 (0. 000) 18. 055 (0. 000) 82. 297 (0. 000) 1996 -05 67. 5 Panel B : Canadian banks 2005 12. 5 1 Panel C : International banks 2005 52. 5 3 17
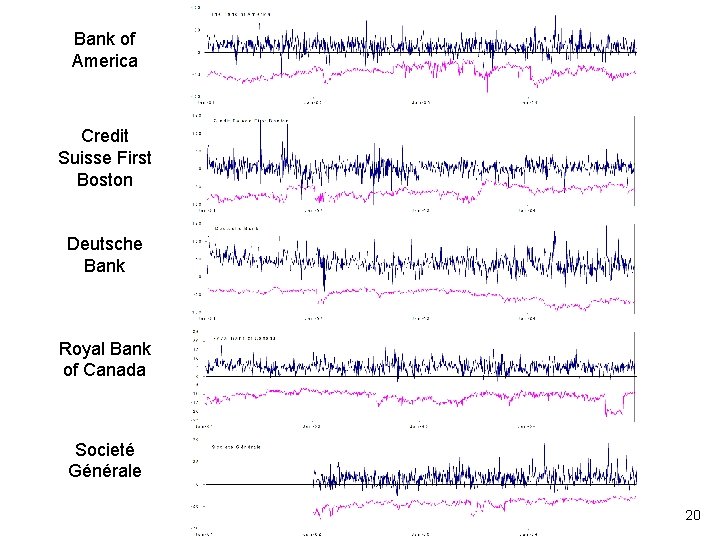
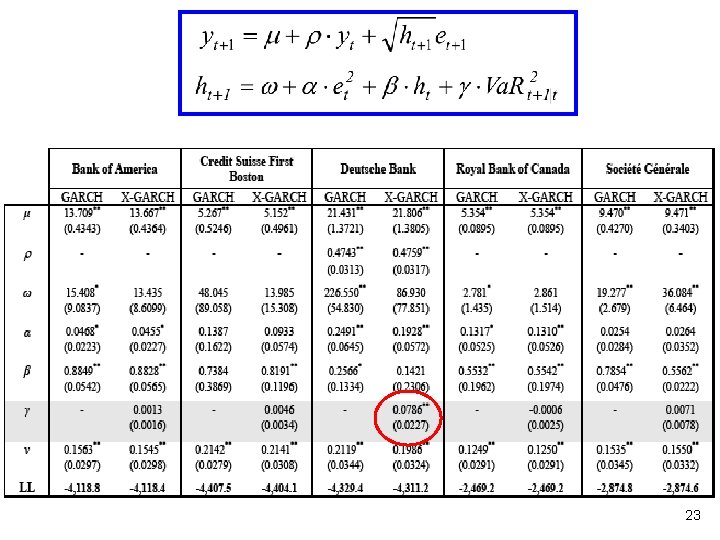
Part 2 b: Forecasting Trading Revenue Volatility • For each country included in our survey, we look for a bank disclosing a graph of daily Va. R and trading revenues over a long enough sample period – Bank of America (US) – Credit Suisse First Boston (Switzerland) – Deutsche Bank (Germany) – Royal Bank of Canada (Canada) – Société Générale (France) • All banks have Va. RDIs of at least 13 points • They all use Historical Simulation, except Deutsche Bank 18
Data Extraction • Actual Va. Rs and trading revenues are not available in a machine-readable format • We extract the data from the graphs included in annual reports using a Matlab-based technique – Convert PDF file into JPG – Import JPG file into Matlab – Add vertical lines on the image – Zoom in and click on each data point – Convert Matlab coordinates into graph coordinates • Many experiments and simulations are presented in the appendix 19
Bank of America Credit Suisse First Boston Deutsche Bank Royal Bank of Canada Societé Générale 20
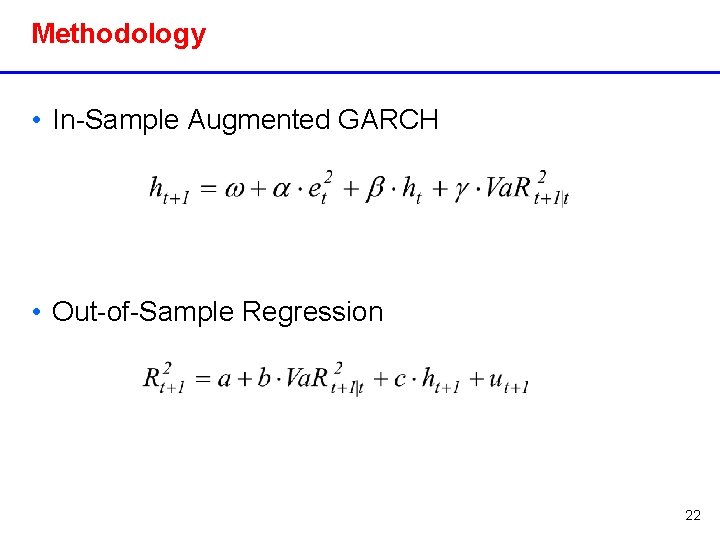
Measuring Va. R Accuracy • We look for a statistical link between Va. Rt+1|t and the volatility of the trading revenue Rt+1 • We use a simple GARCH model as a benchmark – “Unfair horse race”: risk manager knows the bank’s positions, unlike the econometrician 21
Methodology • In-Sample Augmented GARCH • Out-of-Sample Regression 22
23
Conclusion (Part I) • We use public information about Va. R disclosed by banks in their annual reports • Large differences in the level of disclosure among US commercial banks • Upward trend in the amount of information disclosed to the public • US Va. R disclosures are below average • Large differences in the level of disclosure across countries • Historical Simulation is the most popular Va. R method 24
Conclusion (Part II) • Unlike the level of disclosure, the quality of Va. R shows no sign of improvement over time • Disconnection between 1 -day Va. R and actual volatility on the next day • HS-based Va. R helps little in forecasting the volatility of future trading revenues • Its incremental forecasting ability over a simple GARCH model is very limited • Only exception: Deutsche Bank 25

The Level and Quality of Value-at-Risk Disclosure by Commercial Banks Christophe Pérignon, HEC Paris Daniel R. Smith, Simon Fraser University Risk Management in Financial Institutions 23 -25 April 2009 26
- Slides: 26