The Labour Market the Macro economy The MacroEconomics

The Labour Market & the Macro -economy The Macro-Economics of European Economies MSc in Economic Policy Studies John Fitz. Gerald, February 2015

Course Outline 1. How does an economy work? JF 16 -1 -2015 2. The genesis of macroeconomics AM 23 -1 -2015 3. Modern macroeconomics AM 30 -1 -2015 4. Banks and financial markets AM 6 -2 -2015 5. The recent crisis AM 13 -2 -2015 6. The labour market JF 20 -2 -2015 7. Fiscal Policy and forecasting JF 6 -3 -2015 8. Trade JF 13 -3 -2015 9. The economics of global warming JF 20 -3 -2015 10. The future of the Irish economy AM and JF 27 -3 -2015

Outline of Lecture • Theory • • • Demographic factors, exogenous in short run Labour Supply Labour Demand Wage Determination, Market Clearing and Unemployment Interaction with macro-economy • Applied - examples covering a range of EU economies • Human Capital and the labour market • Labour Market Disequilibria in EU economies

Demography and the Labour Market • Population • Nt=Nt-1 -Dt+Bt+Mt • Where: N=population; D=deaths; B=births; M=immigration • Education • Affects participation, migration, employability and productivity • Working age population • Participation rates • Affected by economic circumstances • Migration • Drivers of migration – economic differences and other factors

Demography and the economy

The Role of Education • Rising educational attainment – differs by country and by age • Affects productivity which, in turn: • Affects wage rates – in perfect competition labour paid the marginal product • Affects participation because higher wages v costs of working • Affects employability and numbers unemployed


 • Where: W=wage rate;")
Labour supply • L=f(W, N, M, UR, welfare, unions, T) • Where: W=wage rate; UR= unemployment rate; T= other factors, e. g. culture • Migration = f(UR, URw, W, Ww , T) • Where subscript w signifies the rest of the world • Sensitive to wage rates in Ireland – much less sensitive elsewhere • Female labour supply= f(demographics, education, W, costs, culture) • Fairly elastic – sensitive to wage rates • Male labour supply= f(demographics, education, W, costs, culture) • Fairly inelastic – what is inelastic? • Shape of labour supply curve? • How elastic – what is elastic?

Elastic Labour Supply Wage Rates W S 1 L W 1 DL L 2 L Employment

Inelastic Labour Supply S 1 L Wage Rates W W 1 DL L 2 L Employment

Totally Inelastic Labour Supply Wage Rates S 1 L W W 1 DL L 2 L Employment
 & unskilled (low")
Skilled v Unskilled • Two kinds of labour: skilled (high education) & unskilled (low education) • Are they substitutable? • Unskilled labour may be less employable • While the skilled labour market may clear the unskilled may not • Focus on: • Educational attainment of labour force • Returns to education • Migration – skilled or unskilled? Different effects
 • Where L=employment; Q=output; W= wage")
Labour Demand • L=f(Q, W, Pk, Pm, T) • Where L=employment; Q=output; W= wage rate; Pk=price of capital; Pm=price of materials and other inputs; T=technical progress • Firms choose the mix of inputs (labour etc. ) so as to minimise the cost of producing a given output Q • Q=f(Qw, c, cw, T) • Where c= unit cost of production; subscript w signifies the rest of the world • World output is located based on the cost of production in different countries • Hence wage rates affect employment through two channels 1. Substitution of capital and materials for labour and vice versa 2. Substitution of foreign for domestic output and vice versa • Shape of Labour demand curve? How elastic?

Market Clearing: Wage Rates • Market clearing? How can there be unemployment? • Speed of adjustment • Structural unemployment • Hysteresis • Bargaining • Philips curve • The tax wedge • Minimum wages • Efficiency wages

Speed of adjustment • Employers may be slow to adjust employment • Want to hold on to firm specific skills – e. g. Germany • Costs of hiring and firing • Labour laws – if hire may not be able to fire • Employees slow to adjust reservation wage • • Expectations Don’t have requisite skills Problems with nominal wage cuts v real wage cuts Market wage < welfare etc. • Result: market may remain out of equilibrium for a long time

Structural Unemployment • Where skills of the unemployed don’t match needs of employers • Where labour market laws may interfere with market clearing • Reasons for laws may mean that some unemployment is acceptable? • Hysteresis. A shock to the system shakes out labour that may not be re-employed in a recovery – e. g. because of skills mismatch • Move from a full employment equilibrium to an unemployment equilibrium • Policy Options? • Measures to increase demand? • Measures to reduce / transform supply?

Bargaining • One “model” of the labour market: • Employees bargain in terms of after tax wages • Employers take the wage and set employment • Bargaining power of employees may be affected by • Legislation • Unions • Insiders v Outsiders
 may be affected by")
Philips Curve • Wage rates (or the level of wages) may be affected by unemployment • With high unemployment employees anxious to hold jobs • More willing to take a pay cut or not to look for an increase • With high unemployment more competition for jobs • May result in wage rates lower than would otherwise be the case • With low unemployment labour is scarce and employers have to pay more • If unemployment affects wage inflation • At what level of unemployment is the effect on wage inflation zero? • If higher unemployment – then real wage rates will tend to fall, leading to higher employment and lower unemployment • Similarly if unemployment below this level wages will tend to rise affect unemployment • The non-accelerating wage rate of inflation (NAWRU) is the stable equilibrium • Explains why market clears at a significant rate of unemployment • What happens if infinite labour supply? No Philips curve
; Employees get W*(1 -tp)")
Wage Rates • The tax wedge: • Employers pay W*(1+te); Employees get W*(1 -tp) • Where te=employers taxes (rate) and tp=employees taxes (rate) • The higher the tax wedge the bigger the difference between the 2 wage rates • Who pays the taxes on labour – where is the incidence? • Depends on the shape of the labour supply and demand curves

Tax incidence: affected by labour supply & demand • Impose a tax on labour of W 1 -W 3. • Labour bargains in terms of after tax wages • Labour supply moves from S 1 to S 2 • Labour demand downward sloping • Employment falls from L 2 to L 1 • Wage rates rise from W 1 to W 2 – that share of the tax is paid by employer • The part of the tax W 2 -W 3 is paid by the employee • The flatter – more elastic – labour supply the bigger the share of the tax is paid by employers – increasing the employment effect • Partnership in Ireland 1987 – trade off tax cuts for wage moderation • This reflected the behaviour of the market with an elastic labour supply • Other countries – labour supply less elastic because limited migration

Elastic Labour Supply Wage Rates W S 1 L W 1 DL L 2 L Employment

Elastic Labour Supply Wage Rates S 2 L W S 1 L W 3 W 2 W 1 DL L 1 L 2 L Employment

Replacement Rate or Minimum Wage • Sets a floor on wage rates • Does it lead to unemployment? • Consider the distribution of wage rates • If there are many at the bottom of the distribution …. • If there are few at the bottom of the distribution …. • Social considerations: • Higher pay – welfare gain, less welfare payments; offset by lost employment? • Protection of the weak e. g. immigrants

Unskilled Labour Wage Rates W S 1 L DL S=W L 1 L 3 L 2 U L Employment

Efficiency Wage • Employers do not know the productivity of a new hire • Pay a premium to ensure that they get the best • High pay may affect morale and productivity of workers • Result: may pay more than market clearing wage rate

Labour Market and the Macro-Economy • Demand for goods and, hence, labour determined in goods market • Wage rate feeds back into prices, competitiveness etc. • Employment, unemployment and wage rates affects public finances • Tax revenue • Welfare payments • Cost of goods and services

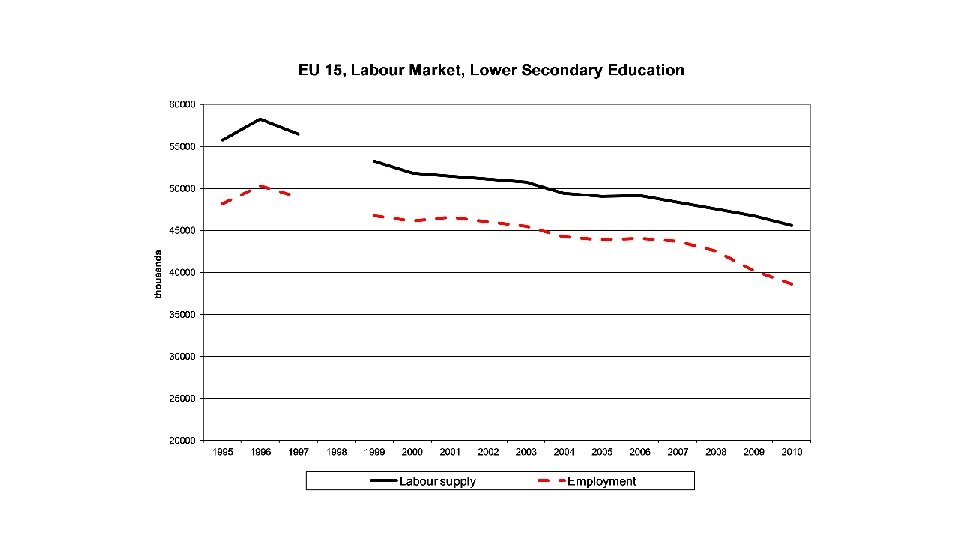
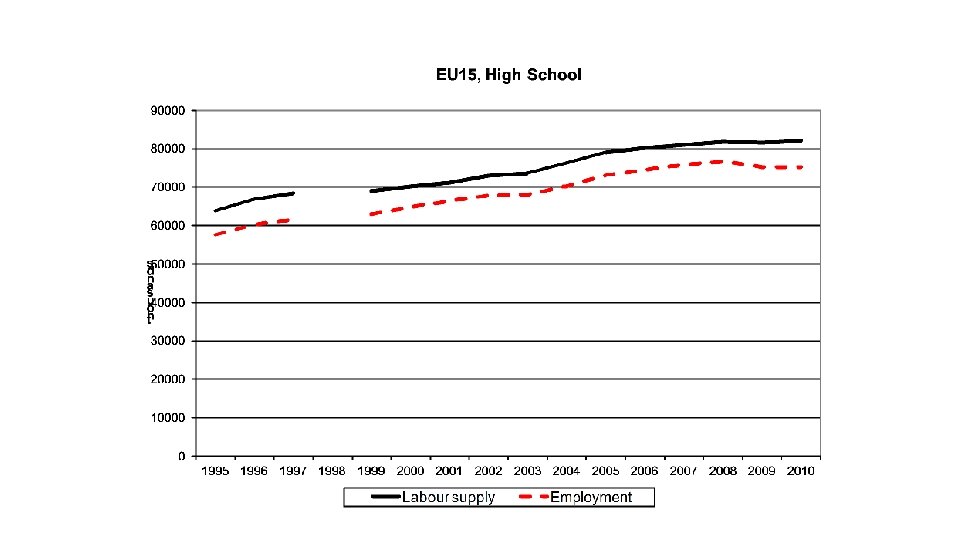
Examples • Education and skills • How does education affect labour supply? • Productivity, participation, employability • Examples of Labour market adjustments • Finland – Crisis 1990 • Germany – Unification 1990 and Labour market reforms 2004 • Ireland, Spain, Portugal – 25 years of labour market adjustment • Migration: example of Ireland • Labour market policies

Education – cohort of 1931 -5

Education – cohort of 1951 -5

Education – cohort of 1981 -5

Returns to education: lower secondary relative to upper secondary

Returns to education: tertiary relative to upper secondary Belgium Chile Denmark Estonia Germany Ireland Portugal Spain United Kingdom United States EU 21 average Men 2000/1 128 132 143 135 125 152 181 160 2011/2 129 271 138 137 171 169 173 136 151 182 165 Women 2000/1 133 124 141 161 143 176 169 153 2011/2 134 262 126 160 172 190 172 155 178 177 162


Investment in Human Capital, 2010


Examples of Labour Market Adjustment • Finland – Crisis 1990 • Germany – Unification 1990 and Labour market reforms 2004 • Ireland, Spain, Portugal – 25 years of labour market adjustment • Migration: example of Ireland

Finland – Unemployment Rate

Finland – Unemployment Rate by Education

Finnish wage rates relative to EU 15

Germany – Unemployment Rate

Germany – Unemployment Rate by Education

German wage rates relative to EU 15

Labour market adjustment: Ireland, Spain Portugal • Ireland – post 1980 s crisis slow to fall • Hysteresis post 1990 why? • Today? • Spain – pre-crisis – very high, though had been falling • Labour market rigidities? • Today? • Portugal – appears fairly flexible – till the crisis • Today?

Unemployment Rate

Ireland: unemployment rate by education

Spain: unemployment rate by education

Portugal: unemployment rate by education


Wage rates relative to EU 15

Migration • Driven by: • Potential earnings differentials • Employment opportunities • Cultural factors • Differences between labour markets – inflows and outflows • Impact of migration on: • Receiving labour markets • Origin labour markets

Ireland v UK, Wage Rates

Ireland: Net emigration, % of population

Unemployment: Implications for Policy? • Largely a national responsibility • However a European fiscal policy would have helped in the crisis • How to make European labour markets work • Europe v US • Supply side measures • Education and training • Activation etc. • Demand side measures • Costs of employment • Flexibility

AMECO Database • Many annual variables for EU economies, US, Japan etc. • Don’t assume that the data are always right! • Where available, runs from 1960. Includes EU forecasts to 2016 • Be careful that 2014 onwards are EU forecasts! • Two approaches to accessing it: 1. Online: http: //ec. europa. eu/economy_finance/ameco/user/serie/Select. Serie. cfm 2. Excel File: AMECOTCD. xlsx – a limited number of variables, 1 variable per sheet • House prices from BIS datatbase: • Online: http: //www. bis. org/statistics/pp_detailed. htm#selected

Other Data Used in this Lecture • Eurostat Labour Force Survey • OECD Economic Outlook • CSO

Presentations 1. The origins and resolution of the current crisis in Estonia, Bulgaria, and Greece (20 th February) • What were the origins? How is it resolving? Look at disequilibria in markets 2. The origins and resolution of the current crisis in Latvia, Portugal, and Italy (20 th February) • What were the origins? How is it resolving? Look at disequilibria in markets 3. The crisis in Scandinavia (Finland, Sweden, Denmark) 1988 -1995 (6 th March) • What were the origins? How was it resolved? Look at disequilibria in markets

Reading for this lecture • Basic text: • Blanchard etc. Probably more theory than you need, but provides the basics • Chapters 7 and 9 • The rest of the reading discusses real economic situations. • The objective is to evaluate whether labour markets are out of equilibrium and if so why? How are they adjusting or how have they adjusted? What are the problems? • In addition to previous reading • http: //www. oecd. org/g 20/topics/employment-and-social-policy/G 20 -labour-markets-outlook-key-challenges-andpolicy-responses. pdf • On Spain http: //www. oecd. org/els/emp/Spain. Labour. Market. Reform-Report. pdf • On labour market reforms http: //www. oecd. org/site/sgemrh/46190166. pdf

Reading for this lecture • As mentioned previously: • Fitz. Gerald, J. , 2013 “Financial crisis, economic adjustment and a return to growth in the EU”, Revue de l’OFCE Debates and policies, No. 127 pp. 277 -302 http: //www. ofce. sciences-po. fr/pdf/revue/127/revue-127. pdf Look at one or two of these publications for the EU and its component economies • IMF World Economic Outlook, October 2014. http: //www. imf. org/external/pubs/ft/weo/2014/02/pdf/text. pdf • OECD Economic Outlook, November 2014, http: //www. oecd. org/eco/outlook/General-assessment-of-themacroeconomic-situation. pdf • National Institute Economic Review, November 2014, http: //ner. sagepub. com/content/230/1. toc • European Commission: European Economic Forecast, Winter 2014 http: //ec. europa. eu/economy_finance/publications/european_economy/2014/pdf/ee 2_en. pdf • See http: //www. oecd. org/eco/surveys/ for surveys of individual countries. They don’t do Bulgaria and Latvia
- Slides: 64