The Kerala Floods Was it Climate Change K


 from calibrated VIC model for 1980")
 Groundwater recharge (%) due to monsoon season rainfall, (B) groundwater recharge due to")

 Mean % of Heavy rainfall days Mean %")


 Modeling: Backbone for Forecasting and Warning Services Models in Ensemble")

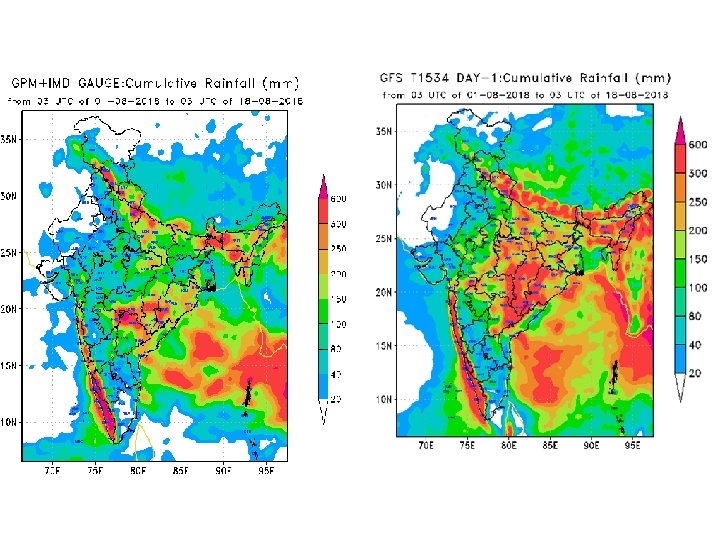
 Forecast & IMD observed Rainfall Analysis at 03 UTC 15 -08")


- Slides: 28
The Kerala Floods: Was it Climate Change K. J. Ramesh INDIA METEOROLOGICAL DEPARTMENT NEW DELHI-110003 kj. ramesh@nic. in
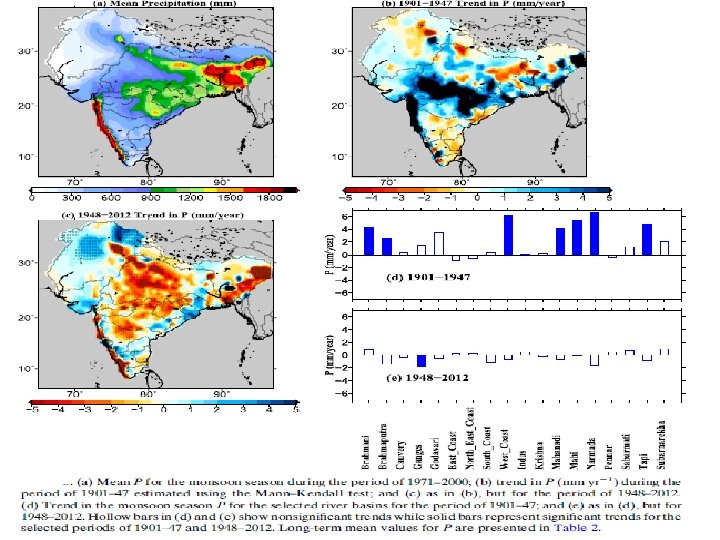
Strong Linkage Between Precipitation Intensity and Monsoon Season Groundwater Recharge in India, Volume: 45, Issue: 11, Pages: 5536 -5544, First published: 31 May 2018, DOI: (10. 1029/2018 GL 078466) Observed changes in precipitation characteristics over India (1951– 2015). (a) Observed changes (mm) in PPTTotal, (b) PPTLow, and (c) PPTHigh. (d and e) Area averaged changes in PPTLow for northwest India, NWI and north central India, NCI, and (f) area averaged changes in PPTHigh in SI. All changes were estimated using the nonparametric trend test and Sen's slope method for the period of 1951– 2016. Statistical significance was tested at 5% significance level and p value (in d–f) less than 0. 05 indicates trends were significant.
Water budget components (Precipitation, ET, and Total Runoff) from calibrated VIC model for 1980 -2012 period for the monsoon season and annual time periods Strong linkage between precipitation intensity and monsoon season groundwater recharge in India
(A) Groundwater recharge (%) due to monsoon season rainfall, (B) groundwater recharge due to other sources (canals, surface water bodies, irrigation return flow) (C) state wise distribution of recharge during the monsoon season from rainfall and other sources, (D) state wise distribution of annual groundwater recharge due to different sources. Data were obtained from CGWB.
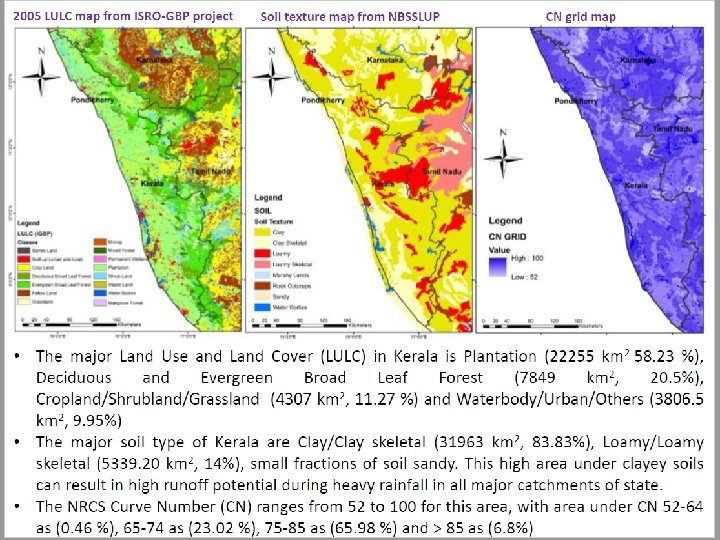
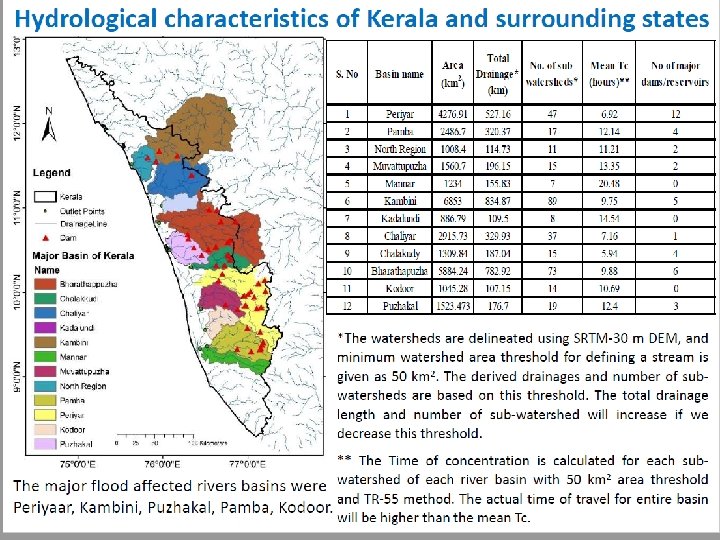
The elevation ranges from -48 m below sea level to +2692 m above mean sea level, with 35 % area between 0 -50 m, 39. 82 % are between 50 -500 m and 24 % of area above 500 m
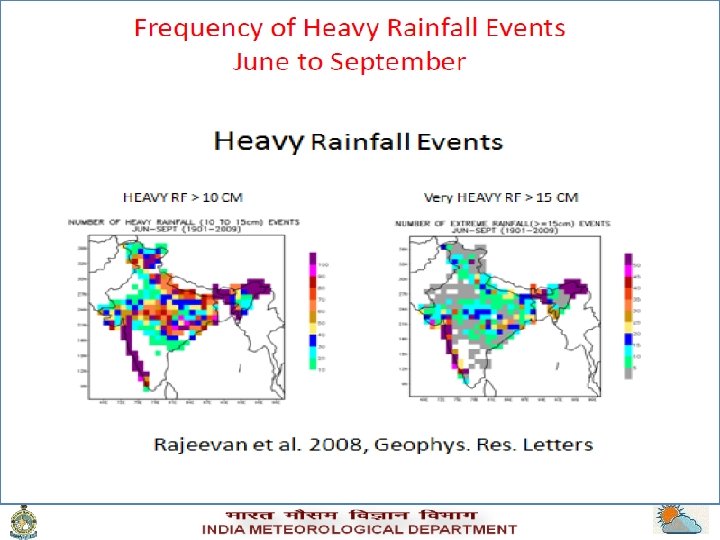
Indian Southwest Monsoon (June to September) Mean % of Heavy rainfall days Mean % of Very heavy rainfall days 8
Disaster and Climate Risk
Multi-Hazard Vulnerability
Extreme Weather associated with South Asian weather systems Western Disturbance ML: Monsoon low MTC: Mid-tropospheric cyclone C: Cyclone TS: Thunderstorm OV: Onset Vortex TS TS MTC C Off-shore vortices Fog TS TS TS ML C OV Easterly wave
Numerical Weather Prediction (NWP) Modeling: Backbone for Forecasting and Warning Services Models in Ensemble 2018 Prediction Systems GEFS (12 km), Global Models UMEPS(9 Km) GFS(T 1534), Regional Models Unified Model WRF, HWRF Nowcasting Tools (WDSSII, ARPS Model) 120 h 96 h 72 h 48 h 24 h 00 h 24 h Multi-model ensemble (Extended Range), Single Model Ensemble, Grand Global Ensemble Global models Regional models Nowcasting Warnings Activities v. By 2020: 1 -3 km Regional multi-model prediction system, ocean-atmosphere-land surface coupled severe weather pred. systems, Parametric models and Expert systems – severe weather Warning up to 57 days, Forecast outlook up to 10 -15 days.
All India southwest Monsoon 2018 heavy rainfall warning skill (24, 48, 72, 96 & 120 hours) WARNING (TAKE ACTION) ALERT (BE PREPARED) WATCH (BE UPDATED) NO WARNING (NO ACTION) • Lead period of severe weather warning increased from 3 days to 5 days • Colour coded meteorological subdivision and district level impact based warning issued across India
WRF (3 km) Forecast & IMD observed Rainfall Analysis at 03 UTC 15 -08 -2018
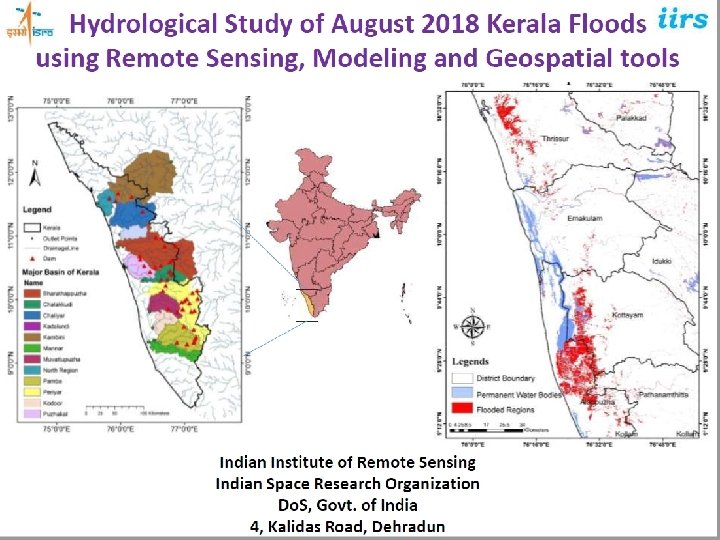
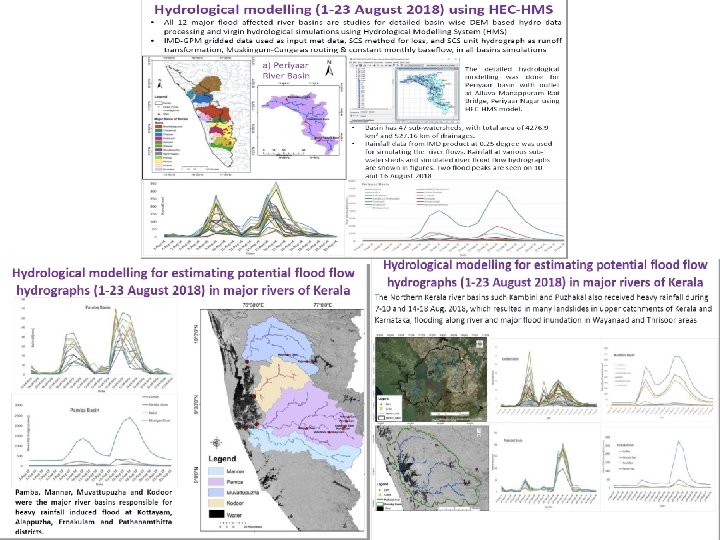
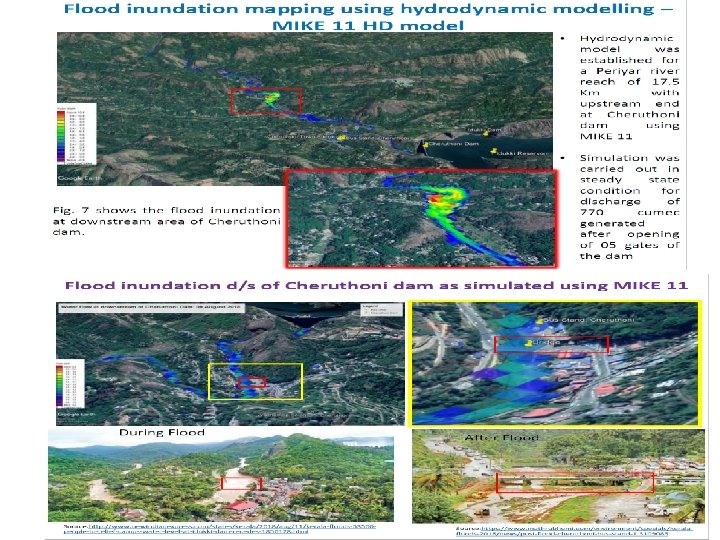
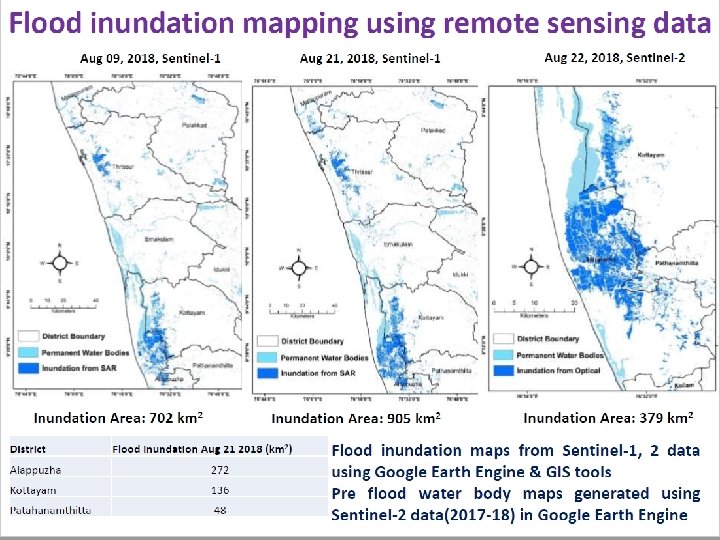
Rainfall over Kerala and associated large scale flooding Rainfall over Kerala so far during southwest monsoon season 2018 (1 st June to 20 th August 2018) has been exceptionally high. • Kerala received 2377. 1 mm against a normal of 1676. 3 mm (above normal by 42%). • The rainfall over Kerala has been in general above normal throughout the season. The rainfall over Kerala during June, July and August (1 -20 August) has been 15%, 18% and 156% above normal respectively. • The exceptionally high rainfall in August, 2018 so far has been due to two consecutive active spells, viz. , 8 th – 10 th August and then during 14 th – 17 th August. Water level Storage Scenario in reservoirs • Under this rainfall scenario, by the end of July, 2018, in all the major 35 odd reservoirs in Kerala, the storage was close to the Full Reservoir Level (FRL) and had no buffer storage to accommodate the heavy inflows from 8 th August (source: Kerala State Electricity Board website, http: //sldckerala. com/index. php? id=7). • The continued exceptionally heavy rainfall in August in the catchment areas had compelled the authorities to resort to heavy releases downstream into the rivers leading to widespread flooding. • Taking an example of the largest reservoir of Kerala, according to State Load Despatch Centre (SLDC) of Kerala State Electricity Board website, the first water release from the largest Reservoir in Idukki was done on 10 th August. • The water release continued thereafter with about 50 -70 mcm per day till 14 th August. However it peaked up on 15 th August to 390. 5 mcm per day followed by 126 and 115 MCM per day on 16 th and 17 th August leading to devastating flood in downstream areas of the dam. •
It may be mentioned that the highest excess rainfall during the season has been recorded over Idukki District (93% above normal) during the season (1 June-19 August). During the week ending 15 th, 8 th, 1 st Aug. , 25 th and 18 th July Idukki district recorded continuously excess rainfall (70%, 41%, 45%, 49% and 46% above normal respectively). Heavy rainfall Warning by IMD • The Meteorological Centre, Thiruvananthapuram issued the heavy rainfall warnings at district level at least 2 to 3 days in advance of their occurrence on day to day basis. The warnings were issued to Chief Secretary, Addl. Chief Secretary (Revenue & Disaster Management), State Disaster Management Authority, State Emergency Operations Centre, District Collectors, Navy, Special Marine enforcement, press and electronic media. Expansion of IMD, Thiruvananthapuram Activities • Following the OCKHI cyclone impact, IMD has set up a Cyclone Warning Centre(CWC) at Thiruvananthapuram office that can fully take care of the special needs of the state, the neighbouring state of Karnataka and Islands of Lakshadweep. • Already, IMD, Thiruvananthapuram is working on improving the forecast customization and dissemination facilities. Apart from building cyclone warning services at Thiruvananthapuram, IMD will organize awareness and training workshop for the disaster management authorities and other stakeholders of Kerala. •
Future Plans for Coastal Areas • Building multi-scale & multi-sensor networks for Long-term measurements of various environmental/terrestrial/marine/bio-geochemical/GHGs variables at large/regional/local/eco-system scales to capture vital signatures of the earth system response to climate variability and change • Comprehensive multi-institutional Program for Changing Water Cycle; thermal expansion of Bay of Bengal and Arabian Sea; Sea Level Changes & coastal zone impacts; Engineering and Technical Solutions for Structural Safety of Coastal Investments • Build Earth System Model (ESM) to treat comprehensively the coupling of various subsystems (ocean-atmosphere; land-atmosphere; cryosphere-atmosphere; biogeo-chemical cycles over ocean and land; aerosols-GHGs-clouds-precipitation etc. ) to improve our predictions of weather, climate, hazards, air quality and Environment • Expanding services in support of four key climate-sensitive sectors, including agriculture, water, health, Energy and climate and disaster risk management for rendering customized services for societal, environmental or economic benefits • Accelerating initiatives related to Capacity Building – for regular induction of skilled and specialized manpower
Thank you