The Keller Pointe The Keller Pointe History n


- Slides: 26
The Keller Pointe
The Keller Pointe History n 1999 citywide survey indicated the number one and two needs were a recreation center and a pool. n Council determined a recreation center was needed with one very important goal – To develop a recreation center as an enterprise that would be self-supporting.
The Keller Pointe History n 10 member citizen task force worked with consultant to develop an enterprise plan. n n n Telephone Surveys – 91% support for a recreation center Interviews with Stakeholders Open Forums Evaluation of Potential User Groups Area Provider Analysis Opinion of Probable Revenue, Expenses & Cash Flow n April 9, 2002 - Unanimously accepted by Enterprise Plan Steering Committee, the Parks and Recreation Board and Keller Development Corporation n April 16, 2002 – City Council unanimously approved the Enterprise Plan
Mission and Vision Statements Mission: The Keller Pointe exceeds community expectations and achieves fiscal success by providing unprecedented service and award winning programs. Vision: To be recognized in the recreation industry as a fiscal and operational leader with a first class facility achieving continuous growth.
Enterprise Plan Market Analysis Year 1 Year 2 Year 3 Year 4 Year 5
Enterprise Plan Projected Attendance n With estimated penetration rates, the Enterprise Plan predicted a total annual attendance of 263, 370 by the fifth year of operation. n Attendance at 2009 Fiscal Year End was 279, 289
Annual Attendance
2008 & 2009 Membership Sales Comparison 3, 716 / 3, 362 Memberships 72 / 71 % Residents 28 / 29 % Non-Residents $1, 902, 252. 80 / $1, 860, 624. 01 Membership Revenues
Summer Savings Special Comparison 1, 249 / 1, 207 Memberships
Attrition at The Keller Pointe FY 08/09 Reasons for Membership Withdrawal 4, 0% 14, 2%2% 31, 4% 42, 5% Personal reasons Delinquent 47, 6% 265, 33% Not using facility Moved 122, 15% Seasonal member Financial 265 - 33% 134 - 17% 132 - 16% 122 - 15% 47 - 6% 42 - 5% Joined another facility 31 - 4% 132, 16% 134, 17% Family obligations Medical Unhappy with facility 14 - 2% 4 - 0%
Enterprise Plan Opinion of Probable Revenue n Enterprise Plan Projected Total Admission Fees (Daily Passes & Annual Memberships) n 65% residents n 31% non-residents n 4% free (under 3 years of age) n 2009 Fiscal Year End (Annual Memberships Only) n 71% residents n 29% non-residents
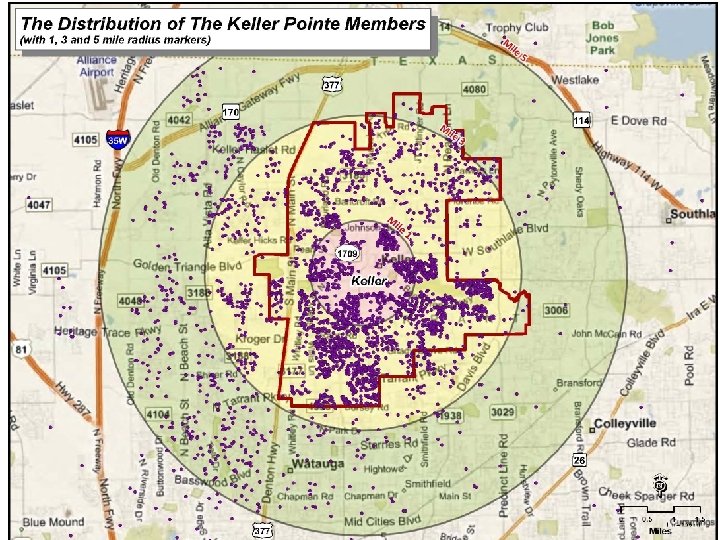
Distribution of Keller Pointe Membership
Program Comparison of 2008 versus 2009 1, 781 / 2, 830 No. of Program Units 48, 830 / 56, 832 Participants $715, 98. 97 / $701, 032. 71 Program Revenues
Challenges This Year Decreased Aquatic Program Participation and Revenue $129, 701. 76 / $112, 319. 69 Aquatic Revenue 1, 904 / 1, 327 Participants
“Wins” this Year Personal Training $112, 302 / $125, 254. 89 Revenue 2, 052 / 1, 993 Hours of Training *Group training accounts for lower hours, but increased revenue
“Wins” This Year Recreation Program Comparisons for 2008 to 2009 2, 879 / 2, 848 Number of Participants $206, 068. 54 / $222, 639. 78 Revenues
“Wins” This Year Capital Projects – § § Treadmills/Ellipticals - $74, 050 Virginia Graham Baker Act Drains $23, 763 (not budgeted)
Summary of Revenues & Expenses Revenues Expenses $3, 052, 100 / *$2, 996, 723. 22 Revenues $ 2, 917, 773 / *$2, 945, 670. 76 Expenditures *Projected Numbers - Unaudited
Cost Savings this year n n Did not hire three full time positions when they became vacant Closed the outdoor pool and concessions at 7: 00 pm instead of 8: 00 pm Closed ticket booth during weekday hours – operated weekend only Adjusted the service desk and kiosk schedules Total cost savings from these initiatives – approximately $60, 000
Additional Revenue Generating Opportunities Extended the Summer Savings Special to Members Only – 177 Memberships Sold n Big Fall Sale – 169 Memberships Sold n
Other Community Opportunities In The Area Gyms: Massage: n Womack’s Personal n Massage Envy Training Gym n Advanced Therapeutic Massage n L. A. Fitness n 24 Hour Fitness n Massage Heights n Fitness Together Keller n Keller Massage Therapy n Snap Fitness 24/7 n Fitness 2000 n Pro. Fit Personal Training n All American Family Fitness n Northpark YMCA
Net Revenues Without Capital Projects Net Revenue comparison of 2008 and 2009 Without Capital Projects $311, 327. 20 / *$148, 865. 50 Net Revenue *Projected Numbers - Unaudited
Net Revenues Net Revenue comparison of 2008 and 2009 $134, 327. 20 / *$51, 052. 50 Net Revenue *Projected Numbers - Unaudited
Fund Balance Need to build our fund balance n Building is 6 years old – Operational issues arise and capital repair is mandatory n Other facilities are growing around us n Expansions Ø Ø Ø Outdoor splash ground Outdoor playground for Stay & Play Building Addition
Fiscal Year 2010 Budget This year’s budget is tight. n n n Economy is challenging Do not feel we will do $1. 9 Million in Membership. More like $1. 7 Million More community opportunities in the area