The Infant Mortality Rate IMR is the annual
 is the annual number of deaths of infants under")


- Slides: 30
The Infant Mortality Rate (IMR) is the annual number of deaths of infants under 1 year compared with total live births.
Life Expectancy measures the average number of years a newborn can expect to live at current morbidity levels.
Section 3: Why is population increasing at different rates in different places?
What allowed the population to grow so quickly from 1750 C. E. – 2000 C. E. ?
What is the doubling rate?
“The doubling rate is the amount of time it takes to double a population. ”
Timeline of Population Growth 1750 C. E. • The Industrial Revolution • Doubling Rate decreases because of technology. Start of Human History • Natural Increase close to 0 1950 s C. E. • Doubling Rate begins to decrease. 8, 000 B. C. E. 1850 C. E. • The Neolithic (Agricultural) Revolution • Doubling Rate decreases because of food. • The Medical Revolution • Doubling Rate decreases because less developed countries begin to get medicines.
What are some reasons that the doubling rate began to decrease in the 1950 s?
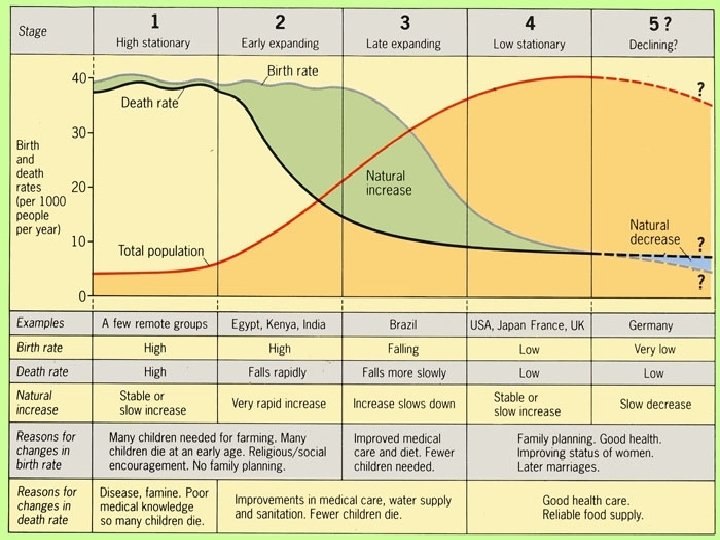
What is the demographic transition model?
“The Demographic Transition Model explains the transition from high birth and death rates to low birth and death rates as a country develops from a pre-industrial to an post-industrial economic system.
Stage 1: Low Population Growth Stage 2: High Population Growth Stage 3: Moderate Population Growth Stage 4: Low Population Growth Stage 5: Declining Population Growth
What is a population pyramid?
“A population pyramid is a graphical illustration that shows the distribution of various age groups as well as the sex ratio, the number of males per hundred females and the dependency ratio, the number of people who are too old or too young to work.
What are some population characteristics of Sudan’s population? What does this tell you about the country?
Stage 1: Low Growth 1. People depended on hunting and gathering for food. 2. Most of human history spent during this stage. 3. The NIR is essentially zero. 4. There is no country still in stage 1.
Stage 2: High Growth 1. Brought about by the Industrial Revolution. 2. CDR Plummets while the CBR remains the same as in stage 1. 3. Allowed to spread to LDRs by the medical revolution (20 th century)
Stage 3: Moderate Growth 1. 2. 3. Brought about by cultural changes. Characterized by a sudden drop in the CBR. There is still growth but not as fast as in Stage 2
Stage 4: Declining Growth 1. The CBR = CDR 2. Brought about by an aging population, education, and family planning 3. Zero Population Growth 4. Low TFR
Stage 5: Negative Growth 1. CDR > CBR because of an aging population. 2. NIR is less than Zero. 3. Much of Europe is entering this stage.
The following 5 slides are population pyramids of different areas on earth. Determine what stage they are in by how they look.
The United States of America
Bolivia
The Russian Federation
Australia
Central America
Economic Development Public Policy Education What affects population growth? Cultural Traditions Gender Empowerment Healthcare
What is the Epidemiologic Transition Model?
“The Epidemiologic Transition Model focuses on distinctive causes of death in each stage of the demographic transition. ”
Stage 1 • The stage of Pestilence and Famine • Example: The Black Death Stage 2 • The stage of receding Pandemics • Example: Cholera Stage 3 • The stage of degenerative and human-created diseases • Examples: Cancer and Cardiovascular Disease Stage 4 • The stage of delayed degenerative diseases • Example: Cancer and disease is slowed or stopped by medical advances. Stage 5 (Possible) • Reemergence of infectious and parasitic diseases. • Reasons: Evolution, Poverty, Improved Travel