
The Indian Ferro Alloys Industry Partnering with the

- Slides: 25
The Indian Ferro Alloys Industry Partnering with the Steel Industry in its growth …. 8 th June 2017 Kolkata T V Srinivas Shenoy Chief of Marketing and Sales Ferro Alloys and Minerals SBU Tata Steel Limited - India 1
Disclaimer : The presentation is an amalgamation of author’s own views and thoughts. Tata Steel does not necessarily subscribe to the views and thoughts expressed in the presentation and should not be held responsible for the same. 2
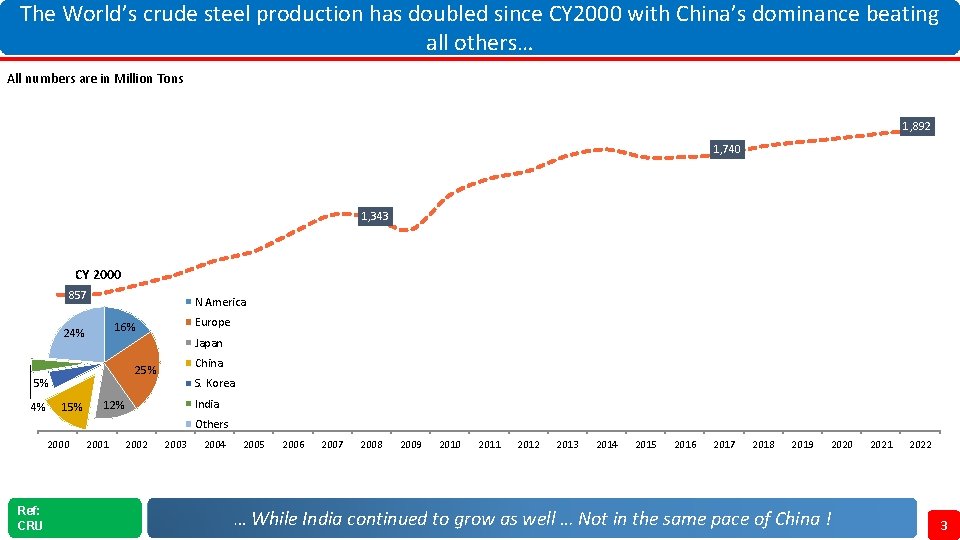
The World’s crude steel production has doubled since CY 2000 with China’s dominance beating all others… All numbers are in Million Tons 1, 892 1, 740 1, 343 CY 2000 857 N America Japan China 25% 5% 4% Europe 16% 24% 15% S. Korea India 12% Others 2000 Ref: CRU 2001 2002 2003 2004 2005 2006 2007 2008 2009 2010 2011 2012 2013 2014 2015 2016 2017 2018 2019 2020 … While India continued to grow as well … Not in the same pace of China ! 2021 2022 3
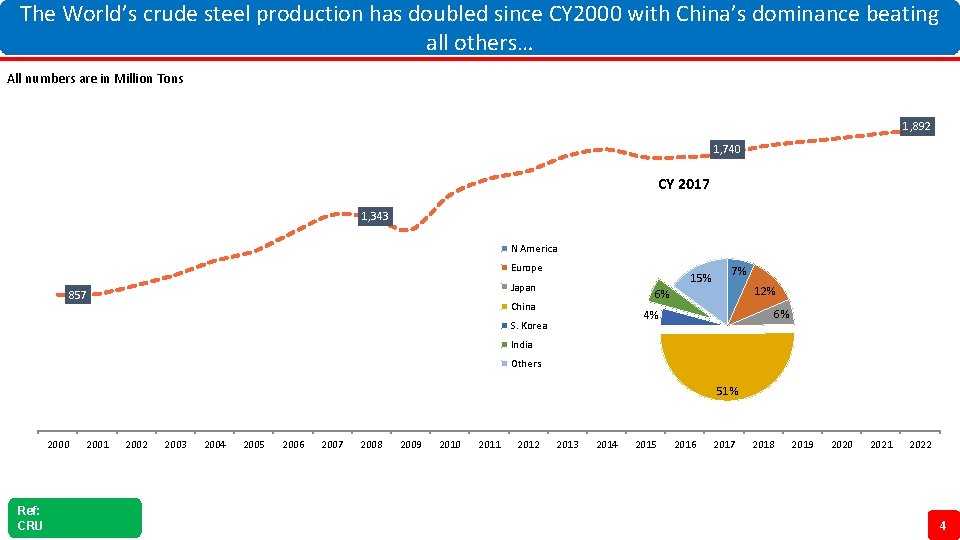
The World’s crude steel production has doubled since CY 2000 with China’s dominance beating all others… All numbers are in Million Tons 1, 892 1, 740 CY 2017 1, 343 N America Europe 15% Japan 857 7% 12% 6% China 6% 4% S. Korea India Others 51% 2000 Ref: CRU 2001 2002 2003 2004 2005 2006 2007 2008 2009 2010 2011 2012 2013 2014 2015 2016 2017 2018 2019 2020 2021 2022 4
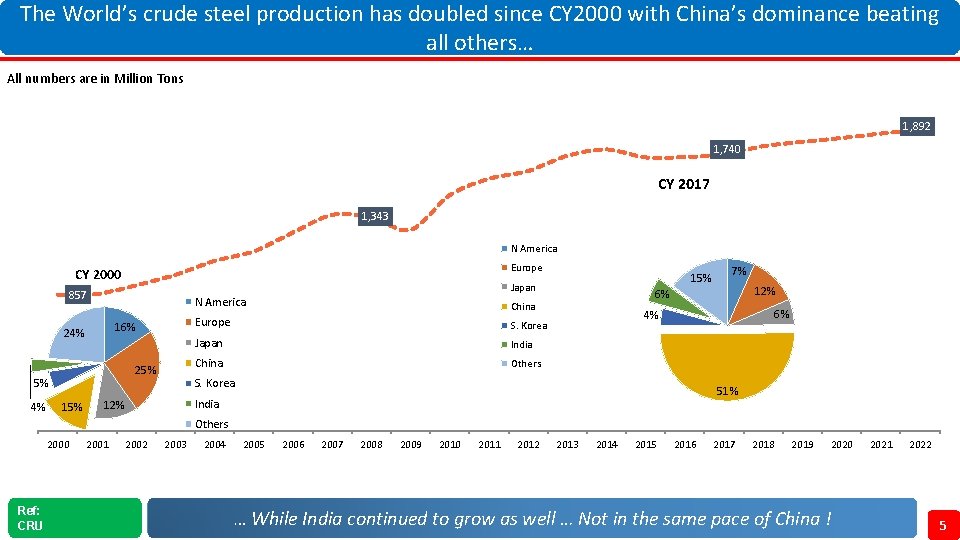
The World’s crude steel production has doubled since CY 2000 with China’s dominance beating all others… All numbers are in Million Tons 1, 892 1, 740 CY 2017 1, 343 N America Europe CY 2000 Japan 857 16% 24% 25% 5% 4% 15% N America China Europe S. Korea Japan India China Others 12% 6% 6% 4% S. Korea 51% India 12% 7% Others 2000 Ref: CRU 2001 2002 2003 2004 2005 2006 2007 2008 2009 2010 2011 2012 2013 2014 2015 2016 2017 2018 2019 2020 … While India continued to grow as well … Not in the same pace of China ! 2021 2022 5
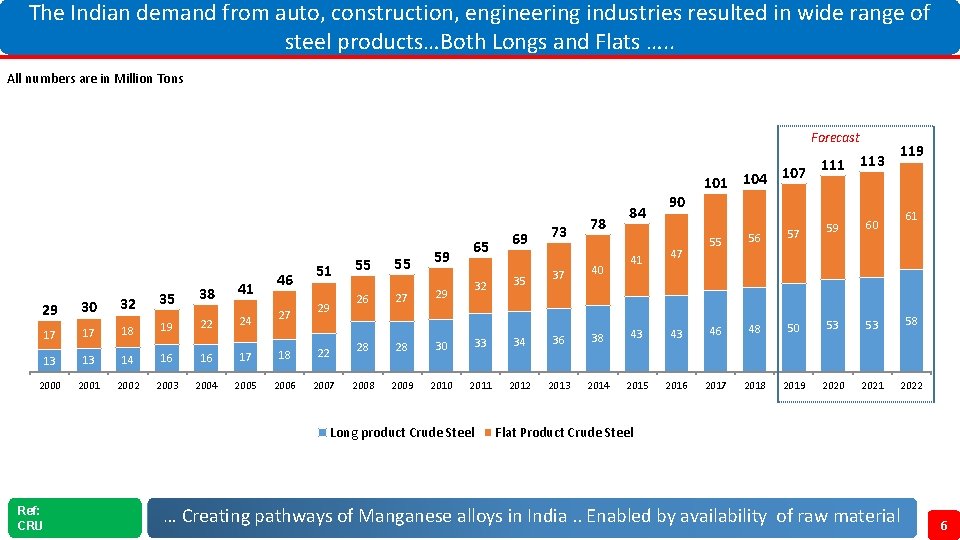
The Indian demand from auto, construction, engineering industries resulted in wide range of steel products…Both Longs and Flats …. . All numbers are in Million Tons Forecast 107 101 104 41 46 51 29 30 32 35 38 17 17 18 19 22 13 13 14 16 16 17 18 22 2000 2001 2002 2003 2004 2005 2006 2007 24 27 29 55 55 26 27 59 65 32 29 35 73 37 40 119 90 55 56 57 59 60 61 41 47 43 46 48 50 53 53 58 2016 2017 2018 2019 2020 2021 2022 28 28 30 33 34 36 38 43 2008 2009 2010 2011 2012 2013 2014 2015 Long product Crude Steel Ref: CRU 69 78 84 111 113 Flat Product Crude Steel … Creating pathways of Manganese alloys in India. . Enabled by availability of raw material 6
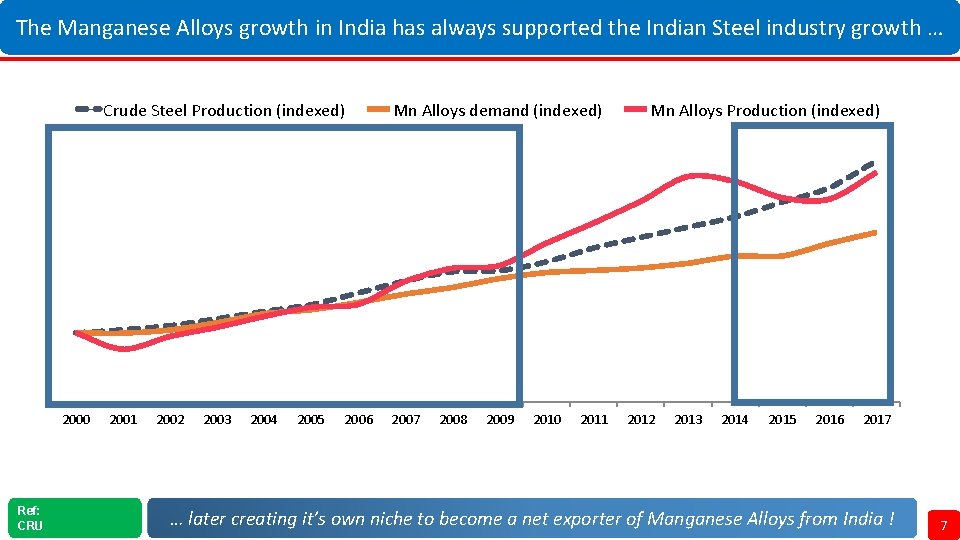
The Manganese Alloys growth in India has always supported the Indian Steel industry growth … Crude Steel Production (indexed) 2000 Ref: CRU 2001 2002 2003 2004 2005 2006 Mn Alloys demand (indexed) 2007 2008 2009 2010 2011 Mn Alloys Production (indexed) 2012 2013 2014 2015 2016 2017 … later creating it’s own niche to become a net exporter of Manganese Alloys from India ! 7
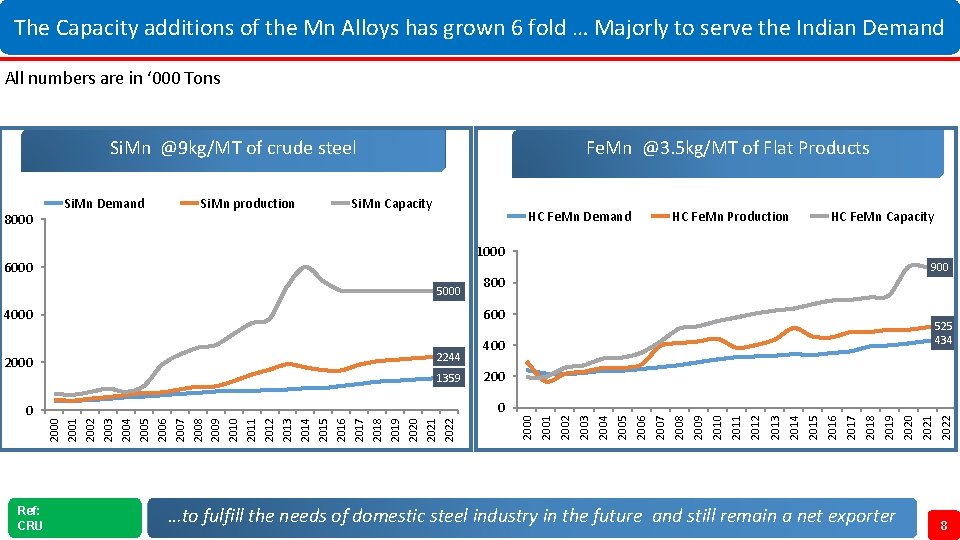
The Capacity additions of the Mn Alloys has grown 6 fold … Majorly to serve the Indian Demand All numbers are in ‘ 000 Tons Si. Mn @9 kg/MT of crude steel Si. Mn Capacity HC Fe. Mn Demand 5000 Ref: CRU 900 800 600 …to fulfill the needs of domestic steel industry in the future and still remain a net exporter 2021 2020 2019 2018 2017 2016 2015 2014 2013 2012 2011 2010 2009 2008 2007 2006 2005 2000 2001 2002 2003 2004 2005 2006 2007 2008 2009 2010 2011 2012 2013 2014 2015 2016 2017 2018 2019 2020 2021 2022 0 2004 2003 1359 400 2002 2244 525 434 2001 4000 0 HC Fe. Mn Capacity 1000 6000 2000 HC Fe. Mn Production 2022 Si. Mn production 2000 8000 Si. Mn Demand Fe. Mn @3. 5 kg/MT of Flat Products 8
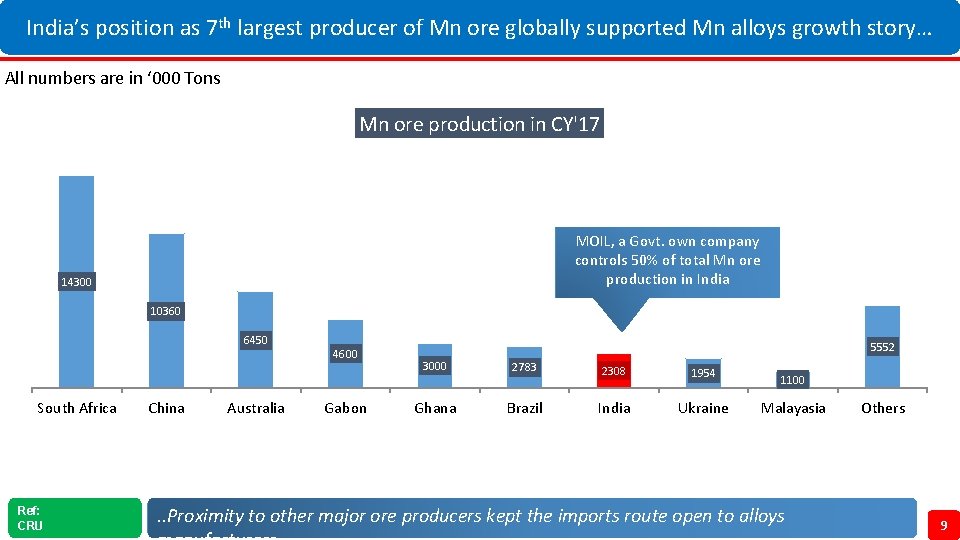
India’s position as 7 th largest producer of Mn ore globally supported Mn alloys growth story… All numbers are in ‘ 000 Tons Mn ore production in CY'17 MOIL, a Govt. own company controls 50% of total Mn ore production in India 14300 10360 6450 South Africa Ref: CRU China Australia 4600 Gabon 5552 3000 2783 2308 1954 Ghana Brazil India Ukraine 1100 Malayasia . . Proximity to other major ore producers kept the imports route open to alloys Others 9
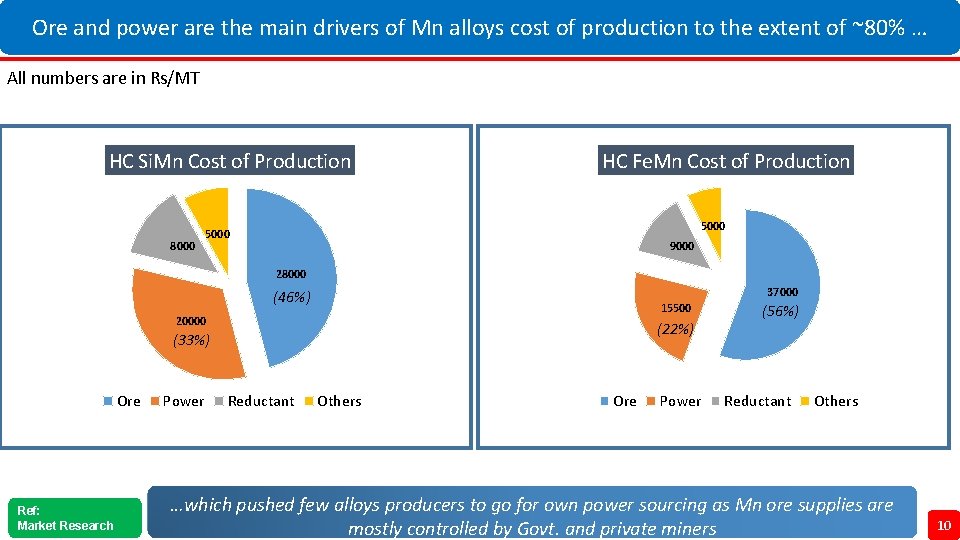
Ore and power are the main drivers of Mn alloys cost of production to the extent of ~80% … All numbers are in Rs/MT HC Si. Mn Cost of Production 8000 HC Fe. Mn Cost of Production 5000 9000 28000 37000 (46%) 15500 20000 (22%) (33%) Ore Ref: Market Research Power Reductant Others Ore Power (56%) Reductant Others …which pushed few alloys producers to go for own power sourcing as Mn ore supplies are mostly controlled by Govt. and private miners 10
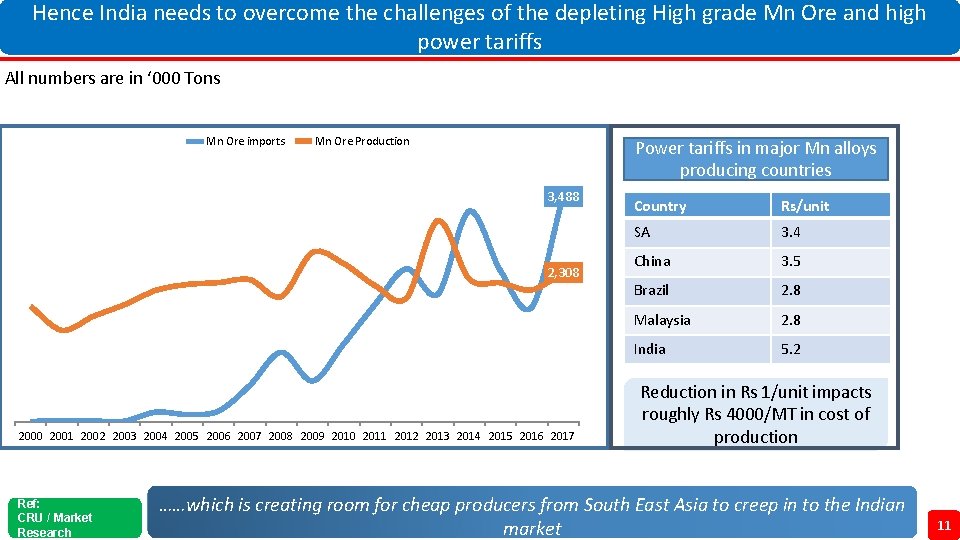
Hence India needs to overcome the challenges of the depleting High grade Mn Ore and high power tariffs All numbers are in ‘ 000 Tons Mn Ore imports Mn Ore Production Power tariffs in major Mn alloys producing countries 3, 488 2, 308 (46%) (33%) 2000 2001 2002 2003 2004 2005 2006 2007 2008 2009 2010 2011 2012 2013 2014 2015 2016 2017 Ref: CRU / Market Research Country Rs/unit SA 3. 4 China 3. 5 Brazil 2. 8 Malaysia (22%) India 2. 8 (56%) 5. 2 Reduction in Rs 1/unit impacts roughly Rs 4000/MT in cost of production ……which is creating room for cheap producers from South East Asia to creep in to the Indian market 11
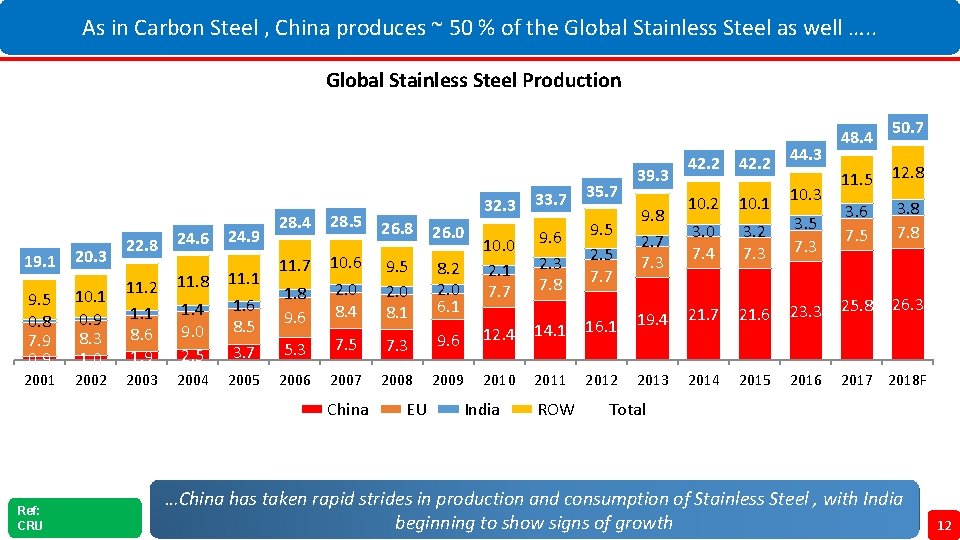
As in Carbon Steel , China produces ~ 50 % of the Global Stainless Steel as well …. . Source: CRU Global Stainless Steel Production 22. 8 24. 6 24. 9 19. 1 20. 3 9. 5 0. 8 7. 9 0. 9 10. 1 0. 9 8. 3 1. 0 11. 2 1. 1 8. 6 1. 9 11. 8 1. 4 9. 0 2. 5 11. 1 1. 6 8. 5 3. 7 2001 2002 2003 2004 2005 28. 4 28. 5 26. 0 9. 5 2. 0 8. 1 8. 2 2. 0 6. 1 1. 8 9. 6 10. 6 2. 0 8. 4 5. 3 7. 5 7. 3 2006 2007 2008 11. 7 China Ref: CRU 26. 8 EU 32. 3 33. 7 35. 7 10. 0 2. 1 7. 7 9. 6 2. 3 7. 8 9. 5 2. 5 7. 7 39. 3 9. 8 2. 7 7. 3 42. 2 44. 3 10. 2 10. 1 10. 3 3. 0 7. 4 3. 2 7. 3 3. 5 7. 3 21. 6 2015 9. 6 12. 4 14. 1 16. 1 19. 4 21. 7 2009 2010 2011 2012 2013 2014 India ROW 48. 4 50. 7 11. 5 12. 8 3. 6 7. 5 3. 8 7. 8 23. 3 25. 8 26. 3 2016 2017 2018 F Total …China has taken rapid strides in production and consumption of Stainless Steel , with India beginning to show signs of growth 12
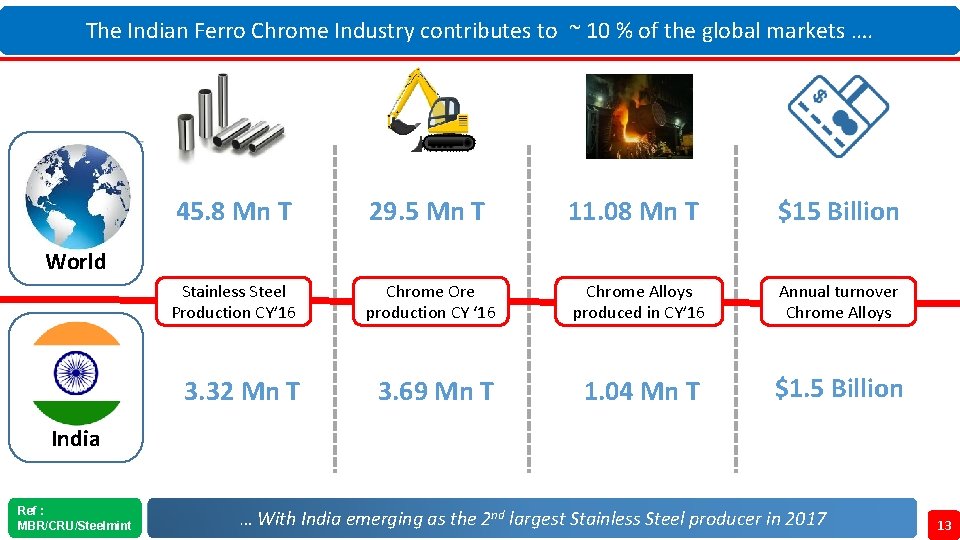
The Indian Ferro Chrome Industry contributes to ~ 10 % of the global markets …. 45. 8 Mn T 29. 5 Mn T 11. 08 Mn T $15 Billion Stainless Steel Production CY’ 16 Chrome Ore production CY ‘ 16 Chrome Alloys produced in CY’ 16 Annual turnover Chrome Alloys 3. 32 Mn T 3. 69 Mn T 1. 04 Mn T $1. 5 Billion World India Ref : MBR/CRU/Steelmint … With India emerging as the 2 nd largest Stainless Steel producer in 2017 13
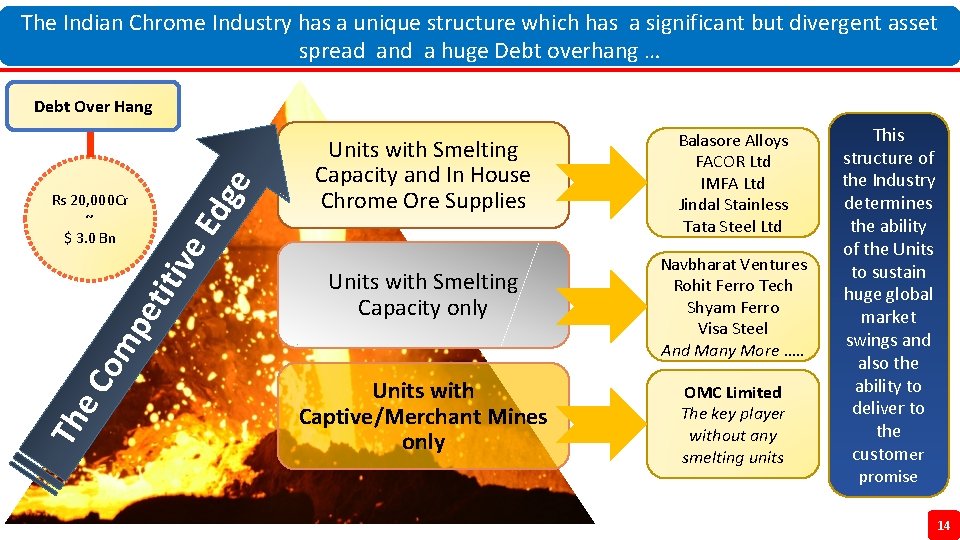
The Indian Chrome Industry has a unique structure which has a significant but divergent asset spread and a huge Debt overhang … e Debt Over Hang Th e. C om pe tit ive Ed g Rs 20, 000 Cr ~ $ 3. 0 Bn Units with Smelting Capacity and In House Chrome Ore Supplies Units with Smelting Capacity only Units with Captive/Merchant Mines only Balasore Alloys FACOR Ltd IMFA Ltd Jindal Stainless Tata Steel Ltd Navbharat Ventures Rohit Ferro Tech Shyam Ferro Visa Steel And Many More …. . OMC Limited The key player without any smelting units This structure of the Industry determines the ability of the Units to sustain huge global market swings and also the ability to deliver to the customer promise 14
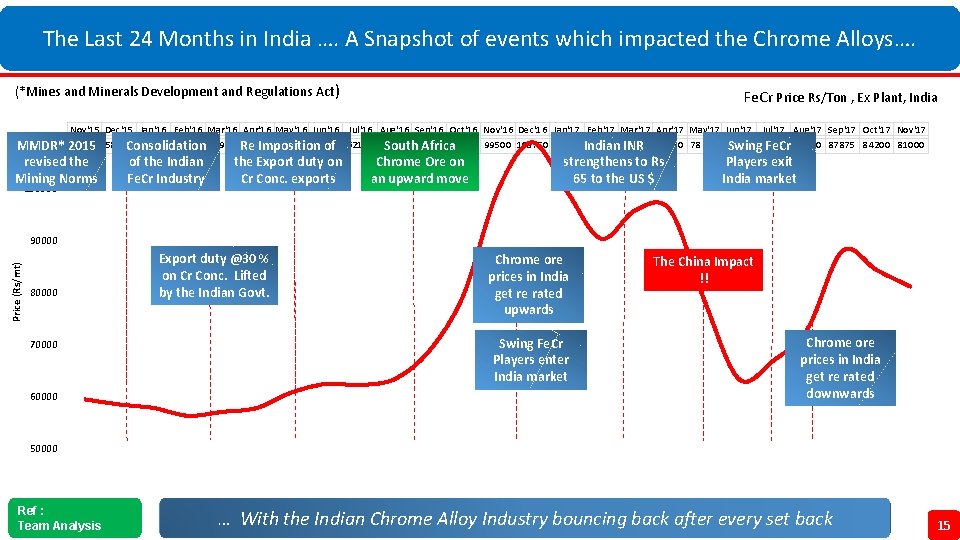
The Last 24 Months in India …. A Snapshot of events which impacted the Chrome Alloys…. (*Mines and Minerals Development and Regulations Act) Fe. Cr Price Rs/Ton , Ex Plant, India Nov'15 Dec'15 Jan'16 Feb'16 Mar'16 Apr'16 May'16 Jun'16 Jul'16 Aug'16 Sep'16 Oct'16 Nov'16 Dec'16 Jan'17 Feb'17 Mar'17 Apr'17 May'17 Jun'17 Jul'17 Aug'17 Sep'17 Oct'17 Nov'17 110000 Mkt 59350 58375 57688 56200 56938 Re 57688 60650 62313 90250 95750 MMDR* 2015 Consolidation Imposition of 62125 63250 South 68625 Africa 79400 99500 108750 99400 Indian INR 95750 78300 63250 Swing 66800 Fe. Cr 73000 87875 84200 81000 revised the Mining Norms 100000 of the Indian Fe. Cr Industry the Export duty on Cr Conc. exports Chrome Ore on an upward move strengthens to Rs 65 to the US $ Players exit India market Price (Rs/mt) 90000 80000 70000 60000 Export duty @30 % on Cr Conc. Lifted by the Indian Govt. Chrome ore prices in India get re rated upwards Swing Fe. Cr Players enter India market The China Impact !! Chrome ore prices in India get re rated downwards 50000 Ref : Team Analysis … With the Indian Chrome Alloy Industry bouncing back after every set back 15 15
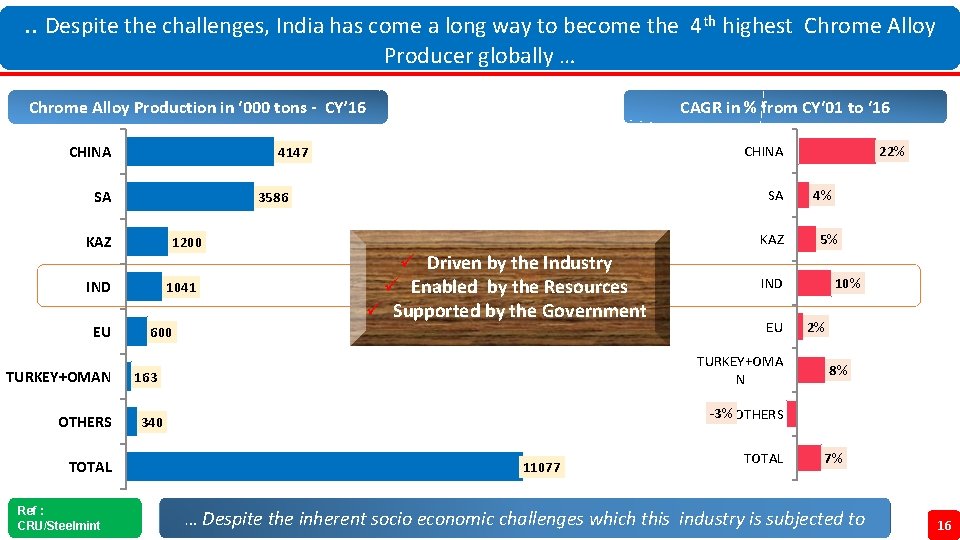
. . Despite the challenges, India has come a long way to become the 4 th highest Chrome Alloy Producer globally … CAGR in % from CY‘ 01 to ‘ 16 Chrome Alloy Production in ‘ 000 tons - CY’ 16 CHINA SA 1200 IND TURKEY+OMAN OTHERS TOTAL Ref : CRU/Steelmint SA 3586 KAZ EU CHINA 4147 1041 KAZ ü Driven by the Industry ü Enabled by the Resources ü Supported by the Government 600 4% 5% IND EU TURKEY+OMA N 163 22% 10% 2% 8% -3% OTHERS 340 11077 TOTAL 7% … Despite the inherent socio economic challenges which this industry is subjected to 16
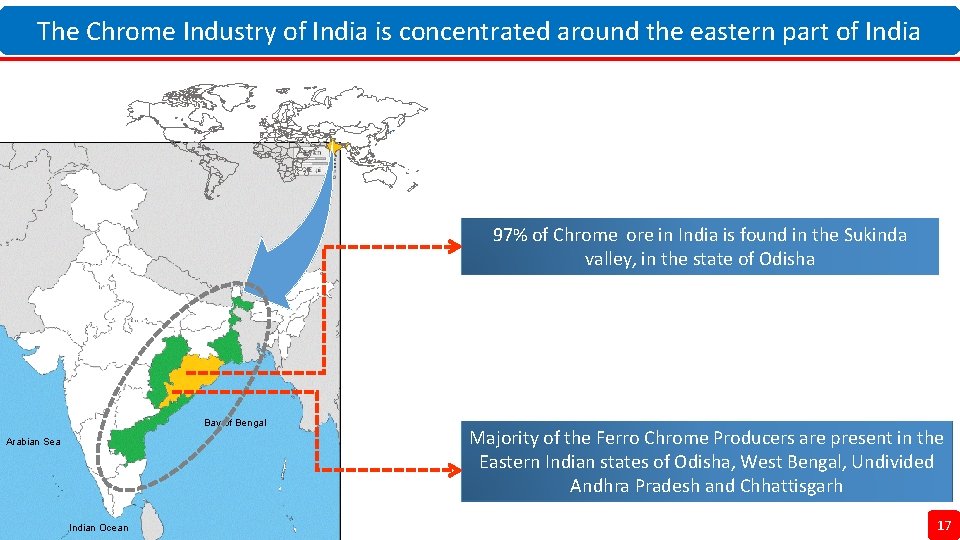
The Chrome Industry of India is concentrated around the eastern part of India 97% of Chrome ore in India is found in the Sukinda valley, in the state of Odisha Bay of Bengal Arabian Sea Indian Ocean Majority of the Ferro Chrome Producers are present in the Eastern Indian states of Odisha, West Bengal, Undivided Andhra Pradesh and Chhattisgarh 17
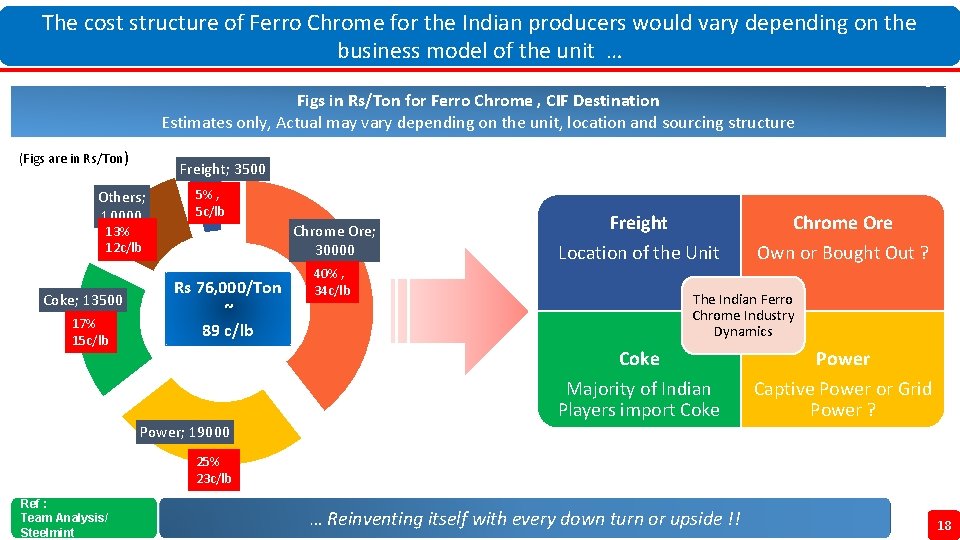
The cost structure of Ferro Chrome for the Indian producers would vary depending on the business model of the unit … Figs in Rs/Ton for Ferro Chrome , CIF Destination Estimates only, Actual may vary depending on the unit, location and sourcing structure (Figs are in Rs/Ton) Freight; 3500 Others; 10000 5% , 5 c/lb Chrome Ore; 30000 13% 12 c/lb Coke; 13500 17% 15 c/lb Rs 76, 000/Ton ~ 89 c/lb 40% , 34 c/lb Freight Chrome Ore Location of the Unit Own or Bought Out ? The Indian Ferro Chrome Industry Dynamics Coke Power Majority of Indian Players import Coke Captive Power or Grid Power ? Power; 19000 25% 23 c/lb Ref : Team Analysis/ Steelmint … Reinventing itself with every down turn or upside !! 18 18
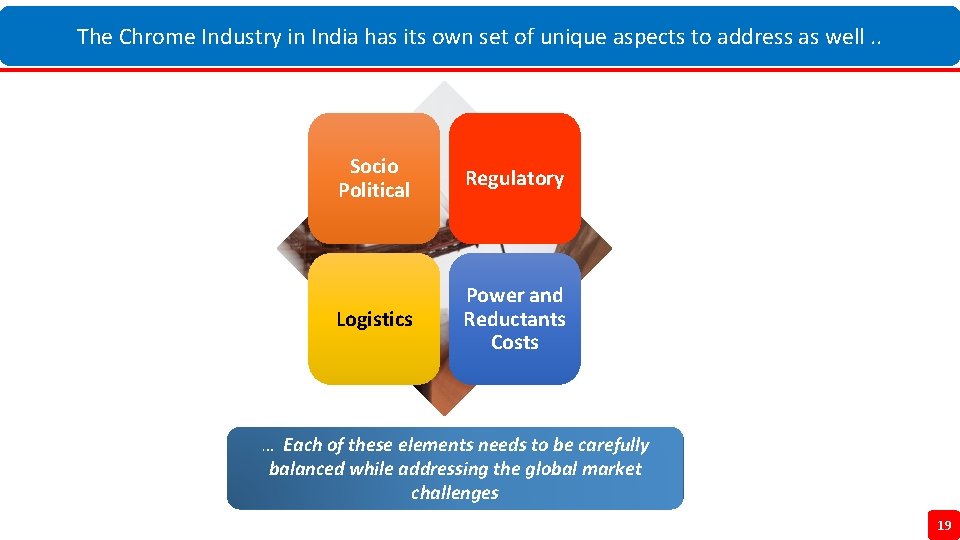
The Chrome Industry in India has its own set of unique aspects to address as well. . Socio Political Regulatory Logistics Power and Reductants Costs … Each of these elements needs to be carefully balanced while addressing the global market challenges 19
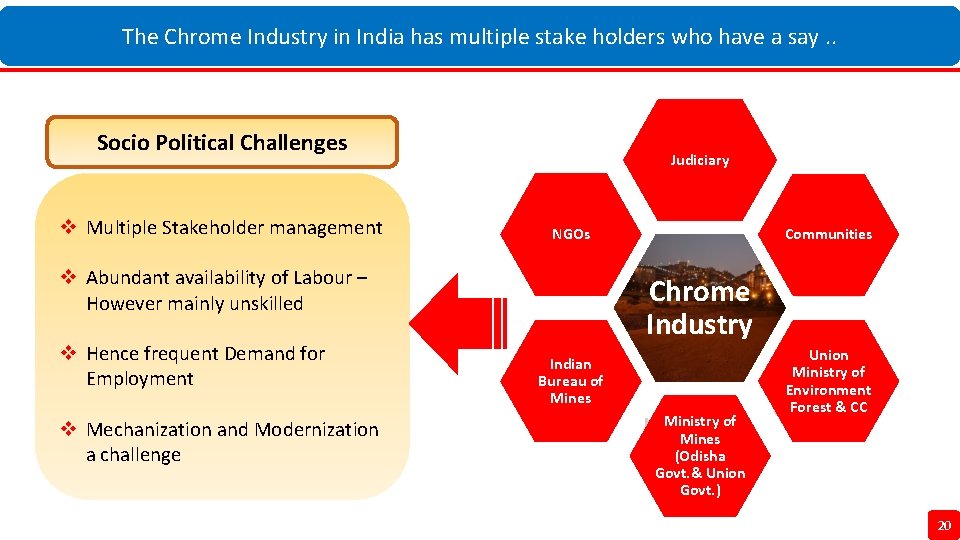
The Chrome Industry in India has multiple stake holders who have a say. . Socio Political Challenges v Multiple Stakeholder management Judiciary NGOs v Abundant availability of Labour – However mainly unskilled v Hence frequent Demand for Employment v Mechanization and Modernization a challenge Communities Chrome Industry Indian Bureau of Mines Ministry of Mines (Odisha Govt. & Union Govt. ) Union Ministry of Environment Forest & CC 20
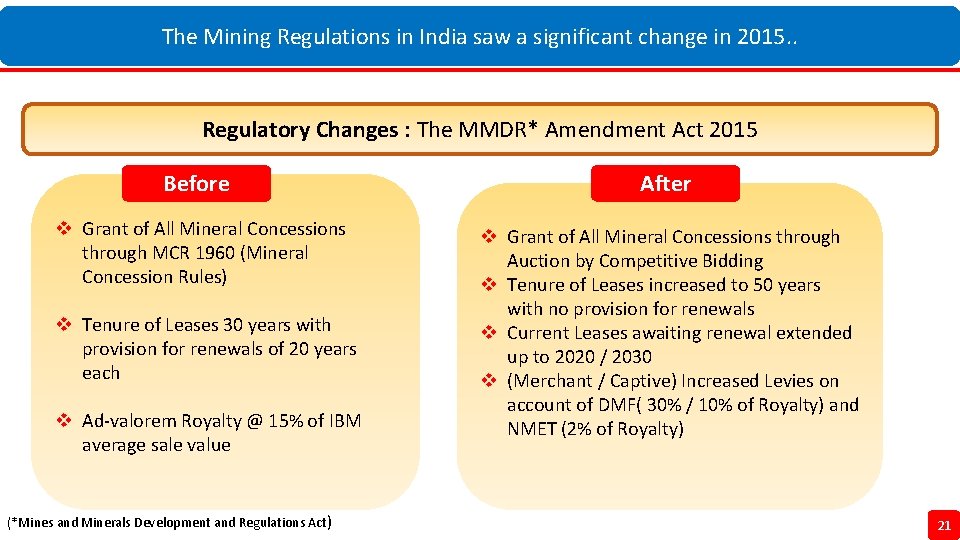
The Mining Regulations in India saw a significant change in 2015. . Regulatory Changes : The MMDR* Amendment Act 2015 Before After v Grant of All Mineral Concessions through MCR 1960 (Mineral Concession Rules) v Grant of All Mineral Concessions through Auction by Competitive Bidding v Tenure of Leases increased to 50 years with no provision for renewals v Current Leases awaiting renewal extended up to 2020 / 2030 v (Merchant / Captive) Increased Levies on account of DMF( 30% / 10% of Royalty) and NMET (2% of Royalty) v Tenure of Leases 30 years with provision for renewals of 20 years each v Ad-valorem Royalty @ 15% of IBM average sale value (*Mines and Minerals Development and Regulations Act) 21
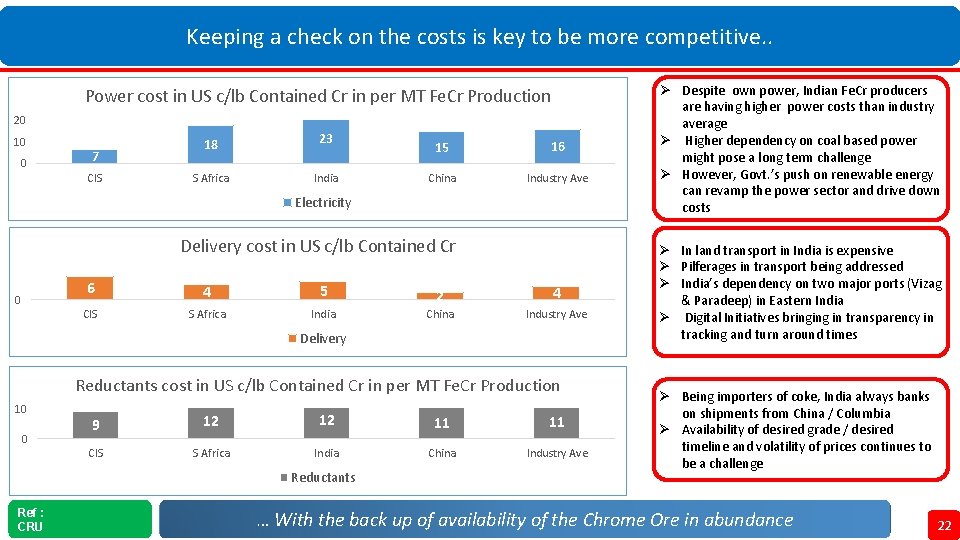
Keeping a check on the costs is key to be more competitive. . Power cost in US c/lb Contained Cr in per MT Fe. Cr Production 20 10 0 7 CIS 18 S Africa 23 India 15 16 China Industry Ave Electricity Delivery cost in US c/lb Contained Cr 0 6 4 5 2 4 CIS S Africa India China Industry Ave Delivery Reductants cost in US c/lb Contained Cr in per MT Fe. Cr Production 10 0 9 12 12 11 11 CIS S Africa India China Industry Ave Reductants Ref : CRU Ø Despite own power, Indian Fe. Cr producers are having higher power costs than industry average Ø Higher dependency on coal based power might pose a long term challenge Ø However, Govt. ’s push on renewable energy can revamp the power sector and drive down costs Ø In land transport in India is expensive Ø Pilferages in transport being addressed Ø India’s dependency on two major ports (Vizag & Paradeep) in Eastern India Ø Digital Initiatives bringing in transparency in tracking and turn around times Ø Being importers of coke, India always banks on shipments from China / Columbia Ø Availability of desired grade / desired timeline and volatility of prices continues to be a challenge … With the back up of availability of the Chrome Ore in abundance 22 22
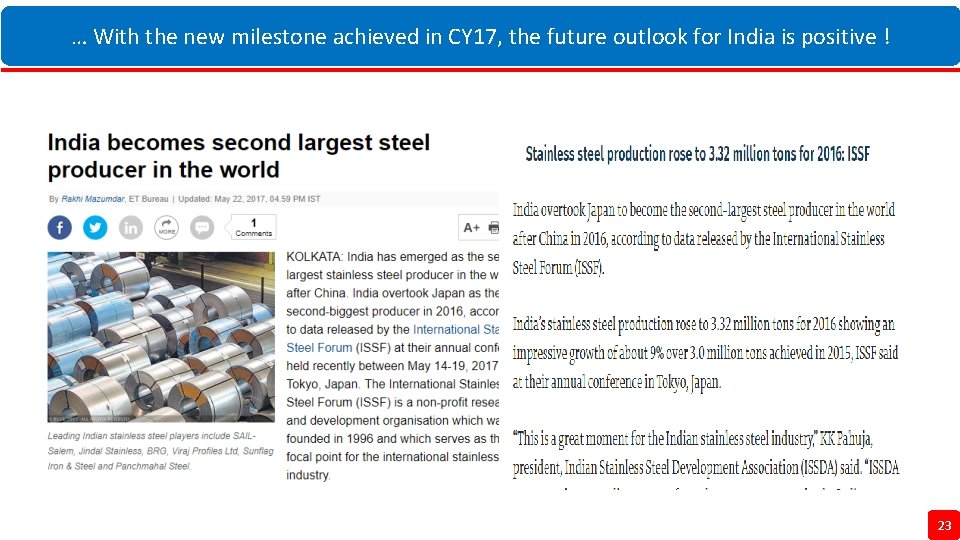
… With the new milestone achieved in CY 17, the future outlook for India is positive ! 23
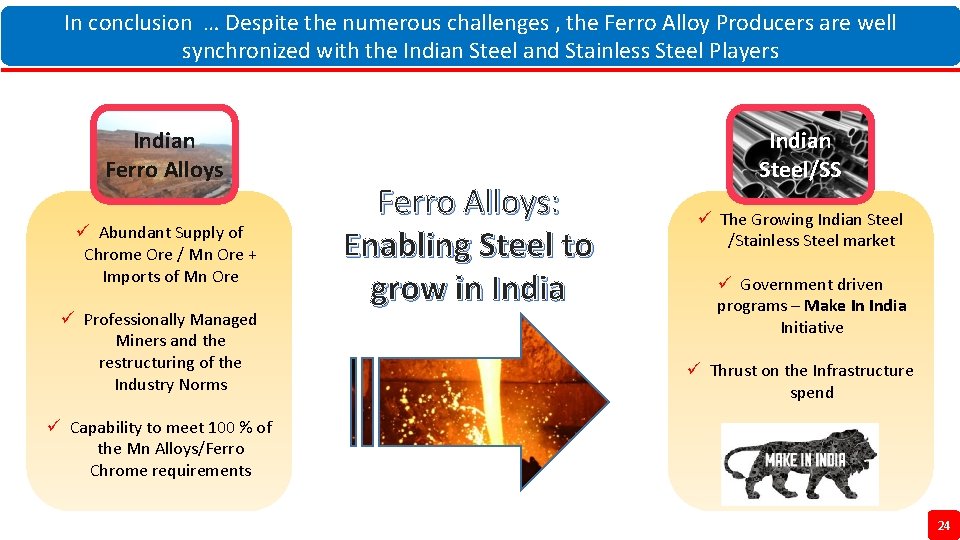
In conclusion … Despite the numerous challenges , the Ferro Alloy Producers are well synchronized with the Indian Steel and Stainless Steel Players Indian Ferro Alloys ü Abundant Supply of Chrome Ore / Mn Ore + Imports of Mn Ore ü Professionally Managed Miners and the restructuring of the Industry Norms Ferro Alloys: Enabling Steel to grow in Indian Steel/SS ü The Growing Indian Steel /Stainless Steel market ü Government driven programs – Make In India Initiative ü Thrust on the Infrastructure spend ü Capability to meet 100 % of the Mn Alloys/Ferro Chrome requirements 24
Thank You ! T V Srinivas Shenoy Chief of Marketing and Sales Ferro Alloys and Minerals SBU Tata Steel Limited – India tvshenoy@tatasteel. com 25