
The Imperative of Strategic Enrollment Planning Why Todays





- Slides: 65
The Imperative of Strategic Enrollment Planning: Why Today’s Environment Requires More Planning, and Why It’s Risky to Delay Gary L. Fretwell Senior Vice President and Principal All material in this presentation, including text and images, is the property of Noel-Levitz, LLC. Permission is required to reproduce information.
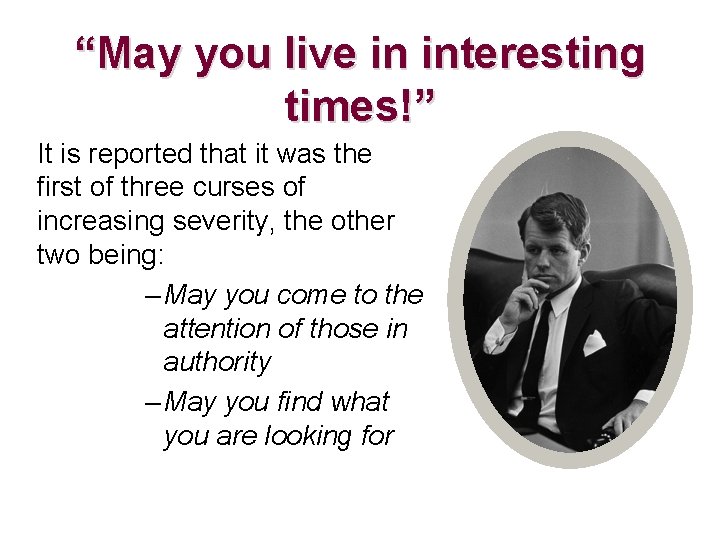
“May you live in interesting times!” It is reported that it was the first of three curses of increasing severity, the other two being: – May you come to the attention of those in authority – May you find what you are looking for
1. Why Plan? 2. Strategic Enrollment Planning Overview 3. Creating the Organizational Structures 4. Characteristics of a Successful Strategic Enrollment Plan
1 Why Plan?
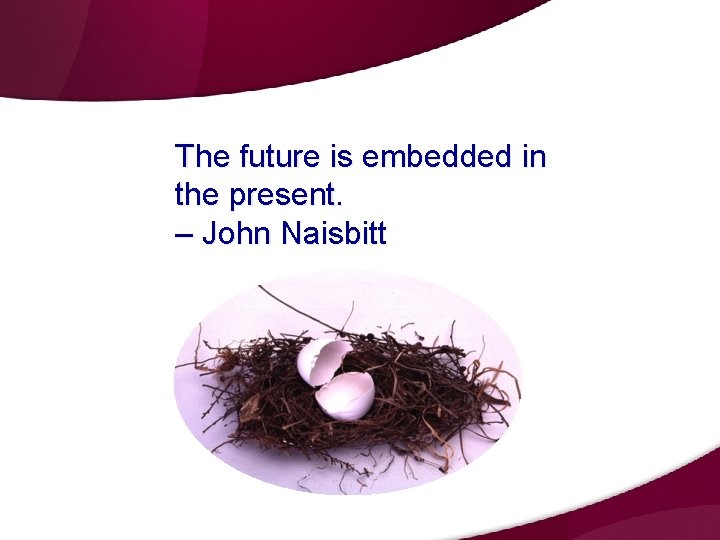
The future is embedded in the present. – John Naisbitt
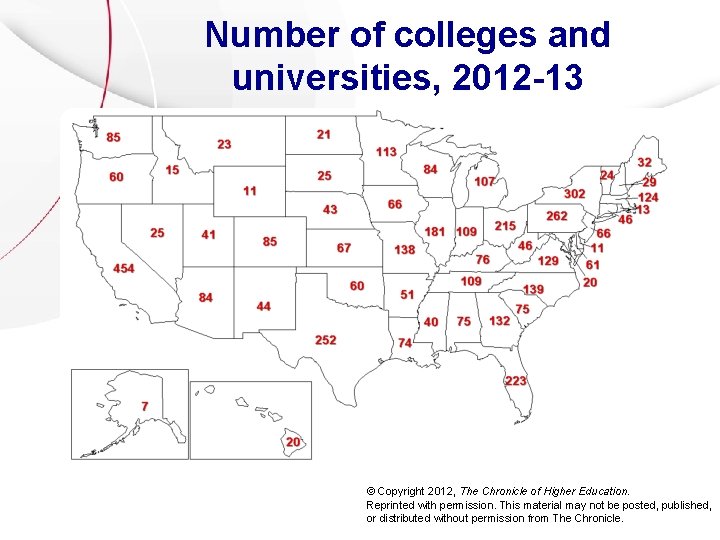
Number of colleges and universities, 2012 -13 © Copyright 2012, The Chronicle of Higher Education. Reprinted with permission. This material may not be posted, published, or distributed without permission from The Chronicle. shis material may not be posted, published, or distributed with
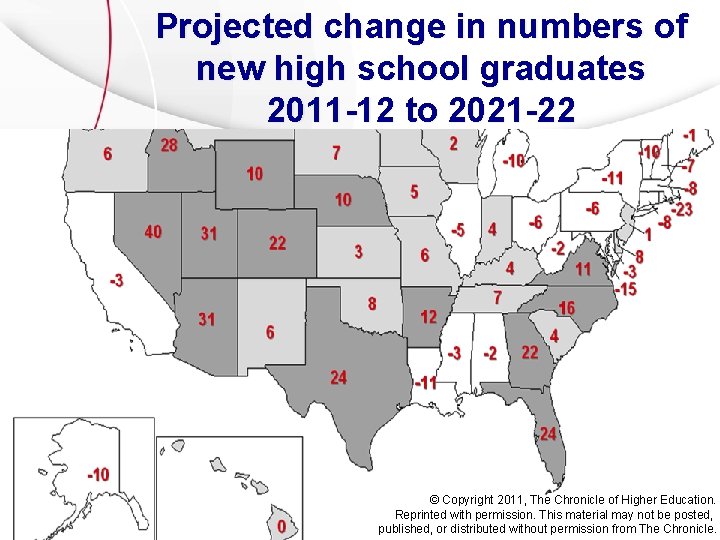
Projected change in numbers of new high school graduates 2011 -12 to 2021 -22 © Copyright 2011, The Chronicle of Higher Education. Reprinted with permission. This material may not be posted, published, or distributed without permission from The Chronicle.
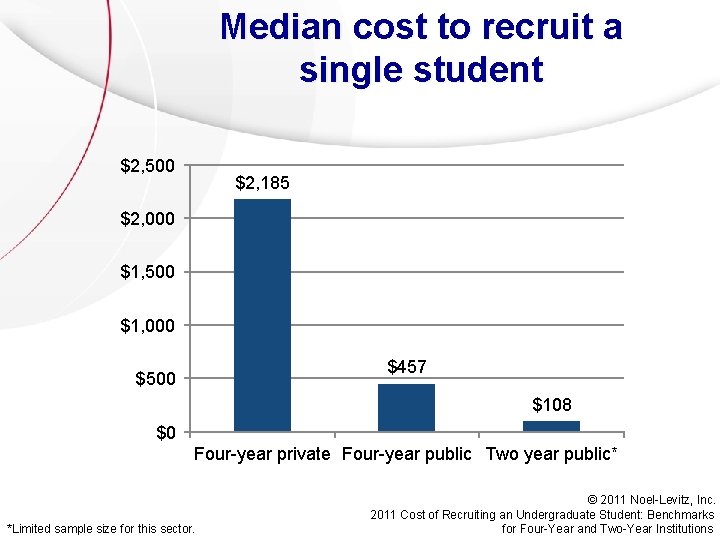
Median cost to recruit a single student $2, 500 $2, 185 $2, 000 $1, 500 $1, 000 $457 $500 $108 $0 Four-year private Four-year public Two year public* *Limited sample size for this sector. © 2011 Noel-Levitz, Inc. 2011 Cost of Recruiting an Undergraduate Student: Benchmarks for Four-Year and Two-Year Institutions
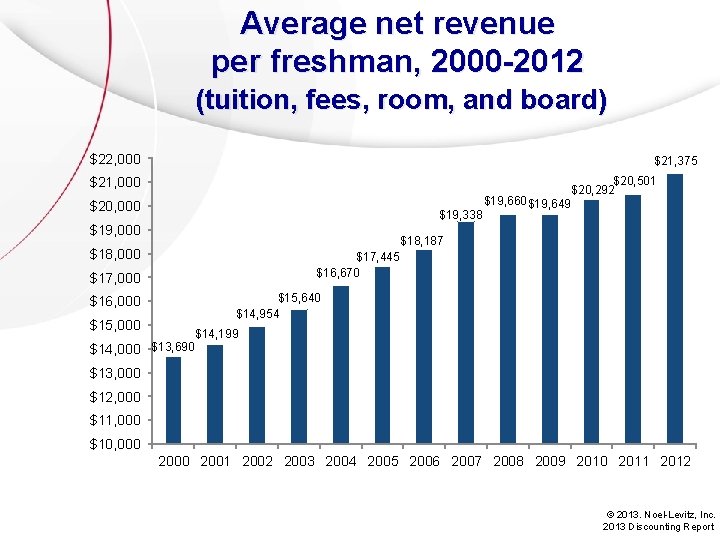
Average net revenue per freshman, 2000 -2012 (tuition, fees, room, and board) $22, 000 $21, 375 $21, 000 $20, 000 $19, 338 $19, 000 $19, 660 $19, 649 $20, 501 $20, 292 $18, 187 $18, 000 $17, 445 $16, 670 $17, 000 $15, 640 $14, 954 $16, 000 $15, 000 $14, 000 $13, 690 $14, 199 $13, 000 $12, 000 $11, 000 $10, 000 2001 2002 2003 2004 2005 2006 2007 2008 2009 2010 2011 2012 © 2013. Noel-Levitz, Inc. 2013 Discounting Report
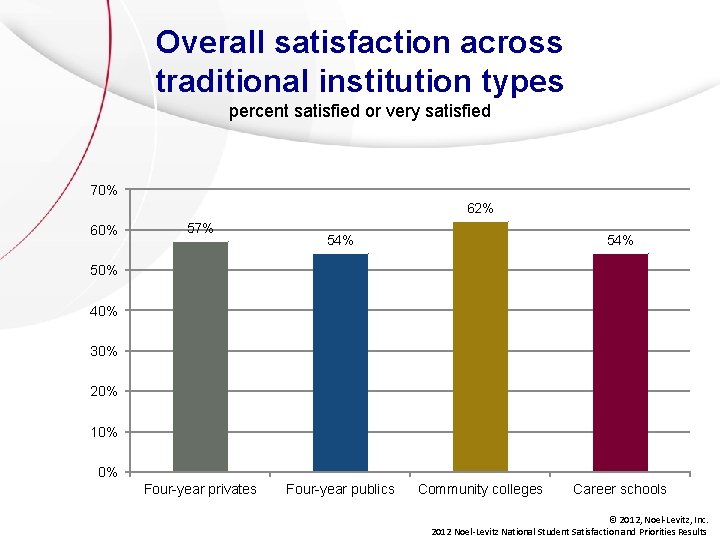
Overall satisfaction across traditional institution types percent satisfied or very satisfied 70% 62% 60% 57% 54% 50% 40% 30% 20% 10% 0% Four-year privates Four-year publics Community colleges Career schools © 2012, Noel-Levitz, Inc. 2012 Noel-Levitz National Student Satisfaction and Priorities Results
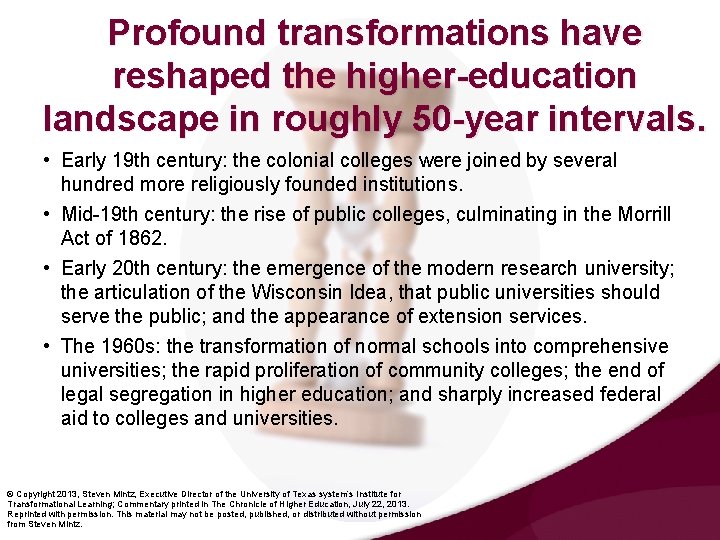
Profound transformations have reshaped the higher-education landscape in roughly 50 -year intervals. • Early 19 th century: the colonial colleges were joined by several hundred more religiously founded institutions. • Mid-19 th century: the rise of public colleges, culminating in the Morrill Act of 1862. • Early 20 th century: the emergence of the modern research university; the articulation of the Wisconsin Idea, that public universities should serve the public; and the appearance of extension services. • The 1960 s: the transformation of normal schools into comprehensive universities; the rapid proliferation of community colleges; the end of legal segregation in higher education; and sharply increased federal aid to colleges and universities. © Copyright 2013, Steven Mintz, Executive Director of the University of Texas system’s Institute for Transformational Learning; Commentary printed in The Chronicle of Higher Education, July 22, 2013. Reprinted with permission. This material may not be posted, published, or distributed without permission from Steven Mintz.
We are in the midst of another higher-education revolution
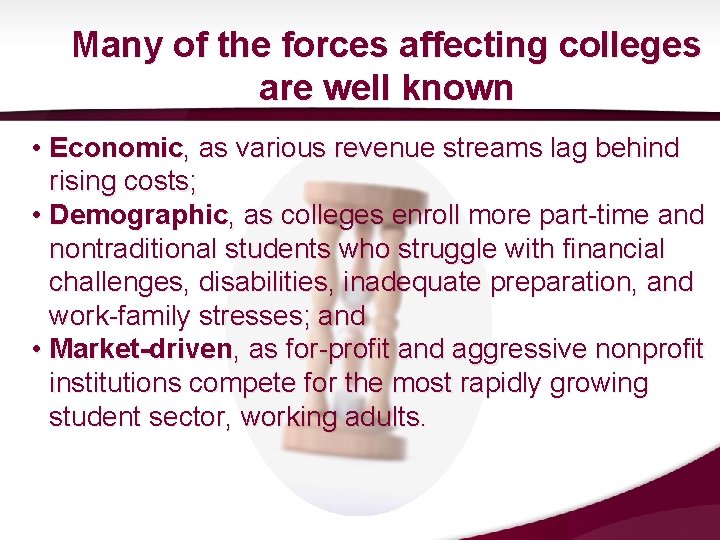
Many of the forces affecting colleges are well known • Economic, as various revenue streams lag behind rising costs; • Demographic, as colleges enroll more part-time and nontraditional students who struggle with financial challenges, disabilities, inadequate preparation, and work-family stresses; and • Market-driven, as for-profit and aggressive nonprofit institutions compete for the most rapidly growing student sector, working adults.
As The Chronicle's Jeff Selingo has suggested, an equally serious challenge is ideological Now regarded as a private rather than a public good, higher education must address a host of criticisms: • That graduation rates are too low, • That levels of student engagement and learning outcomes are unacceptable, and • That a college education does not provide good value for the money.
The most important challenge involves a shift in the way students consume higher education Instead of attending a single institution, students receive credit in multiple ways, including from earlycollege/dual-degree programs, community colleges, online providers, and multiple universities. Students are voting with their feet, embracing online courses and undermining core curricula, which served as a cash cow, by turning to alternate providers, and pursuing fewer majors that require study of a foreign language.
Colleges must become more nimble, entrepreneurial, student-focused, and accountable for what students learn Steven Mintz makes these predictions for 15 innovations that will alter the face of higher education in the next 3 years: 1. E-Advising 2. Evidence-based pedagogy 3. Decline of the lone-eagle teaching approach 4. Optimized class time 5. Easier educational transitions 6. Fewer large lecture classes 7. New frontiers for e-learning 8. Personalized adaptive learning 9. Increased competency-based and prior-learning credits 10. Data-driven instruction 11. Aggressive pursuit of new revenue 12. Online and low-residency degrees at flagships 13. More certificates and badges 14. Free and open textbooks 15. Public-private partnerships
These changes are already provoking a great deal of anxiety and alarm There is a danger that higher education will become even more stratified and bifurcated than it already is. The fear is that less-well-financed institutions will displace faculty with low-quality correspondence courses and forms of machine learning that poorly serve at-risk students. The next three years hold out the prospect of transforming the higher-education experience in positive ways.
Public higher education will change fundamentally, whether we like it or not
"The key to success in the 21 st century is alignment; Staying in alignment with a world that will be characterized by complexity, diversity, and pace of change. " - Ed Barlow, Futurist -
What will be necessary to change in our enrollment processes, priorities, and systems to achieve our enrollment goals and respond to the institutional strategic plan within an ever-changing environment?
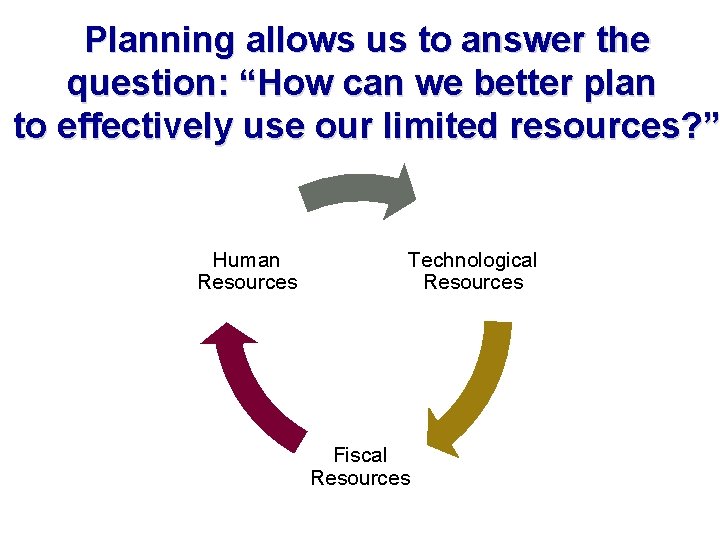
Planning allows us to answer the question: “How can we better plan to effectively use our limited resources? ” Human Resources Technological Resources Fiscal Resources
2 Strategic Enrollment Planning Overview
© 2012 Noel-Levitz, Inc.
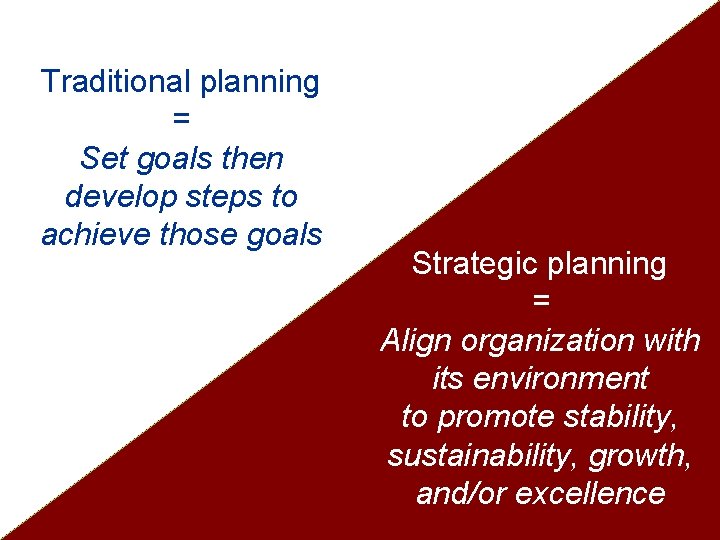
Traditional planning = Set goals then develop steps to achieve those goals Strategic planning = Align organization with its environment to promote stability, sustainability, growth, and/or excellence
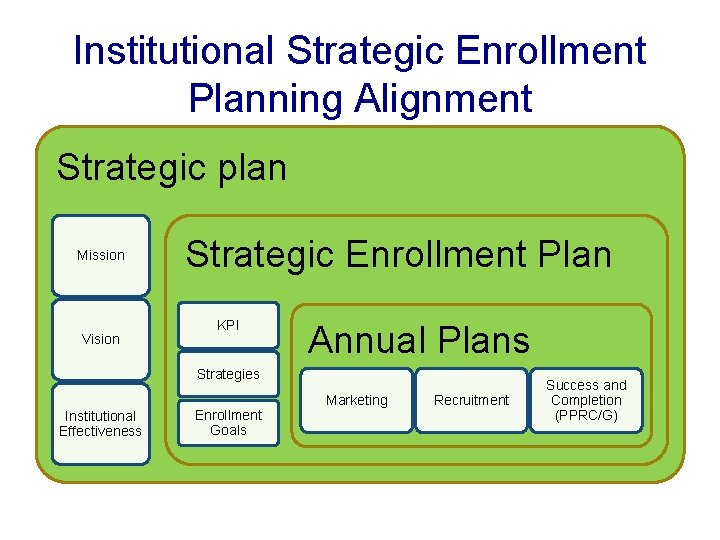
Institutional Strategic Enrollment Planning Alignment Strategic plan Mission Vision Strategic Enrollment Plan KPI Annual Plans Strategies Institutional Effectiveness Enrollment Goals Marketing Recruitment Success and Completion (PPRC/G)
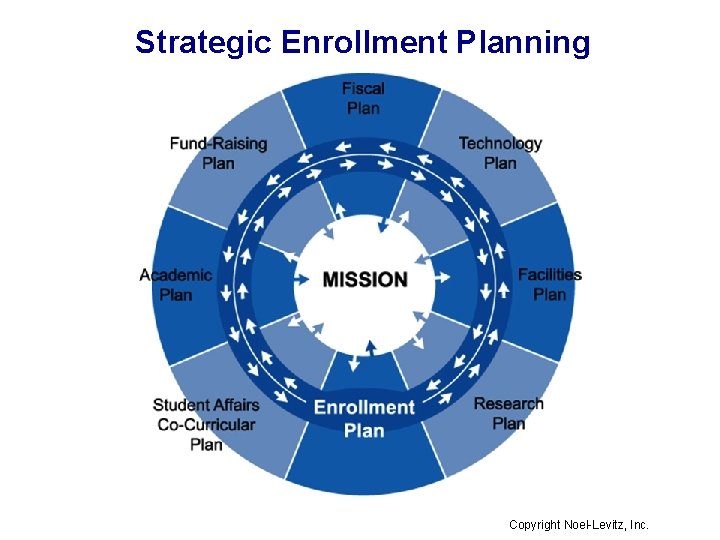
Strategic Enrollment Planning Copyright Noel-Levitz, Inc.
Strategic Enrollment Planning … Involves the campus in identifying, prioritizing, implementing, evaluating, and modifying enrollment strategies and goals within a changing environment in order to effectively and efficiently : • Realize the institution’s mission and vision, and • Support the institution’s capabilities to recruit and maximally serve students currently and in the future. How does the strategic enrollment planning model differ from the traditional planning model?
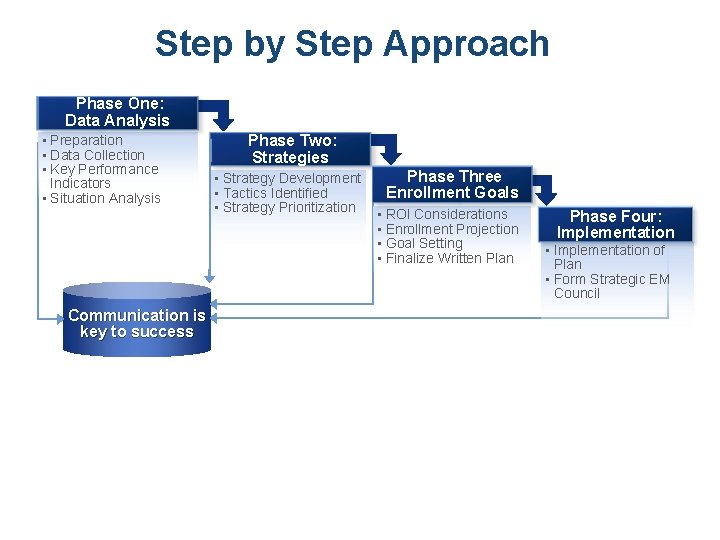
Step by Step Approach Phase One: Data Analysis • Preparation • Data Collection • Key Performance Indicators • Situation Analysis Communication is key to success Phase Two: Strategies • Strategy Development • Tactics Identified • Strategy Prioritization Phase Three Enrollment Goals • ROI Considerations • Enrollment Projection • Goal Setting • Finalize Written Plan Phase Four: Implementation • Implementation of Plan • Form Strategic EM Council
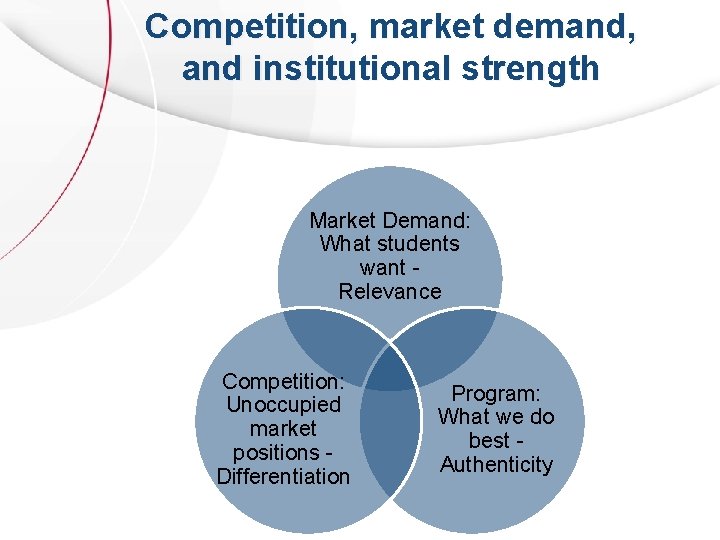
Competition, market demand, and institutional strength Market Demand: What students want Relevance Competition: Unoccupied market positions Differentiation Program: What we do best Authenticity
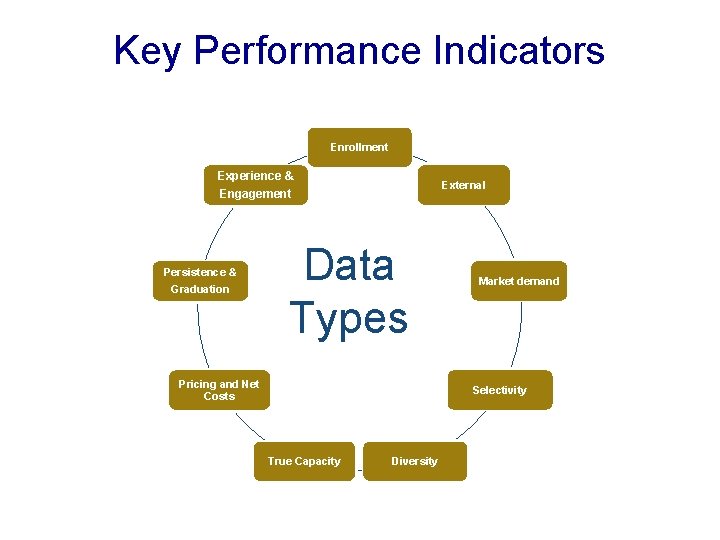
Key Performance Indicators Enrollment Experience & Engagement Persistence & Graduation External Data Types Pricing and Net Costs Market demand Selectivity True Capacity Diversity
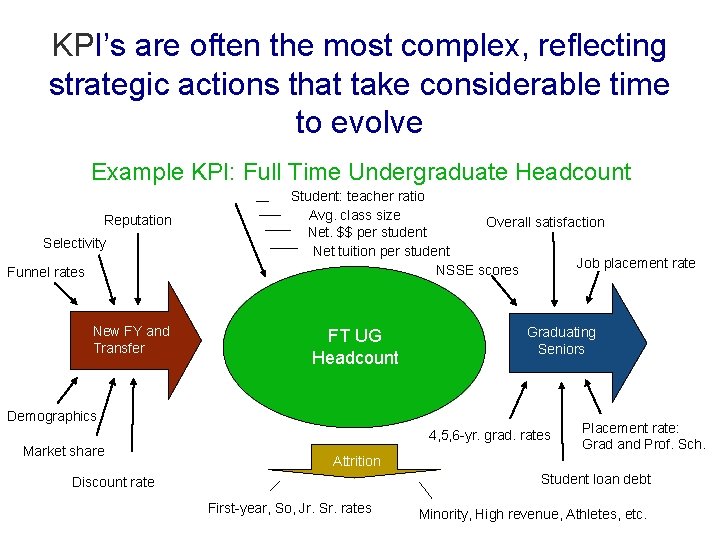
KPI’s are often the most complex, reflecting strategic actions that take considerable time to evolve Example KPI: Full Time Undergraduate Headcount Reputation Selectivity Funnel rates New FY and Transfer Student: teacher ratio Avg. class size Overall satisfaction Net. $$ per student Net tuition per student Job placement rate NSSE scores FT UG Headcount Graduating Seniors Demographics 4, 5, 6 -yr. grad. rates Market share Placement rate: Grad and Prof. Sch. Attrition Student loan debt Discount rate First-year, So, Jr. Sr. rates Minority, High revenue, Athletes, etc.
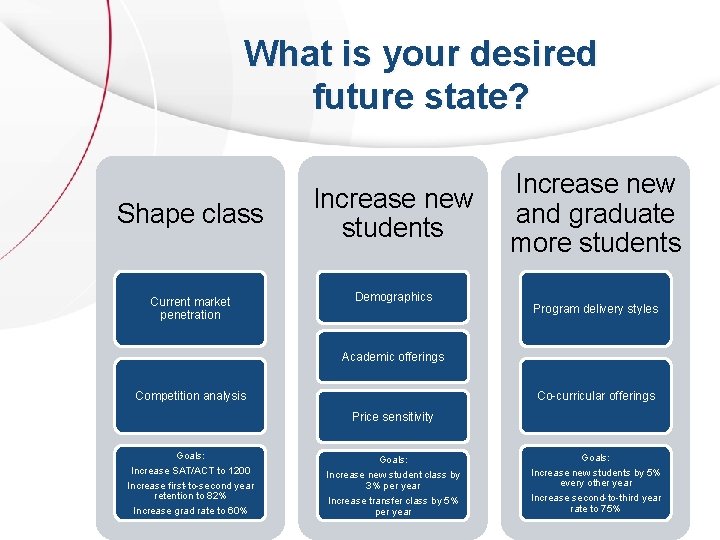
What is your desired future state? Shape class Current market penetration Increase new students Demographics Increase new and graduate more students Program delivery styles Academic offerings Competition analysis Co-curricular offerings Price sensitivity Goals: Increase SAT/ACT to 1200 Increase first-to-second year retention to 82% Increase grad rate to 60% Goals: Increase new student class by 3% per year Increase transfer class by 5% per year Goals: Increase new students by 5% every other year Increase second-to-third year rate to 75%
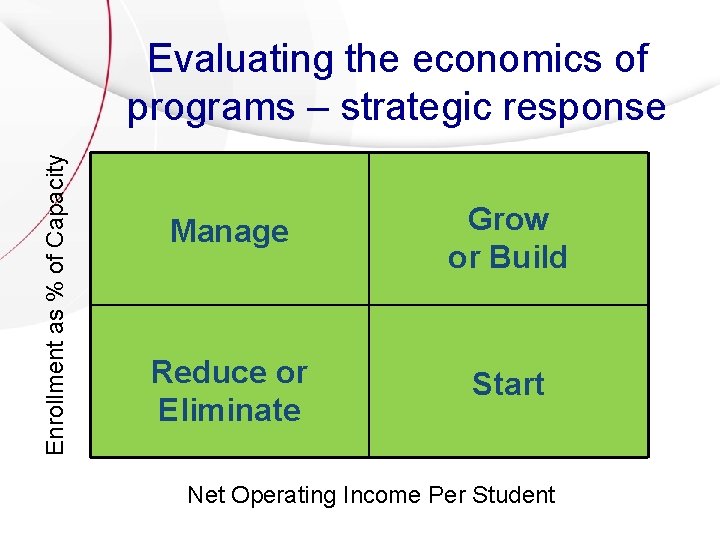
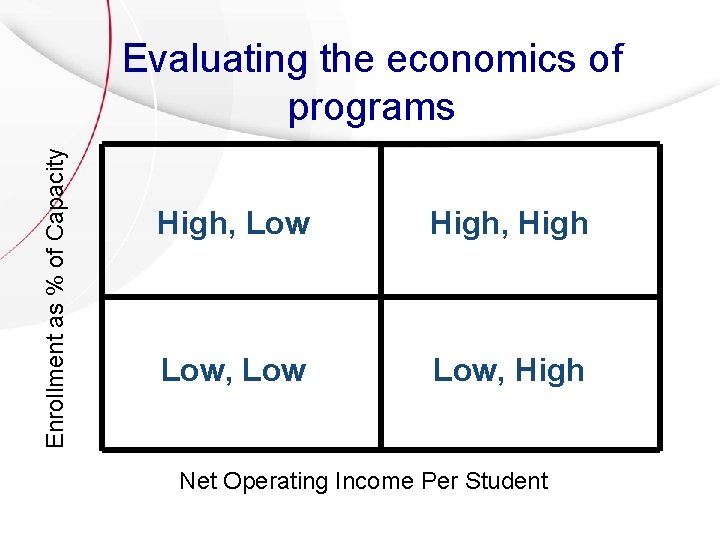
Enrollment as % of Capacity Evaluating the economics of programs – strategic response Manage Grow or Build Reduce or Eliminate Start Net Operating Income Per Student
Enrollment as % of Capacity Evaluating the economics of programs High, Low High, High Low, High Net Operating Income Per Student
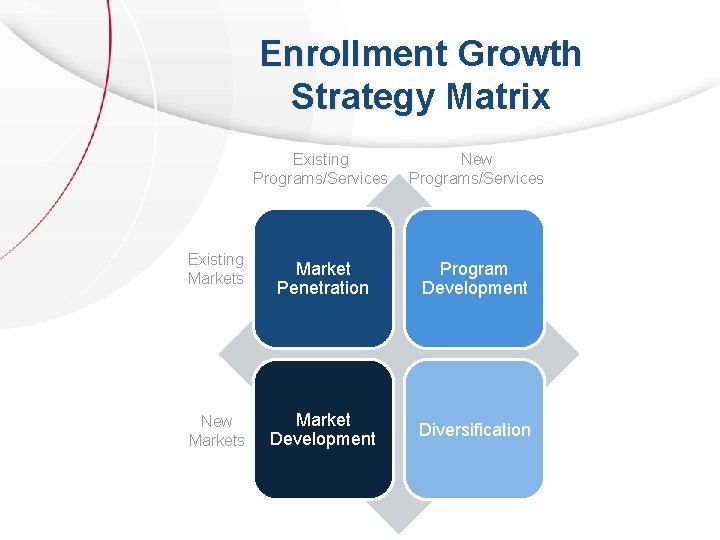
Enrollment Growth Strategy Matrix Existing Programs/Services New Programs/Services Existing Markets Market Penetration Program Development New Markets Market Development Diversification
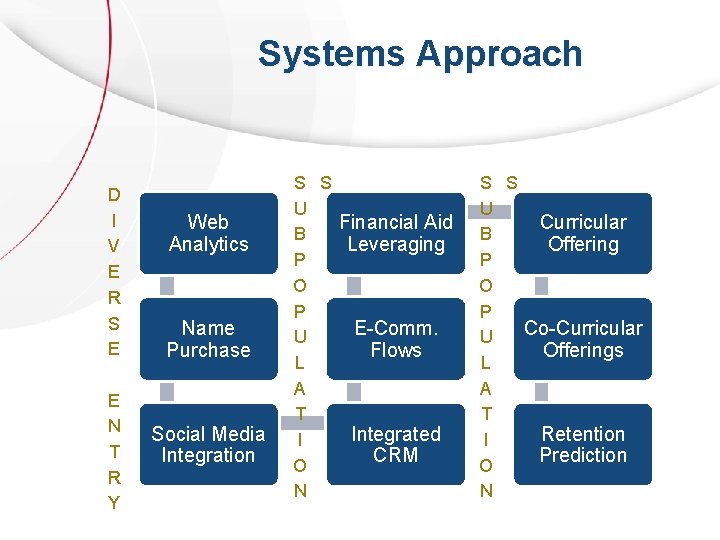
Systems Approach D I V E R S E E N T R Y Web Analytics Name Purchase Social Media Integration S S U Financial Aid B Leveraging P O P E-Comm. U Flows L A T Integrated I CRM O N S S U Curricular B Offering P O P Co-Curricular U Offerings L A T Retention I Prediction O N
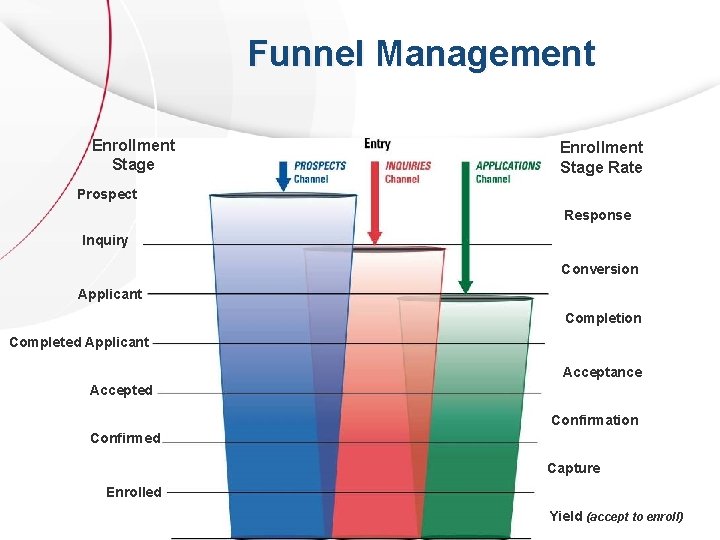
Funnel Management Enrollment Stage Rate Prospect Response Inquiry Conversion Applicant Completion Completed Applicant Acceptance Accepted Confirmation Confirmed Capture Enrolled Yield (accept to enroll)
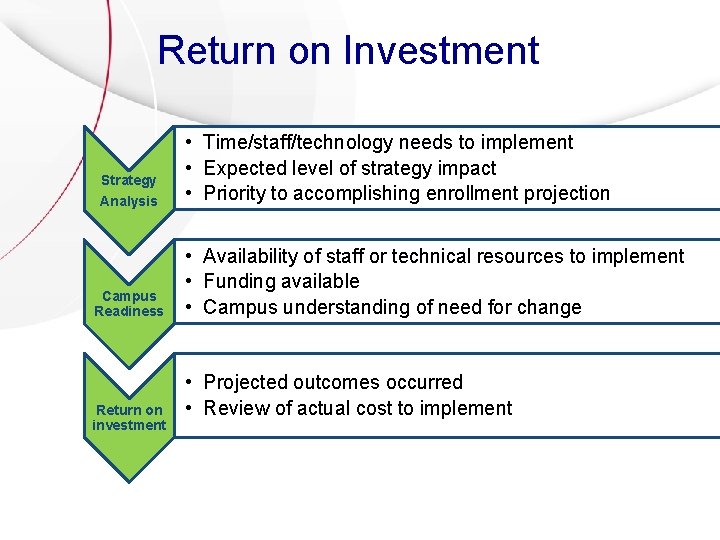
Return on Investment Strategy Analysis Campus Readiness Return on investment • Time/staff/technology needs to implement • Expected level of strategy impact • Priority to accomplishing enrollment projection • Availability of staff or technical resources to implement • Funding available • Campus understanding of need for change • Projected outcomes occurred • Review of actual cost to implement
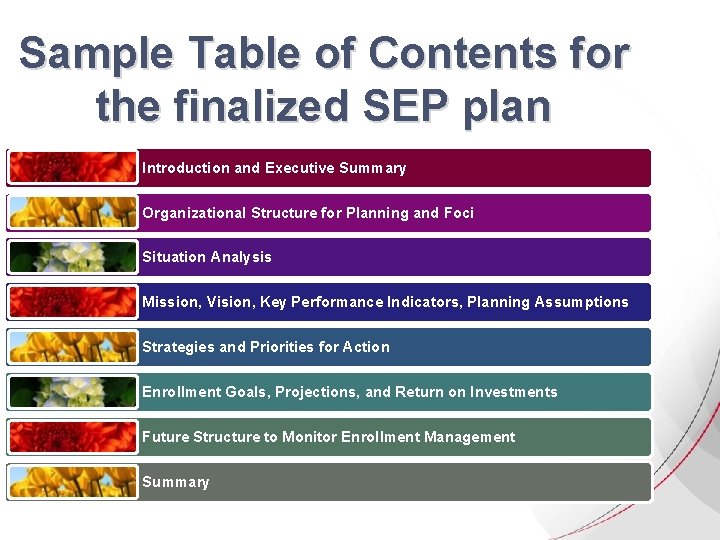
Sample Table of Contents for the finalized SEP plan Introduction and Executive Summary Organizational Structure for Planning and Foci Situation Analysis Mission, Vision, Key Performance Indicators, Planning Assumptions Strategies and Priorities for Action Enrollment Goals, Projections, and Return on Investments Future Structure to Monitor Enrollment Management Summary
3 Creating the Organizational Structures
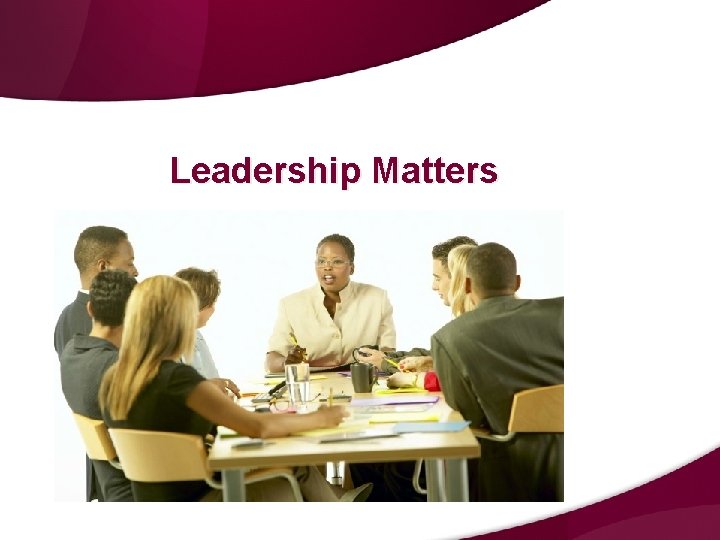
Leadership Matters
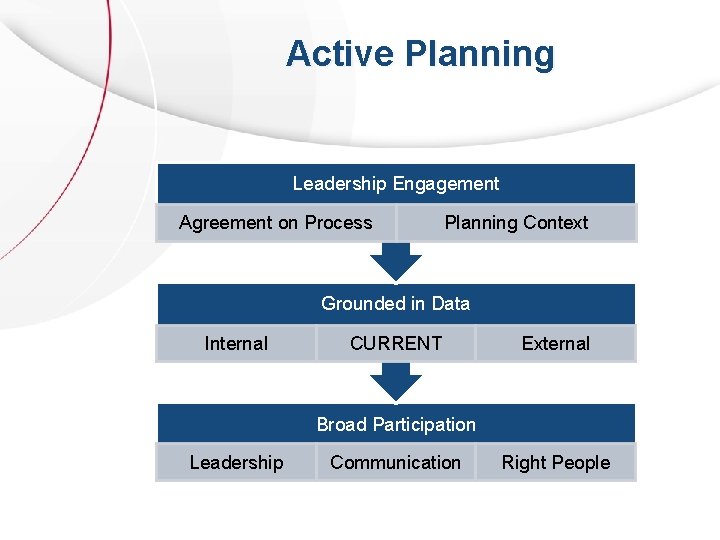
Active Planning Leadership Engagement Agreement on Process Planning Context Grounded in Data Internal CURRENT External Broad Participation Leadership Communication Right People
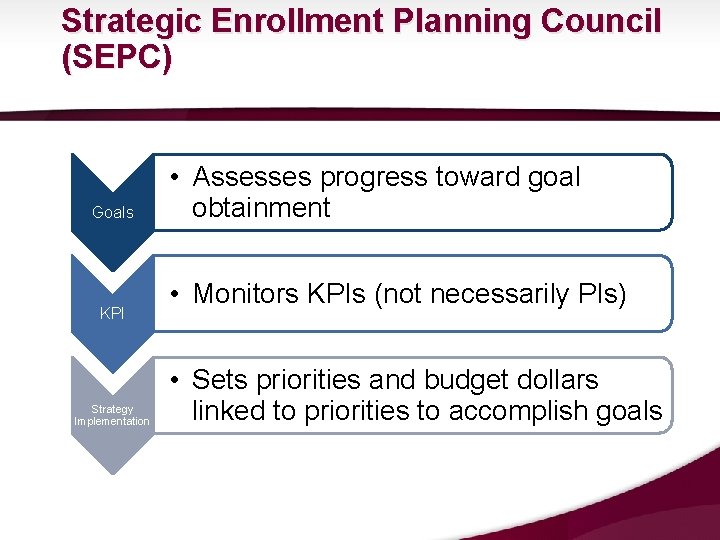
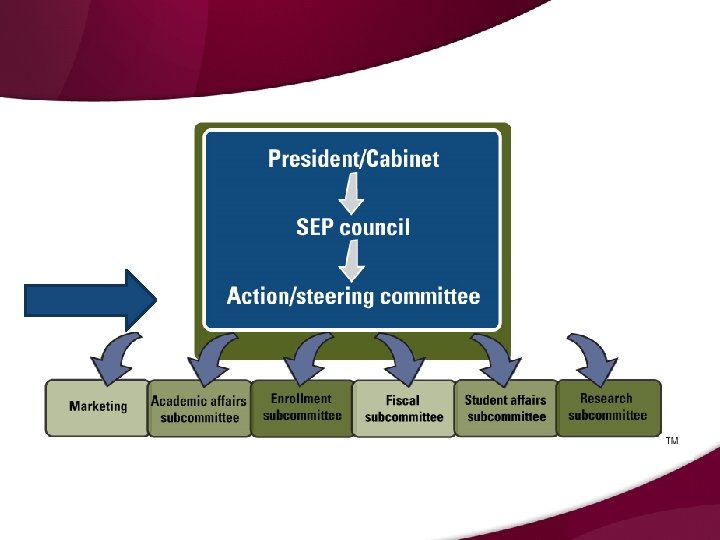
Strategic Enrollment Planning Council (SEPC) Goals KPI Strategy Implementation • Assesses progress toward goal obtainment • Monitors KPIs (not necessarily PIs) • Sets priorities and budget dollars linked to priorities to accomplish goals
Strategic Enrollment Planning Council (Get-it-done, high-level team!) 1. 2. 3. 4. President/Provost/VPAA Chief Financial Officer Director of Institutional Research Faculty Leadership (multiple people) 5. Director of Marketing/Communications 6. Vice President for Student Life 7. Vice President for Enrollment Management Maybe: Director of Athletics Director of Admissions Director of Financial Aid Registrar Director of Housing
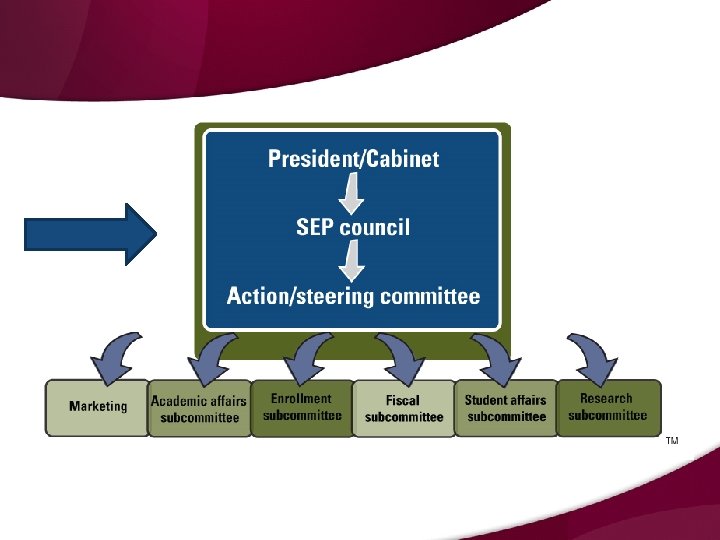
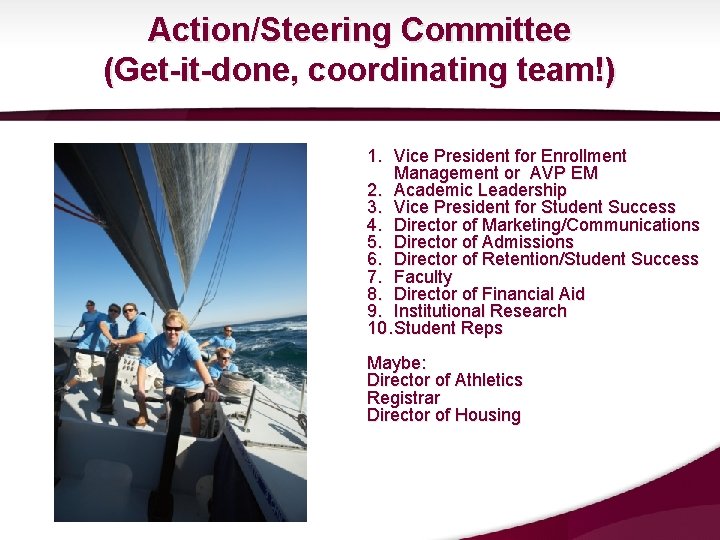
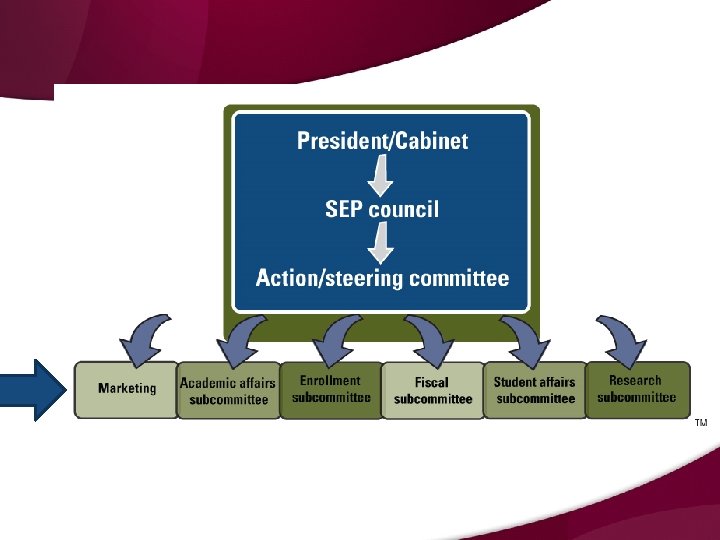
Action/Steering Committee (Get-it-done, coordinating team!) 1. Vice President for Enrollment Management or AVP EM 2. Academic Leadership 3. Vice President for Student Success 4. Director of Marketing/Communications 5. Director of Admissions 6. Director of Retention/Student Success 7. Faculty 8. Director of Financial Aid 9. Institutional Research 10. Student Reps Maybe: Director of Athletics Registrar Director of Housing
Action/Steering Committee • Lead person (or co-lead) who works well with others, has a passion for topic, and can be the go-between for the SEP council • Working group members who are prepared to work • Include representation to gather buy-in • Likely should lead a working group
Define Project Scope 1. Assessing a changing environment 2. Academic and co-curricular program planning 3. Net operating revenues and expenses 4. Pricing 5. Financial aid policies 6. Shaping the student profile 7. Student retention 8. Enrollment management effectiveness
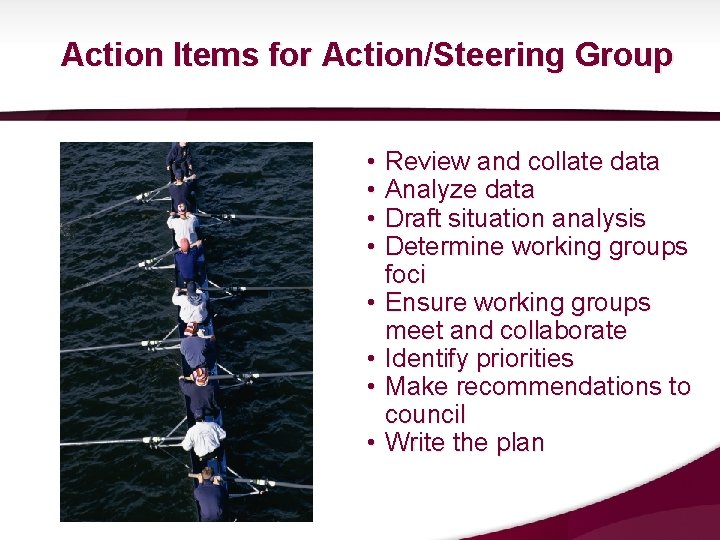
Action Items for Action/Steering Group • Review and collate data • Analyze data • Draft situation analysis • Determine working groups foci • Ensure working groups meet and collaborate • Identify priorities • Make recommendations to council • Write the plan
Working Group Activities Focus • Focus area situation analyses • Ensure focus remains connected toward supporting strong academic outcomes • Strengthen the college/university through providing strategic direction that is datainformed • Strategy ideation • Unify approach and vision of enrollment management • Remain data-informed and seek ways to further enhance and integrate data and data collection into the planning processes • Maintain enrollment and seek to maximize your profile • Diversify your campus profile • Provide long-term, practical, and tangible business/action plans that are executable
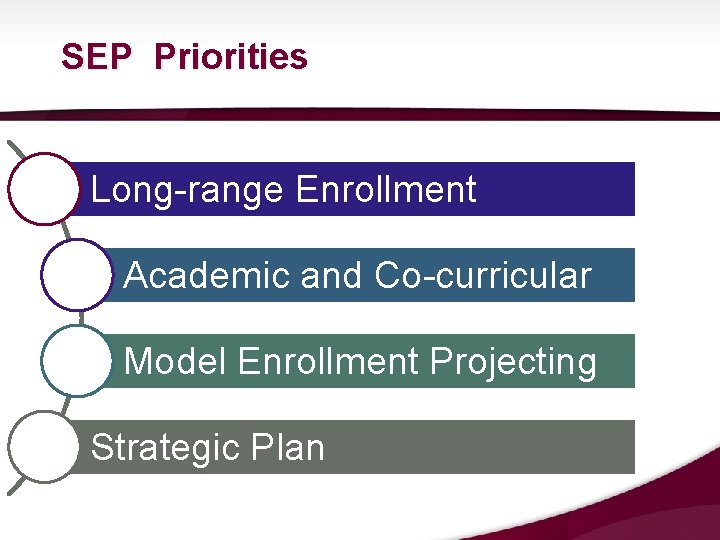
SEP Priorities Long-range Enrollment Academic and Co-curricular Model Enrollment Projecting Strategic Plan
4 Characteristics of a Successful Strategic Enrollment Plan
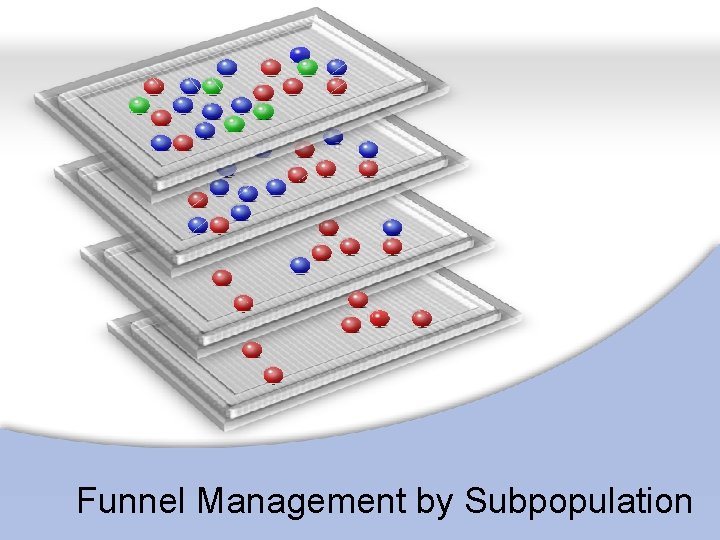
Funnel Management by Subpopulation
Strong Institutional Buy-in
Data-Informed
Data-themed SWOT Analysis
Creates a Sense of Urgency
Provide Planning Assumptions
Defined Populations
Goal, Objectives, and Action Strategies Goals
A solid resource/fiscal plan to support each strategy, goal, and objective
Living Plan