The Impact of Imprisonment on Crime Trends Richard


 – Predictors")


- Slides: 23
The Impact of Imprisonment on Crime Trends Richard Rosenfeld University of Missouri – St. Louis *This research was supported by a grant from the Harry Frank Guggenheim Foundation
Overview • Policymakers’ concern with impact of imprisonment reductions on crime • Effect of imprisonment reductions on crime cannot be reliably evaluated apart from effects of other conditions that affect crime rates • Modeling national crime rates (1980 – 2016) • Imprisonment effects on crime counterbalanced by those of other factors • Five-year crime projections • State variation in prison effects on crime rates
Rationale • Concern about increasing crime rates impedes continued success in reducing mass incarceration • Policymakers need evidence of how reducing imprisonment will affect crime – now and in the future • We present a policy model to guide decision making
The Model • A reliable model must meet two conditions – Explains crime trends with a high degree of accuracy – Contains contributing factors in addition to imprisonment • Time series models for national violent and property crime rates (1980 – 2016) – Violent crime: imprisonment rate, inflation rate, teen birth rate, divorce rate, %18 -24 – Property crime: imprisonment rate, inflation rate, % college or more, % manufacturing, %18 -24
Violent Crime Property Crime
Violent Crime Imprisonment Property Crime
Results
Violent Crime Results
Property Crime Results
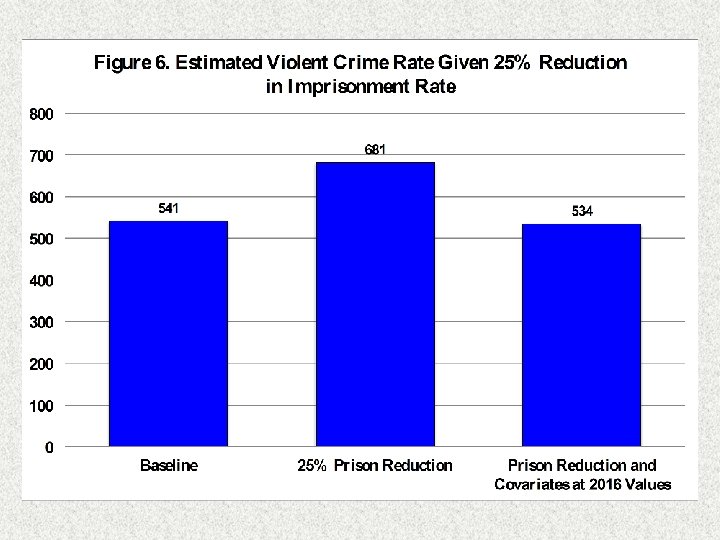
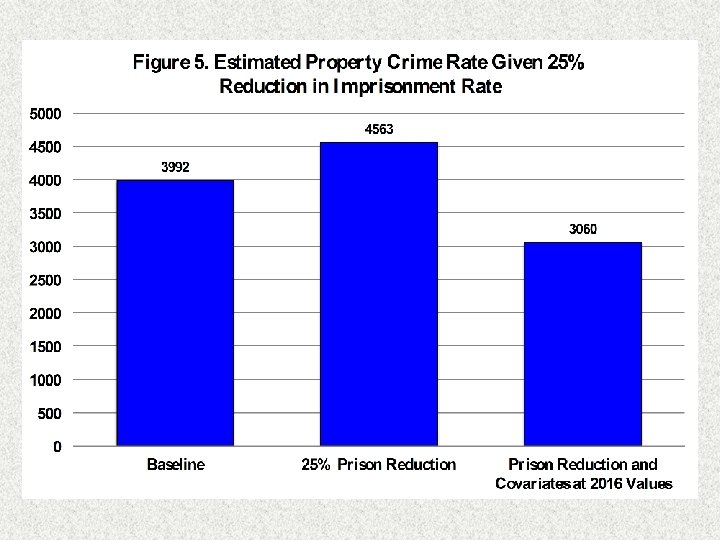
What Would Happen to Crime Rates if Imprisonment Were Reduced by 25%?
Projecting Crime Rates • Using the models to project crime rates five years ahead (2017 -2021) • Mid, max, and min projections – Mid = 2012 -2016 trend in predictors extended to 2021 (2017 values are known) – Max = Predictors remain at 2017 values to 2021 – Min = Predictors at 2021 values throughout
Violent Crime Projections
Property Crime Projections
Projection Results • Violent crime rate “mid” projection flat through 2021 • Property crime rate “mid” projection decreasing through 2021 • Violent crime rate projection more accurate – 2018 projected violent crime rate = 382 per 100 k; observed rate = 369 per 100 k – 2018 projected property crime rate = 2544 per 100 k; observed rate = 2120 per 100 k – Property crime projections do not account for migration of property crime to the Internet 1 1 See the FBI’s 2019 Internet Crime Report (https: //pdf. ic 3. gov/2019_IC 3 Report. pdf)
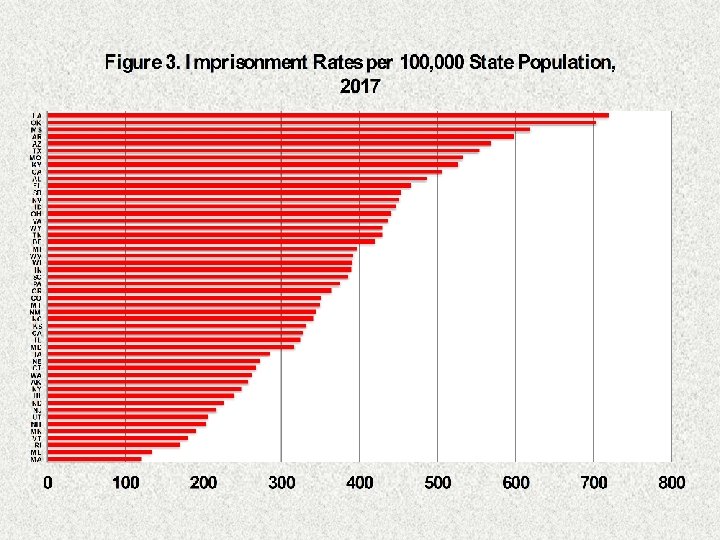
Limitations • Sentencing policy set at the state level; policy models should be based on state-level data • Imprisonment statistically inseparable from other correctional sectors (probation, parole, jail) – state-level data may help
Some Preliminary State-Level Results
Where Does Imprisonment Reduce Violent Crime? • State-level Model (1980 – 2018) – Predictors • Violent crime rate in previous year • Imprisonment rate in previous year • Results – On average, the higher the imprisonment rate, the lower the violent crime rate – Substantial variation across the states in the effect of imprisonment on violent crime • Significant effect in 27 states, no effect in 23 states
Imprisonment Effect No Imprisonment Effect
Effect of Imprisonment on Violent Crime No Greater in States with Higher Imprisonment Rates
Next Steps • Build policy models for crime trends in key states – Those with and without sentencing and imprisonment reforms – Those where imprisonment does and does not reduce violent crime • Distinguish the effects of imprisonment on crime rates from those of jail, probation, and parole