
THE HYPERSPECTRAL IMAGING APPROACH Giuseppe Bonifazi Workshop ACTIONS
THE HYPERSPECTRAL IMAGING APPROACH • Giuseppe Bonifazi • Workshop
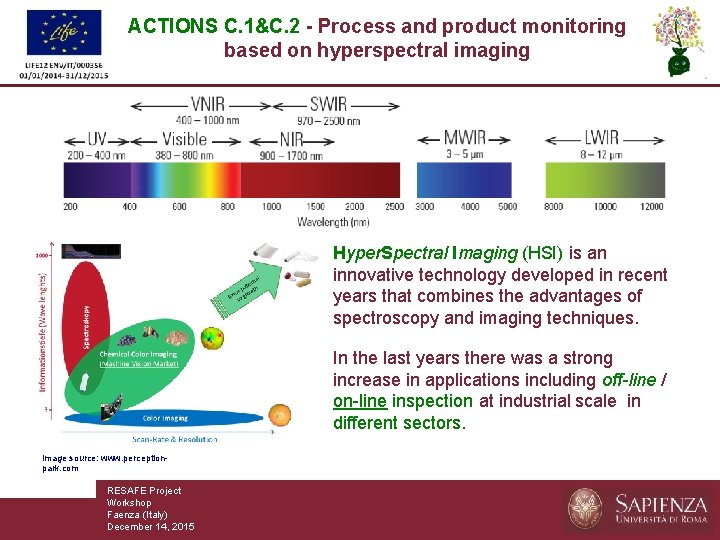
ACTIONS C. 1&C. 2 - Process and product monitoring based on hyperspectral imaging Hyper. Spectral Imaging (HSI) is an innovative technology developed in recent years that combines the advantages of spectroscopy and imaging techniques. In the last years there was a strong increase in applications including off-line / on-line inspection at industrial scale in different sectors. Image source: www. perceptionpark. com RESAFE Project Workshop Faenza (Italy) December 14, 2015
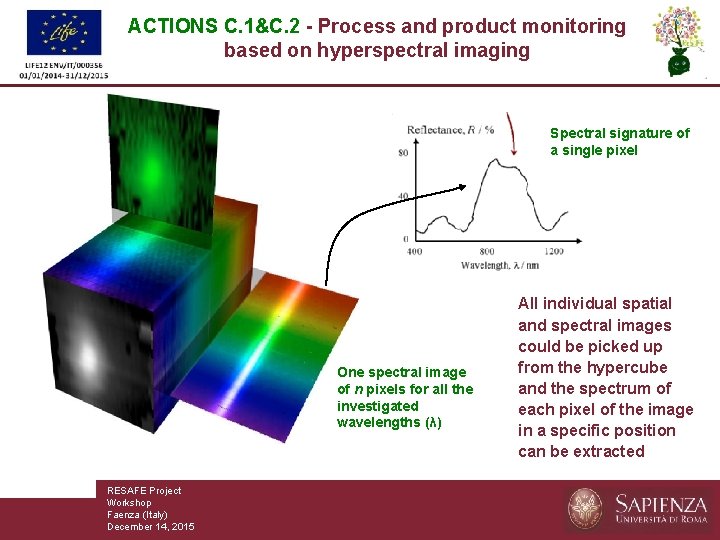
ACTIONS C. 1&C. 2 - Process and product monitoring based on hyperspectral imaging Spectral signature of a single pixel One spectral image of n pixels for all the investigated wavelengths (λ) RESAFE Project Workshop Faenza (Italy) December 14, 2015 All individual spatial and spectral images could be picked up from the hypercube and the spectrum of each pixel of the image in a specific position can be extracted
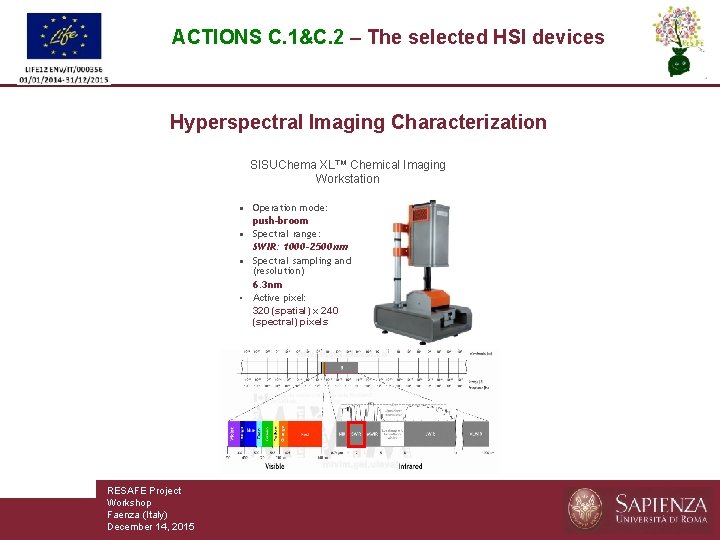
ACTIONS C. 1&C. 2 – The selected HSI devices Hyperspectral Imaging Characterization SISUChema XL™ Chemical Imaging Workstation • Operation mode: push-broom • Spectral range: SWIR: 1000 -2500 nm • Spectral sampling and (resolution) 6. 3 nm • Active pixel: 320 (spatial) x 240 (spectral) pixels RESAFE Project Workshop Faenza (Italy) December 14, 2015
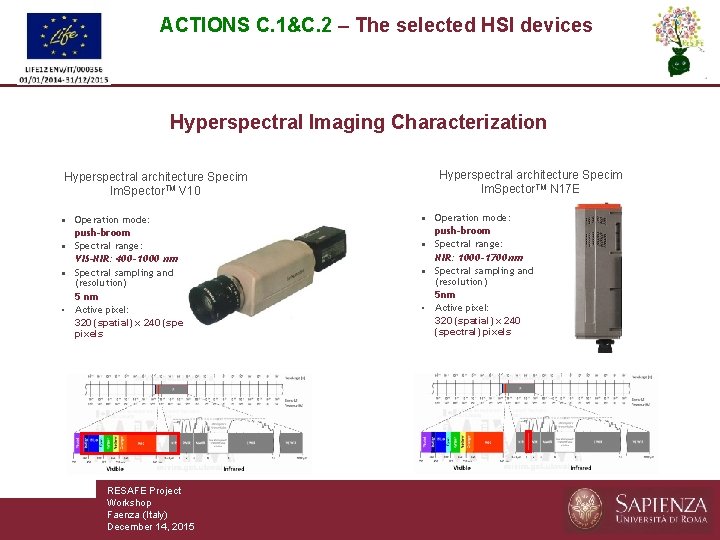
ACTIONS C. 1&C. 2 – The selected HSI devices Hyperspectral Imaging Characterization Hyperspectral architecture Specim Im. Spector. TM V 10 • Operation mode: push-broom • Spectral range: VIS-NIR: 400 -1000 nm • Spectral sampling and (resolution) 5 nm • Active pixel: 320 (spatial) x 240 (spectral) pixels RESAFE Project Workshop Faenza (Italy) December 14, 2015 Hyperspectral architecture Specim Im. Spector. TM N 17 E • Operation mode: push-broom • Spectral range: NIR: 1000 -1700 nm • Spectral sampling and (resolution) 5 nm • Active pixel: 320 (spatial) x 240 (spectral) pixels
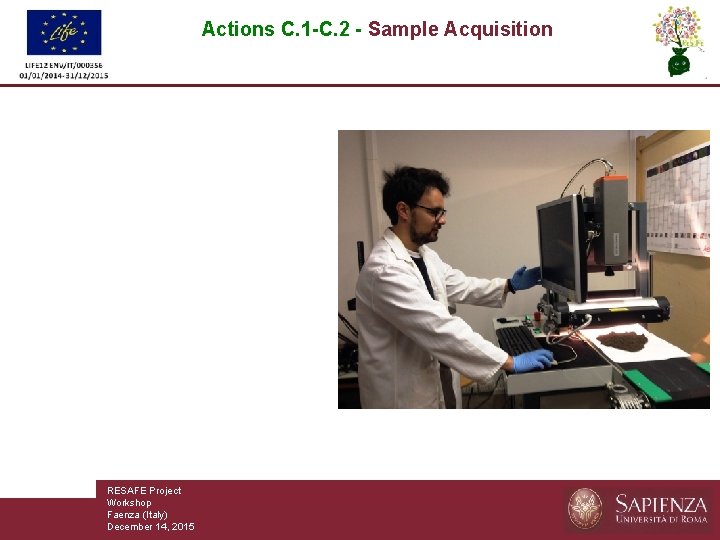
Actions C. 1 -C. 2 - Sample Acquisition ACTION C. 1: Hyper. Spectral Imaging (HSI) Characterization RESAFE Project Workshop Faenza (Italy) December 14, 2015
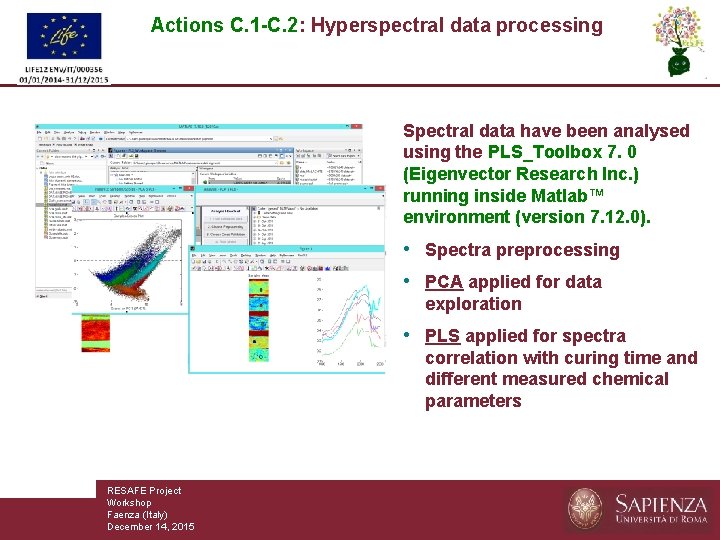
Actions C. 1 -C. 2: Hyperspectral data processing Spectral data have been analysed using the PLS_Toolbox 7. 0 (Eigenvector Research Inc. ) running inside Matlab™ environment (version 7. 12. 0). • Spectra preprocessing • PCA applied for data exploration • PLS applied for spectra correlation with curing time and different measured chemical parameters RESAFE Project Workshop Faenza (Italy) December 14, 2015
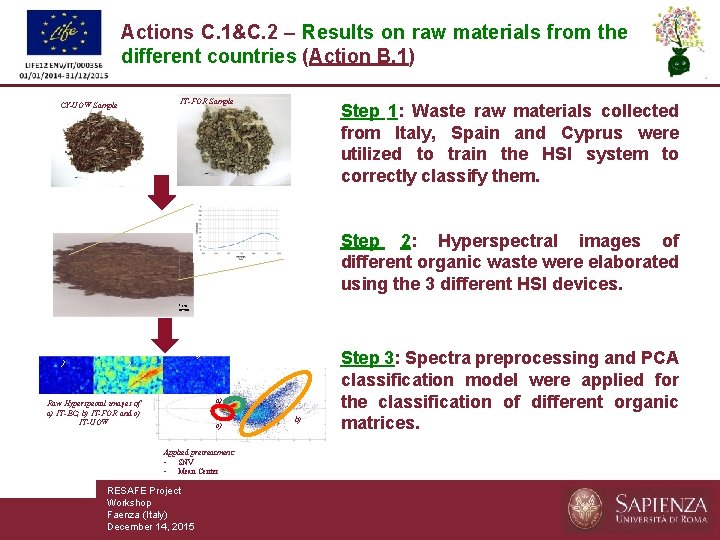
Actions C. 1&C. 2 – Results on raw materials from the different countries (Action B. 1) IT-FOR Sample CY-UOW Sample Step 1: Waste raw materials collected from Italy, Spain and Cyprus were utilized to train the HSI system to correctly classify them. Step 2: Hyperspectral images of different organic waste were elaborated using the 3 different HSI devices. 1 cm a ) b ) c) a) Raw Hyperspectal images of a) IT-BC; b) IT-FOR and c) IT-UOW c) Applied pretreatment: - SNV - Mean Center RESAFE Project Workshop Faenza (Italy) December 14, 2015 b) Step 3: Spectra preprocessing and PCA classification model were applied for the classification of different organic matrices.
Actions C. 1&C. 2 – Results on raw materials from the different countries (Action B. 1) Raw materials: Italian samples Reflectance spectra (1000 -1700 nm) RESAFE Project Workshop Faenza (Italy) December 14, 2015
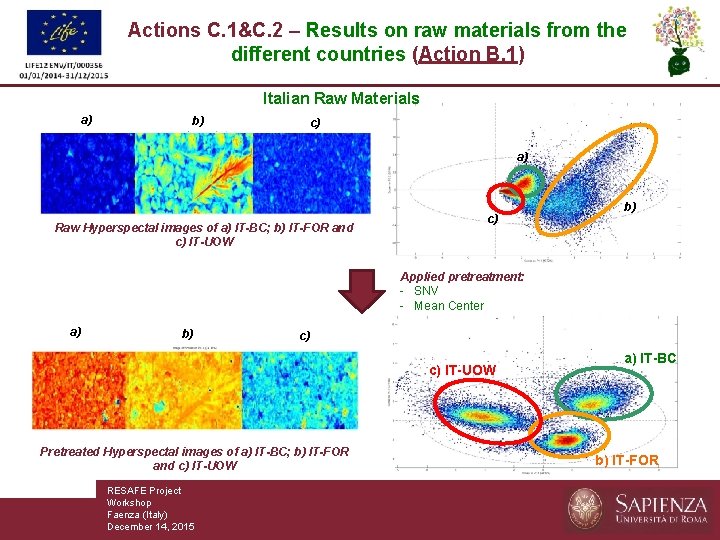
Actions C. 1&C. 2 – Results on raw materials from the different countries (Action B. 1) Italian Raw Materials a) b) c) a) Raw Hyperspectal images of a) IT-BC; b) IT-FOR and c) IT-UOW c) b) Applied pretreatment: - SNV - Mean Center a) b) c) c) IT-UOW Pretreated Hyperspectal images of a) IT-BC; b) IT-FOR and c) IT-UOW RESAFE Project Workshop Faenza (Italy) December 14, 2015 a) IT-BC b) IT-FOR
Actions C. 1&C. 2 – Results on raw materials from the different countries (Action B. 1) PCA score plots (PC 1 vs. PC 2) related to the different FOR samples coming from Italy, Spain and Cyprus acquired in the NIR (1000 -1650 nm) wavelength field. RESAFE Project Workshop Faenza (Italy) December 14, 2015
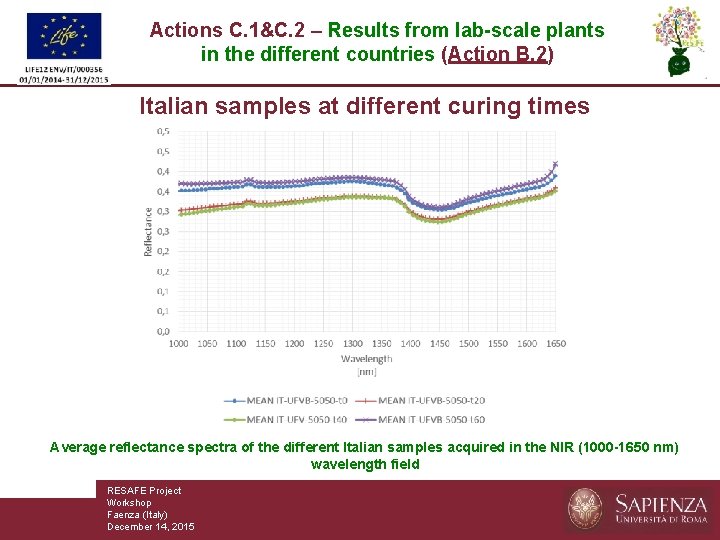
Actions C. 1&C. 2 – Results from lab-scale plants in the different countries (Action B. 2) Italian samples at different curing times Average reflectance spectra of the different Italian samples acquired in the NIR (1000 -1650 nm) wavelength field RESAFE Project Workshop Faenza (Italy) December 14, 2015
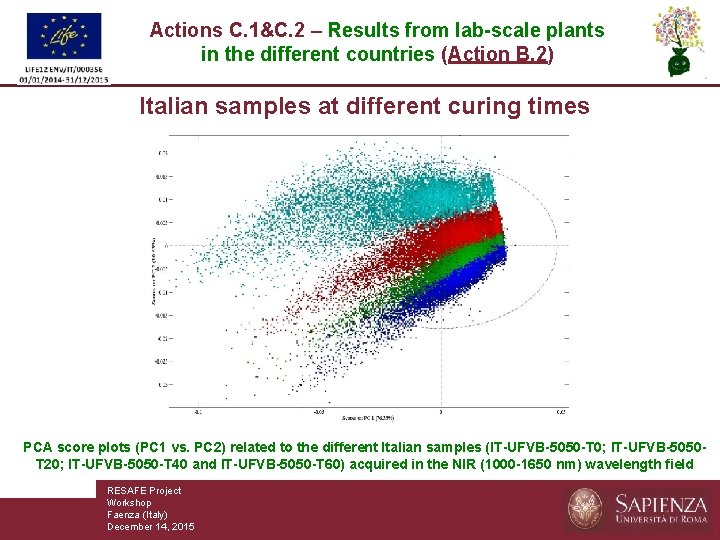
Actions C. 1&C. 2 – Results from lab-scale plants in the different countries (Action B. 2) Italian samples at different curing times PCA score plots (PC 1 vs. PC 2) related to the different Italian samples (IT-UFVB-5050 -T 0; IT-UFVB-5050 T 20; IT-UFVB-5050 -T 40 and IT-UFVB-5050 -T 60) acquired in the NIR (1000 -1650 nm) wavelength field RESAFE Project Workshop Faenza (Italy) December 14, 2015
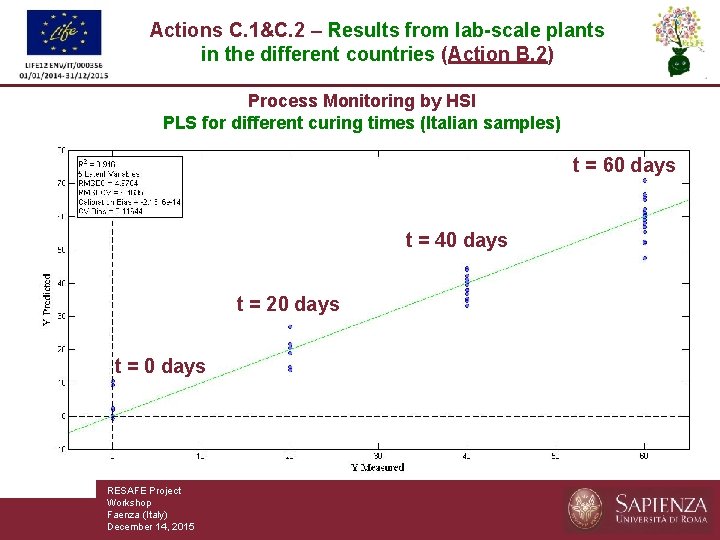
Actions C. 1&C. 2 – Results from lab-scale plants in the different countries (Action B. 2) Process Monitoring by HSI PLS for different curing times (Italian samples) t = 60 days t = 40 days t = 20 days t = 0 days RESAFE Project Workshop Faenza (Italy) December 14, 2015
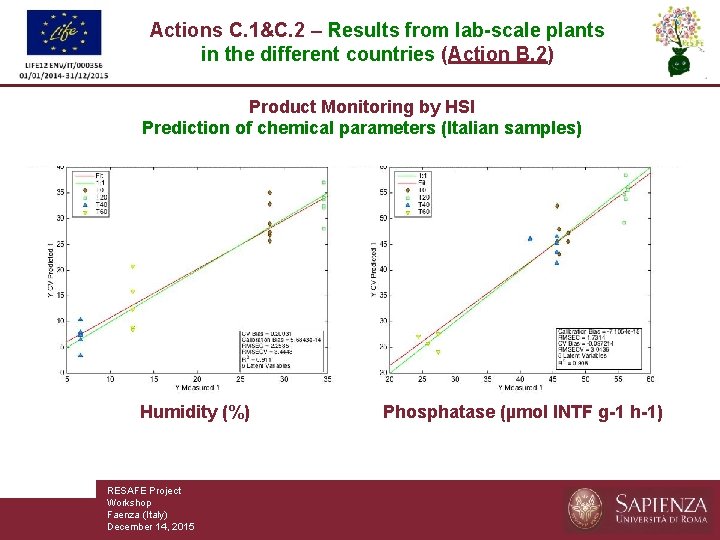
Actions C. 1&C. 2 – Results from lab-scale plants in the different countries (Action B. 2) Product Monitoring by HSI Prediction of chemical parameters (Italian samples) Humidity (%) RESAFE Project Workshop Faenza (Italy) December 14, 2015 Phosphatase (µmol INTF g-1 h-1)
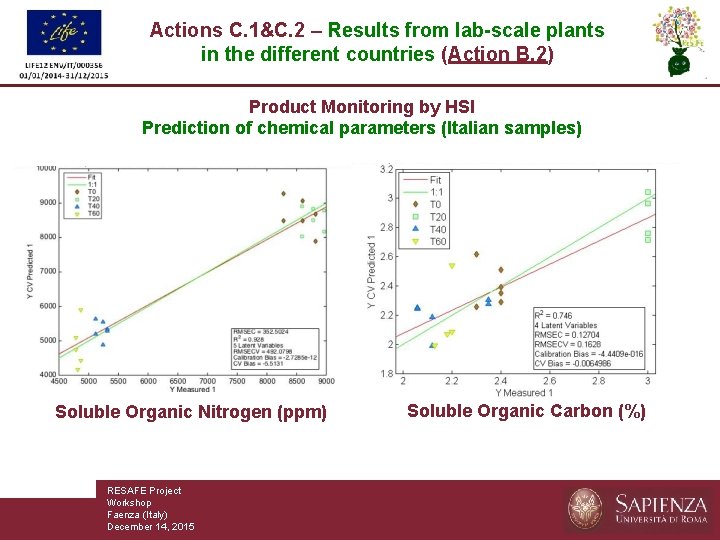
Actions C. 1&C. 2 – Results from lab-scale plants in the different countries (Action B. 2) Product Monitoring by HSI Prediction of chemical parameters (Italian samples) Soluble Organic Nitrogen (ppm) RESAFE Project Workshop Faenza (Italy) December 14, 2015 Soluble Organic Carbon (%)
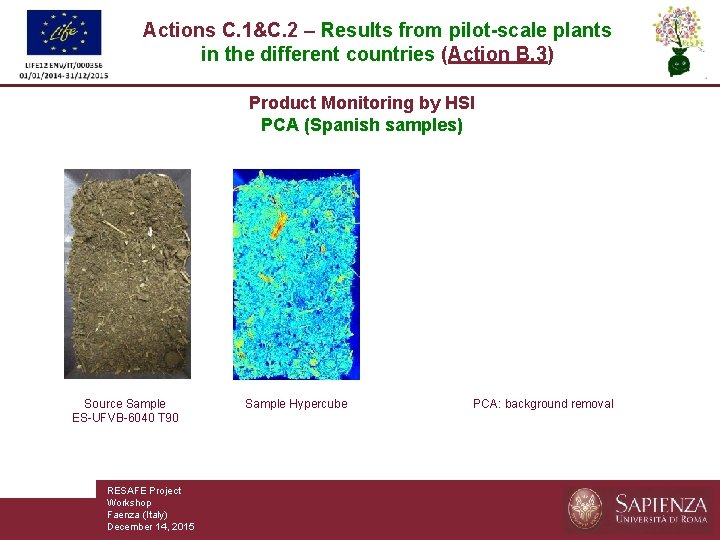
Actions C. 1&C. 2 – Results from pilot-scale plants in the different countries (Action B. 3) Product Monitoring by HSI PCA (Spanish samples) Source Sample ES-UFVB-6040 T 90 RESAFE Project Workshop Faenza (Italy) December 14, 2015 Sample Hypercube PCA: background removal
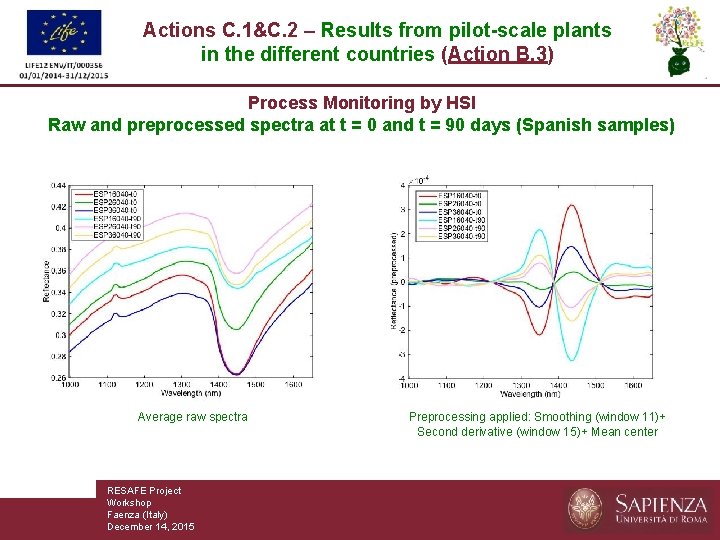
Actions C. 1&C. 2 – Results from pilot-scale plants in the different countries (Action B. 3) Process Monitoring by HSI Raw and preprocessed spectra at t = 0 and t = 90 days (Spanish samples) Average raw spectra RESAFE Project Workshop Faenza (Italy) December 14, 2015 Preprocessing applied: Smoothing (window 11)+ Second derivative (window 15)+ Mean center
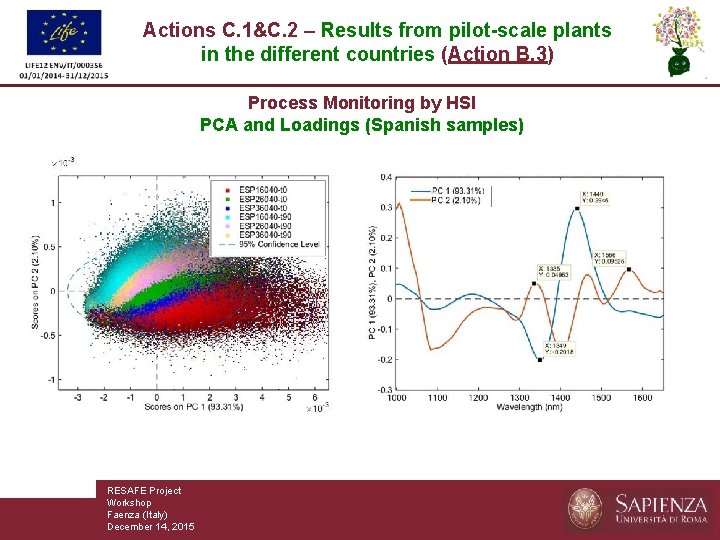
Actions C. 1&C. 2 – Results from pilot-scale plants in the different countries (Action B. 3) Process Monitoring by HSI PCA and Loadings (Spanish samples) RESAFE Project Workshop Faenza (Italy) December 14, 2015
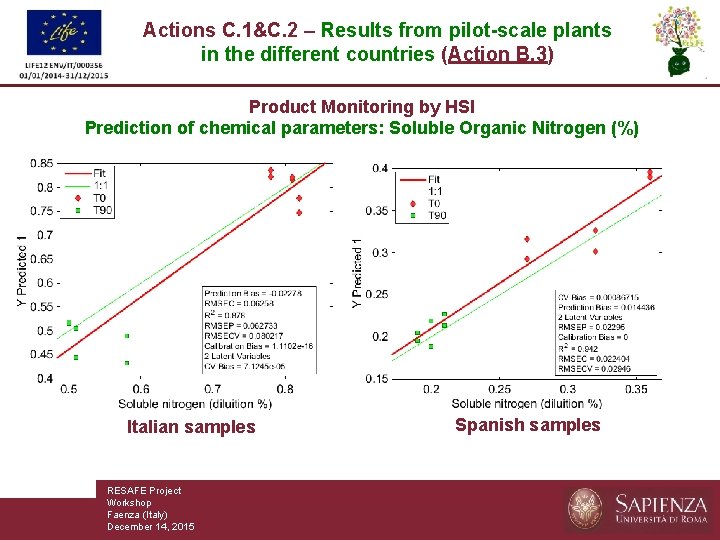
Actions C. 1&C. 2 – Results from pilot-scale plants in the different countries (Action B. 3) Product Monitoring by HSI Prediction of chemical parameters: Soluble Organic Nitrogen (%) Italian samples RESAFE Project Workshop Faenza (Italy) December 14, 2015 Spanish samples
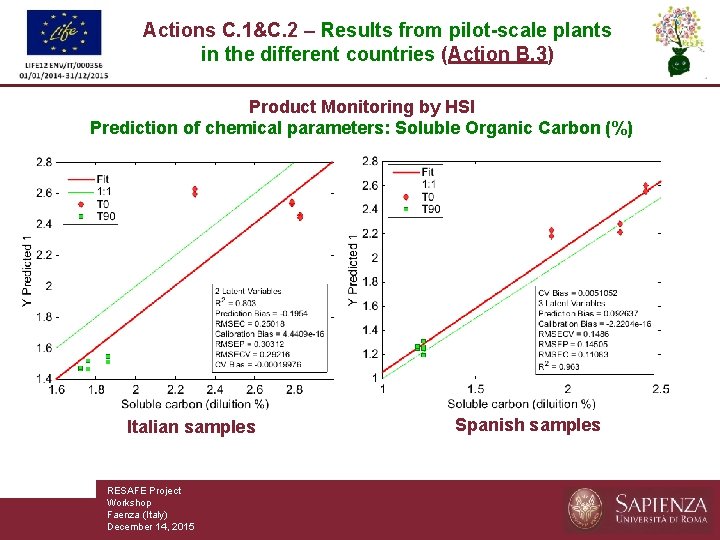
Actions C. 1&C. 2 – Results from pilot-scale plants in the different countries (Action B. 3) Product Monitoring by HSI Prediction of chemical parameters: Soluble Organic Carbon (%) Italian samples RESAFE Project Workshop Faenza (Italy) December 14, 2015 Spanish samples
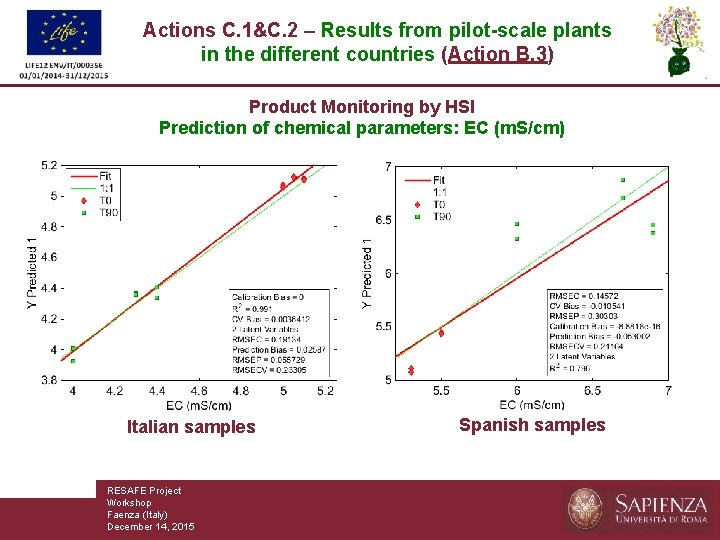
Actions C. 1&C. 2 – Results from pilot-scale plants in the different countries (Action B. 3) Product Monitoring by HSI Prediction of chemical parameters: EC (m. S/cm) Italian samples RESAFE Project Workshop Faenza (Italy) December 14, 2015 Spanish samples
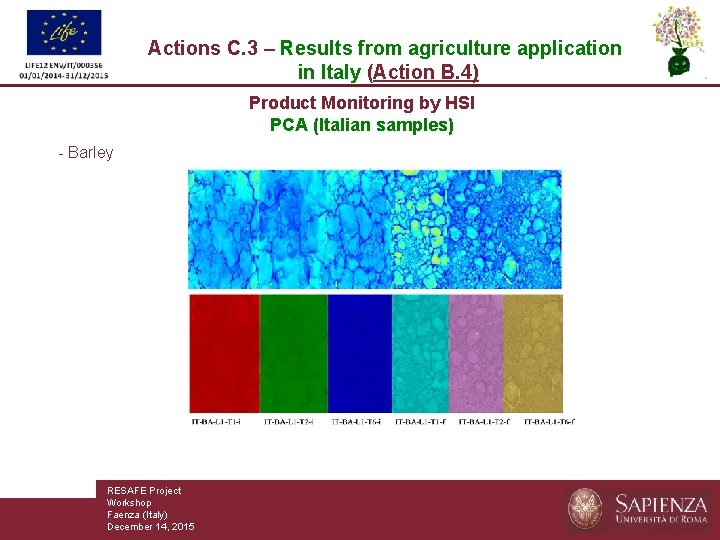
Actions C. 3 – Results from agriculture application in Italy (Action B. 4) Product Monitoring by HSI PCA (Italian samples) - Barley RESAFE Project Workshop Faenza (Italy) December 14, 2015
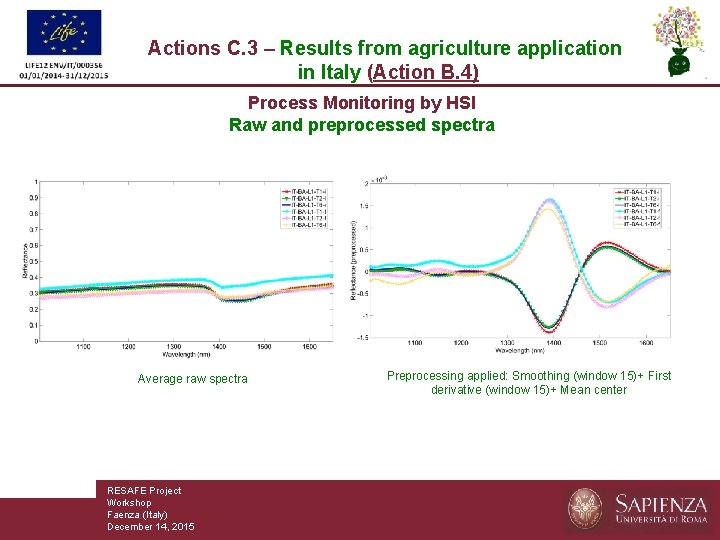
Actions C. 3 – Results from agriculture application in Italy (Action B. 4) Process Monitoring by HSI Raw and preprocessed spectra Average raw spectra RESAFE Project Workshop Faenza (Italy) December 14, 2015 Preprocessing applied: Smoothing (window 15)+ First derivative (window 15)+ Mean center
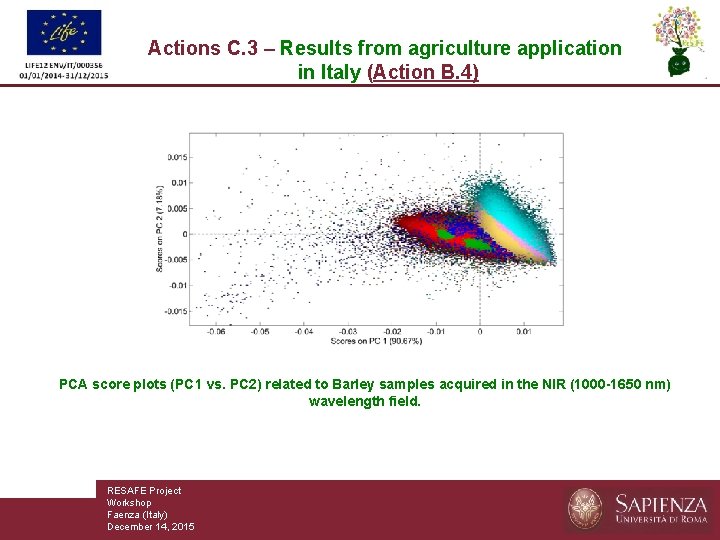
Actions C. 3 – Results from agriculture application in Italy (Action B. 4) PCA score plots (PC 1 vs. PC 2) related to Barley samples acquired in the NIR (1000 -1650 nm) wavelength field. RESAFE Project Workshop Faenza (Italy) December 14, 2015
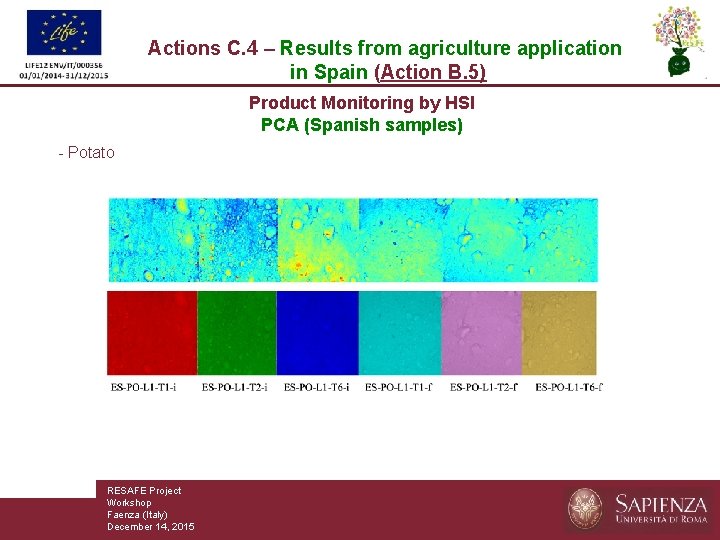
Actions C. 4 – Results from agriculture application in Spain (Action B. 5) Product Monitoring by HSI PCA (Spanish samples) - Potato RESAFE Project Workshop Faenza (Italy) December 14, 2015
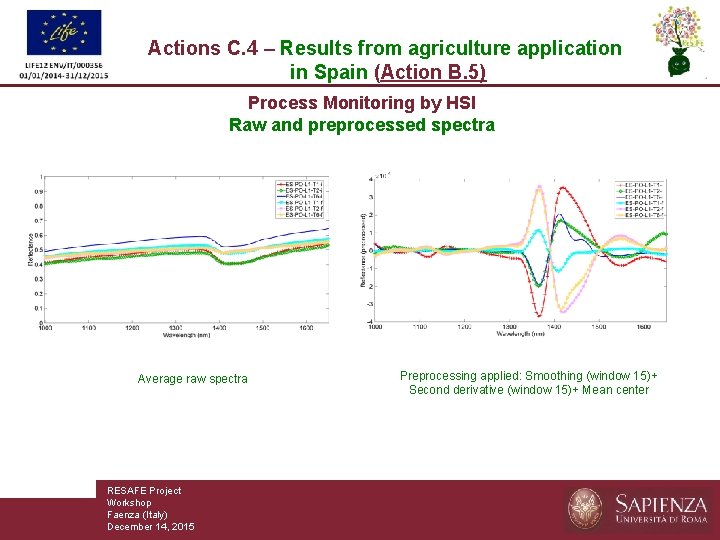
Actions C. 4 – Results from agriculture application in Spain (Action B. 5) Process Monitoring by HSI Raw and preprocessed spectra Average raw spectra RESAFE Project Workshop Faenza (Italy) December 14, 2015 Preprocessing applied: Smoothing (window 15)+ Second derivative (window 15)+ Mean center
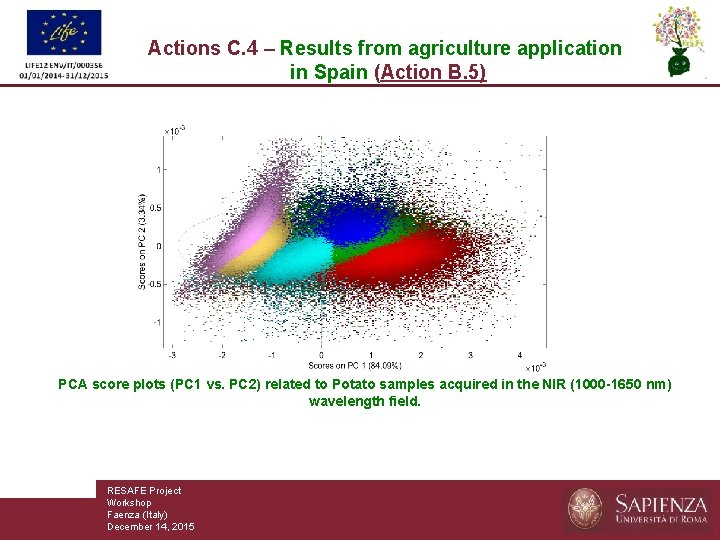
Actions C. 4 – Results from agriculture application in Spain (Action B. 5) PCA score plots (PC 1 vs. PC 2) related to Potato samples acquired in the NIR (1000 -1650 nm) wavelength field. RESAFE Project Workshop Faenza (Italy) December 14, 2015
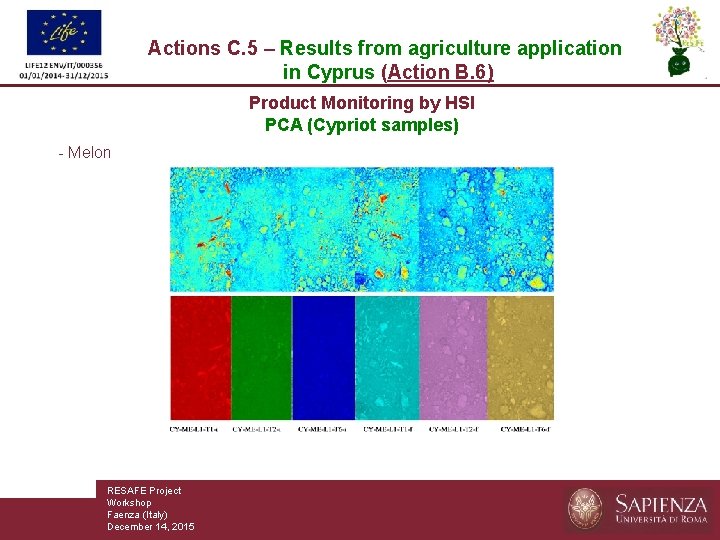
Actions C. 5 – Results from agriculture application in Cyprus (Action B. 6) Product Monitoring by HSI PCA (Cypriot samples) - Melon RESAFE Project Workshop Faenza (Italy) December 14, 2015
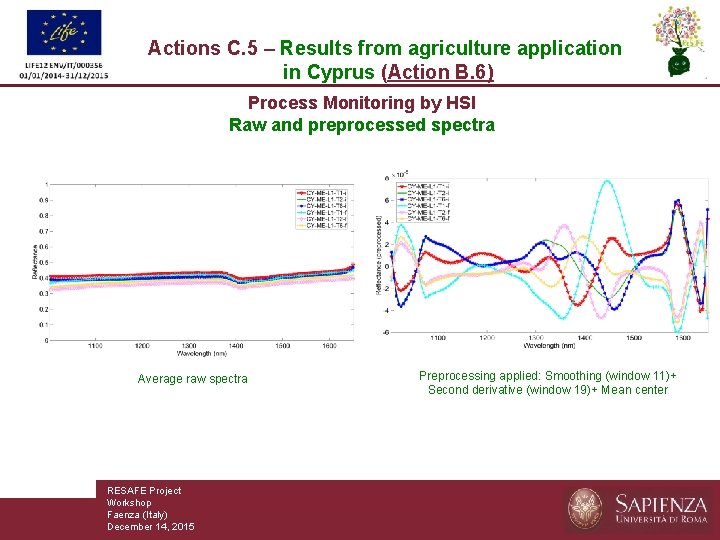
Actions C. 5 – Results from agriculture application in Cyprus (Action B. 6) Process Monitoring by HSI Raw and preprocessed spectra Average raw spectra RESAFE Project Workshop Faenza (Italy) December 14, 2015 Preprocessing applied: Smoothing (window 11)+ Second derivative (window 19)+ Mean center
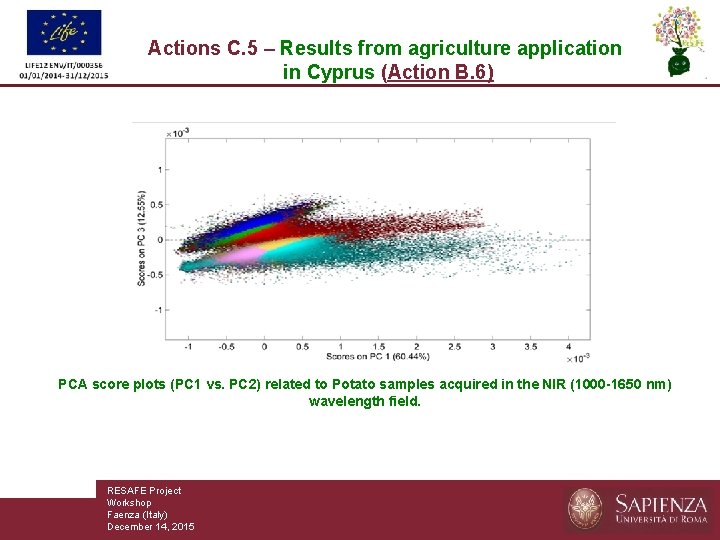
Actions C. 5 – Results from agriculture application in Cyprus (Action B. 6) PCA score plots (PC 1 vs. PC 2) related to Potato samples acquired in the NIR (1000 -1650 nm) wavelength field. RESAFE Project Workshop Faenza (Italy) December 14, 2015
Conclusions Actions B. 1&C. 1 -C. 2 The HSI approach allowed to outline the difference existing among the investigated raw material samples both in terms of composition (i. e. UOW, FOR and BC) and origin (i. e. : Italy, Spain and Cyprus), with the only exception of Italian and Spanish BC. Actions B. 2&C. 1 -C. 2 Good correlation between spectral behavior in the NIR wavelength range of the different collected samples from the lab-scale plants in the different countries and curing time and the main measured chemical parameters (humidity, soluble carbon, soluble nitrogen, and phosphatase) were obtained. Actions B. 3&C. 1 -C. 2 Good correlation between spectral behavior in the NIR wavelength range of the different collected samples from the pilot-scale plants in the different countries and the main measured chemical parameters (soluble carbon, soluble nitrogen and electrical conductivity) were obtained. RESAFE Project Workshop Faenza (Italy) December 14, 2015
Conclusions Actions B. 4&C. 3 The HSI approach allowed to outline the difference crops existing from different thesis in the agriculture application in Italy. Actions B. 5&C. 4 The HSI approach allowed to outline the difference crops existing from different thesis in the agriculture application in Spain. Actions B. 6&C. 5 The HSI approach allowed to outline the difference crops existing from different thesis in the agriculture application in Cyprus. RESAFE Project Workshop Faenza (Italy) December 14, 2015
- Slides: 33