THE HOT AND WET CLIMATE OF THE HUMID


 minima • Highest temperature and month")


 Congo (Lat - 0 o N) Moscow (Lat -")

- Slides: 11
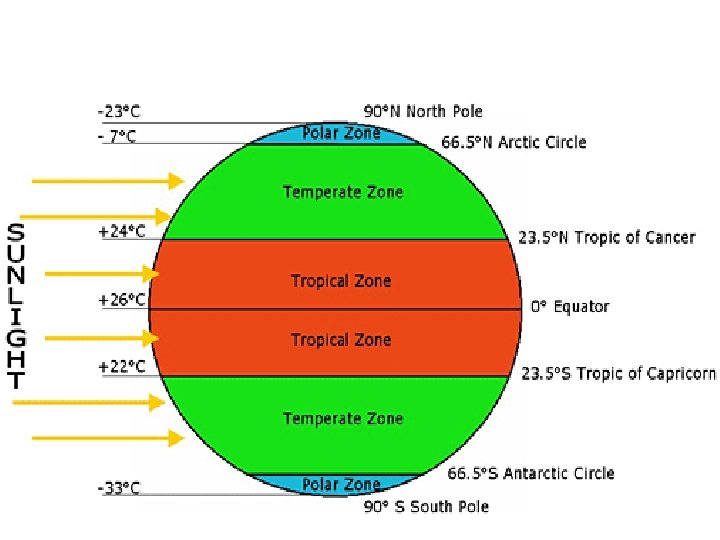
THE HOT AND WET CLIMATE OF THE HUMID TROPICS Hot – Average temperatures of >27 o. C (Min 25 o. C, Max 33 o. C) Temperature – the degree of heat or cold Wet – Heavy Rainfall (Total Annual Rainfall >1000 mm, to a max of 2400 mm) Precipitation – the total amount of rainfall for a month or year.
CLIMATE GRAPH
How to make sense of a climograph? 1. Read the title (usually a name of a city). It will give you an indication of the location of the place. (latitude) 2. Study the vertical scale [Tempt (o. C) is on the right side of the climograph and amount of precipitation (mm) on the left]. 3. Study the horizontal scale: • Temperature = Line graph • Precipitation = Bar graph
4. Temperature: • Lowest temperature and month (minima) minima • Highest temperature and month (maxima) maxima • Calculate the mean/average annual temperature (is it high/moderate/low? ) • Calculate the annual temperature range (max – min tempt) e. g 28. 5 – 26 = 2. 5 o. C • Distribution of temperature throughout the year? [Uniform = high temperatures every month or seasonal = high or low temperatures for certain months of the year]
5. Precipitation • Calculate the total annual precipitation • Describe the distribution of precipitation [is it evenly distributed /seasonal, any distinct wet or dry months, what is the maximum precipitation and month, minimum precipitation and month] Temperature / Precipitation High Moderate Low Mean Annual Temperature (o. C) >20 10 - 20 <10 >1000 250 - 1000 <250 Total Annual Precipitation (mm)
6. Interpret the data by making general statements about the temperature and precipitation. e. g. Hot and wet throughout the year, seasonal patterns - cool and dry seasons, hot and dry, warm and wet, cold and dry based on the data analyzed.
Climate graphs of 2 cities
X Moscow Tropic of Cancer Equator X Congo Tropic of Capricorn Locate on your map Moscow and Congo
Comparing Climate Graphs Differences (Temperature) Congo (Lat - 0 o N) Moscow (Lat - 55 o N) Average Tempt = 25. 4 o. C 5 o. C Uniform annual temperature Seasonal Summer (J, J, A) Max = 17 o. C, Winter (D, J, F )Min = -9 o. C Temperature Range small 2 o. C 36 o. C Hot Cold Differences (Precipitation) Total Annual = 1804 mm 688 mm Distribution = high rainfall throughout the Has precipitation year round. Seasonal year precipitation – higher rainfall in summer and lower precipitation in winter Wet Moderately wet
How to write a comparison statement Example of a Statement to highlight the differences in climate between Kisangani and Moscow: Kisangani has an mean annual temperature of 25. 4 o. C while Moscow has a low mean annual temperature of 5 o. C. While Kisangani has a uniform high temperature throughout the year, Moscow experiences the 4 seasons, experiencing low temperatures of -9 o. C in winter and 18 o. C in summer.