The Greenhouse Gas Connection to Sustainable Resource Management

The Greenhouse Gas Connection to Sustainable Resource Management

In This Lesson By the end of this lesson students will be able to: • (Knowledge) Identify the fundamental principles and practices relating to SRM greenhouse gas emissions and reductions • (Knowledge) Identify market impacts for recovered products and material and the associated GHG reduction impacts • (Comprehension) Explain why communities are adopting community greenhouse gas protocols including SRM • (Knowledge) Identify tools and metrics to measure and compare GHG impacts to sustainable management programs

Intergovernmental Panel on Climate Change

Greenhouse Gases and Global Warming Potentials
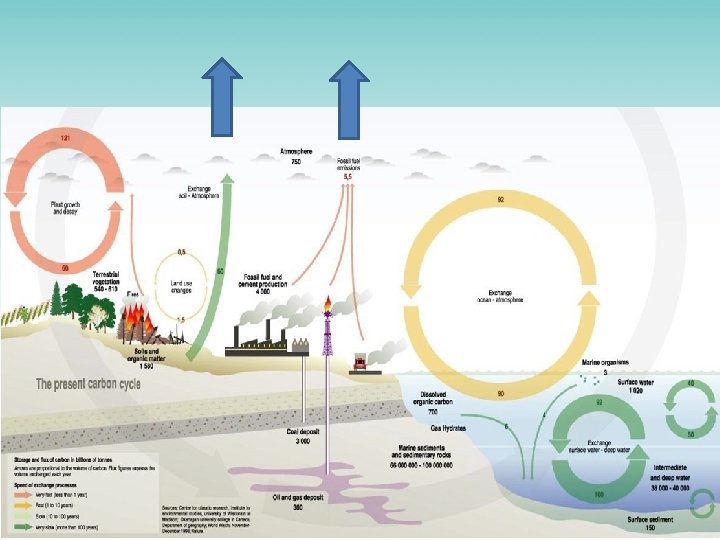

GHG Emission Sources And Sinks

Lifecycle Assessment: Principles and Practice USEPA, 2006

WASTE management vs. MATERIALS management ove Rec l ry a pos Dis Product Lifecycle http: //www. epa. gov/smm/ vision. htm

RECYCLING AND MATERIALS MANAGEMENT ove Rec l ry a pos Dis Rec ycle use Re Repair
 • WARM can quantify and communicate GHG Benefits – Metric")
Waste Reduction Model (WARM) • WARM can quantify and communicate GHG Benefits – Metric tons of Carbon Equivalent (MTCE) – Metric Tons of Carbon Dioxide Equivalent – (MTCO 2 E) – Energy benefits – British Thermal Units (BTU) www. epa. gov/warm

WARM Background • WARM compares the emissions and offsets resulting from a material in a baseline and an alternative management pathway in order to provide decision-makers with comparative emission results. • WARM does not include emissions from the use phase of a product’s life, since use does not have an effect on the waste management emissions of a product.

WARM Formula • The general formula for net GHG emissions for each scenario modeled in WARM: - Net GHG emissions = Gross manufacturing GHG emissions (Increase in carbon stocks + Avoided utility GHG emissions)
")
Materials Management Decisions Affecting GHG Reduction: • Energy consumption (specifically combustion of fossil fuels) and the resulting GHG emissions associated with material extraction, manufacturing, transporting, and end-of-life management of the material or product. • Non-energy-related manufacturing emissions, such as the carbon dioxide (CO 2) released when limestone used in steel manufacturing is converted to lime, or the perfluorocarbons (PFCs) generated during the aluminum smelting process.
 emissions from decomposition of")
Materials Management Decisions Affecting GHG Reduction: • Methane (CH 4) emissions from decomposition of organic materials in landfills. • CO 2 and nitrous oxide (N 2 O) emissions from waste combustion. • Carbon sequestration and storage, which refer to natural or manmade processes that remove carbon from the atmosphere and store it for long periods or permanently.

Recycling and Composting Emissions Protocol: July 2013 http: //www. icleiusa. org/tools/ghg-protocol/recycling-and-composting-emissions-protocol

Relationships to WARM • Use WARM factors, EXCEPT � Carbon storage only in forests � 0. 75 landfill gas capture (consistent with community protocol) � Includes compost emission reduction for chemical fertilizer displacement

Overall Reductions For Avoided Disposal, by Disposal Facility Type From using Landfill with recycled inputs instead no gas collection of virgin inputs (mixed recyclables) -2. 8 -1. 75 Landfill with gas collection but no energy recovery -0. 47 Landfill with Combustion gas facility collection and energy recovery -0. 28 0. 42 All reductions are shown as MTCO 2 E (metric tons of carbon dioxide equivalent

Calculating GHG Emissions • T = tons • EF = emission factor • MTCO 2 E = Metric tons carbon dioxide equivalent • T * EF = MTCO 2 E

http: //www. arb. ca. gov/cc/protocols/localgov/pubs/recycling_method. pdf
 Material Total Upstream Remanufacture Emission Transportation Reductions (a)")
Recycling Emission Reduction Factors (Table 11) Material Total Upstream Remanufacture Emission Transportation Reductions (a) Emissions (b) Recycling Forest Carbon Efficiency RERF Seq. (c) (d) (a-b+c) *d Aluminum 14 0. 07 0 0. 93 12. 9 Steel 1. 7 0. 16 0 0. 98 1. 5 Glass 0. 2 0. 02 0 0. 88 0. 2 HDPE 1. 1 0. 09 0 0. 77 0. 8 2 0. 15 0 0. 77 1. 4 Corrugated cardboard 1. 3 0. 1 4. 2 0. 93 5 Magazines/3 rd class mail 0. 1 0. 5 0. 67 0. 3 1 0. 1 2. 9 0. 89 3. 4 Office paper 2. 4 0. 1 4. 8 0. 6 4. 3 Telephone books 1. 2 0. 1 2. 9 0. 67 2. 7 N/A N/A 0. 21 1. 7 0. 13 0 0. 77 1. 2 PET Newspaper Dimensional lumber Mixed Plastics

http: //www. arb. ca. gov/cc/protocols/localgov/pubs/compost_method. pdf
 Emissions Emission type Emission (MTCO 2 E/ton of feedstock)")
Compost Emission Factors (Table 8) Emissions Emission type Emission (MTCO 2 E/ton of feedstock) Transportation emissions (Te) 0. 008 Process emissions (Pe) 0. 008 Fugitive CH 4 emissions (Fe) 0. 078 Fugitive N 2 O emissions (Fe) Total 0. 025 0. 119
 Emission reductions Emission reduction type Increased Soil Carbon")
Compost Emission Reduction Factors (Table 8) Emission reductions Emission reduction type Increased Soil Carbon Storage (Csb) Decreased Water Use (Wb) Decreased Soil Erosion (Eb) Decreased Fertilizer Use (Fb) Decreased Herbicide Use (Hb) Emission reduction (MTCO 2 E/ton of Conversion compost) factor N/A 0. 04 0. 25 0. 26 0 N/A 0. 5 Total Overall Final Emission reduction (MTCO 2 E/ton of feedstock) 0. 26 0. 02 0. 13 0 0. 54 0. 42

California Legislation Connecting GHG Reduction and Recycling Connections to AB 341 75% recycling by 2020 = reduced disposal & GHGs 22 million tons removed from disposal; equals 20 – 30 MMTCO 2 e reduction Waste Management Sector Plan identifies activities to help achieve 75% recycling by 2020 Connections to AB 32 Purpose: To reduce the level of statewide greenhouse gas emissions in 2020 to 1990 levels AB Scoping Plan update includes a comprehensive and sustainable waste management system Waste Management Sector Plan identifies activities to achieve significant GHG reductions

2020 Goal: Achieve the AB 341 75% recycling goal and associated 20 to 30 MMTCO 2 e reduction 2035 Goal: Achieve Net-Zero GHG emissions from the entire Waste Sector and associated GHG reductions 2050 Goal: Achieve a 25% reduction in direct GHG emissions from 2035 levels Waste Management Sector Plan – GHG and waste reduction goals

http: //www. arb. ca. gov/cc/scopingplan/document/updatedscopingplan 2013. htm

Cap and trade investment plan $50 million approved to Cal. Recycle through 2015/2016 with another $35 proposed in the 2015/2016 budget New Grant & Loan Programs for Greenhouse Gas Reductions from Organics and Manufacturing with Recyclable Materials (Fibers, Plastic, and Glass)
 – Organic")
Greenhouse Gas Reduction Fund Waste Diversion • 2 Grant Programs ($20 million) – Organic materials ($15 million) – Received over 50 applications requesting over $118 million – Fiber, Plastic, and Glass ($5 million) – Received 19 applications requesting over $35 million http: //www. calrecycle. ca. gov/Climate/Grants. Loans/default. htm 29

As a class or individual activity complete Worksheet #14 to estimate GHG reductions and equivalent resource savings by a business that implements Zero Waste. Discuss Results.
- Slides: 30