The Greek debt Crisis and PASOK Gerassimos Moschonas

The Greek debt Crisis and PASOK Gerassimos Moschonas Athens, 28. 03. 2016

“The problem of governance questions Greece's ability to remain part of the EU's core" Featherstone and Papadimitriou (2008: 205) "It is a thousand times easier to vanquish the centralised big bourgeoisie than to "vanquish" the millions upon millions of petty proprietors” V. Ι. Lenin

PASOK in context

A natural party of government In October 1981 PASOK became par excellence the governmental party of the country (it remained in power forming single majority governments for twenty-one out of thirty-one years of the period 1981 -2012).
 1981 – 1985 s. m. government Andreas Papandreou")
PASOK IN POWER (1981 – 2012) 1981 – 1985 s. m. government Andreas Papandreou 1985 – 1989 s. m. government Andreas Papandreou 1993 – 1996 s. m. government Andreas Papandreou 1996 – 2000 s. m. government Costas Simitis 2000 – 2004 s. m. government Costas Simitis 2009 – 2011 s. m. government George Papandreou
 of the Socialist Parties: Southern Europe (averages by decade)")
Table 1. Electoral performances (%) of the Socialist Parties: Southern Europe (averages by decade) 1950 -59 1960 -69 1970 -79 1980 -89 1990 -99 2000 -09 2010 -12 Spain 29, 9 43, 9 38, 2 40, 2 28, 7 Portugal 33, 4 26, 4 39, 0 39, 9 Greece 19, 5 43, 4 42, 3 41, 6 12, 75 Average 27, 6 37, 9 39, 8 40, 6 23, 8 28, 1

PASOK obtained just 12% of the vote in the elections of June 2012. A significant programmatic actor and an even more significant electoral entrepreneur is now struggling for survival. Why?
 Total Left (PASOK + Communists) 70 60, 3 60")
Left in Greece (1974 -2012) Total Left (PASOK + Communists) 70 60, 3 60 57, 5 50 40 52, 2 51, 7 48, 9 54, 3 52, 2 52, 5 49, 8 51, 3 56 49, 96 44, 6 37, 4 30 20 23, 1 10 0 1974 1977 1981 1985 1989 1990 1993 1996 2000 Data base: Moschonas. Averages calculated by the author 2004 2007 2009 2012 Μ. 2012 J.
 ΚΚΕ + SYRIZA + DIMAR 40")
Communist and post-communist Left in Greece (1974 -2012) ΚΚΕ + SYRIZA + DIMAR 40 37, 7 35 31, 4 30 25 25, 3 20 15 10 5 31, 4 12, 1 12, 211, 7 13, 1 11 9, 5 10, 3 7, 4 10, 7 8, 7 9, 2 13, 212, 1 19 74 19 77 19 81 19 85 19 89 19 90 19 93 19 96 20 00 20 04 20 07 20 20 09 12 Μ 20. 12 Ι. 0 Data base: Moschonas. Averages calculated by the author

PART ONE How did Greece get into this mess? PASOK’s fiscal policy (1981 -1989 and 1993 -2004)

Un pays qui balançait de l’argent par les fenêtres? The prevailing view that the Greek state has always been wasteful is one of the more objectionable myths circulating on the international ideas market. Until 1980, with the exception of the mild relaxation of the first democratic period (1974– 80), postwar Greek governments had pursued—with “German, ” as it were, assiduity and success—policies of fiscal discipline
 represented a decisive break with the totality")
PASOK’s first period in government (1981– 89) represented a decisive break with the totality of postwar economic policy. It was a watershed. A long tradition of balanced (or approximately balanced) budgets was abandoned.

1981 -1989: a Keynesian programme and the change of fiscal paradigm In 1981, PASOK, with a Keynesian programme attempted to revitalize economic growth (which had fallen to just 1 per cent of GDP in 1980, while inflation reached 24. 5 per cent), and to implement what it called ‘the third way to socialism’. A central element in PASOK’s economic and social policy, which was also central to the party’s political image, was a policy of redistribution in favour of lower classes.
 blue- and white-collar workers on the lowest rung of")
Incomes policy, January 1982 a) blue- and white-collar workers on the lowest rung of the pay scale would be granted 41. 7% to 53. 5% increases (on average there was a 46. 4% increase in the basic wage, an increase approximately double than that of the previous year); (b) automatic wage indexation: wage levels were to be adjusted automatically every four months so that wage and salary earners would be compensated for the intervening rise in the cost of living; (c) collective bargaining would be empowered to yield higher increases but not lower.

Incomes policy, January 1982 It is worth noting the more than doubling of farmers’ pensions and the establishment of separate pensions for farmers’ wives This policy carries an indirectly but clearly redistributive connotation, the ‘countryside’ being – according to dominant sentiment in Greece at the time – the poorest part of the country.
![Incomes policy, January 1982 “The pay increases […] were unexpectedly large even for the](http://slidetodoc.com/presentation_image_h2/1db6d465b1dbab6472c81d5146526847/image-16.jpg "Incomes policy, January 1982 “The pay increases […] were unexpectedly large even for the")
Incomes policy, January 1982 “The pay increases […] were unexpectedly large even for the recipients themselves. The objective was that they should be engraved in people’s memory for years” (my emphasis) (Iordanoglou). PASOK was a redoubtable political entrepreneur and it was aiming very high. Through its incomes policy It had just launched what was to be a more than thirty-year ascendancy.

The establishment of the National Health System in 1983 was the capstone of the process of constructing a genuine welfare state—and a further, highly symbolic move towards strengthening the party’s left-wing image. Health expenditure doubled, going from 3. 4% of GDP in 1980 to 5% in 1984 and 7% in 1989.
 1980 1981 1982 1983 1984 1985")
Greece: Social Expenditures, 1980 -1993 (% of GDP) 1980 1981 1982 1983 1984 1985 1986 1987 1988 1989 1990 1991 1992 1993 10, 2 14, 5 15, 1 15, 4 16, 0 15, 8 14, 6 15, 5 16, 5 15, 9 16, 1 17, 0 12, 3 OECD, (2011).

A qualitative leap in social expenditures Steep overall rise in social expenditures from a modest 10. 2 percent of GDP in 1980 to 16 percent in 1985 (the end of PASOK's first term in office), stabilizing at 15. 5 percent in 1989 (the end of the party's second term).

"My mistakes were made for you“? �In Greece, after PASOK’s first term of government (1981 -85), people were often heard to remark: “even so, PASOK has given money to the poor”.

"My mistakes were made for you“? Greece 1970 -1993: General Government surplus or deficit (% GDP) 1970 1971 1972 1973 1974 1975 1976 1977 1978 1979 1980 1981 0, 6 0, 1 - - -1, 2 -2, 6 -1, 5 -2, 2 -2, 6 -2, 1 -2, 3 -7, 8 1982 1983 1984 1985 1986 1987 1988 1989 1990 1991 1992 1993 -6, 5 -6, 7 -7, 6 -10, 4 -8, 6 -10, 3 -12, 1 -14 -9, 9 - 10, 9 -11, 9 Πηγή: OECD Factbook 2010: Economic, Environmental and Social Statistics
 PASOK’s first period in government (1981– 89)")
PASOK changes the fiscal paradigm (1981 -89) PASOK’s first period in government (1981– 89) represented a decisive break with the totality of postwar fiscal policy. The government deficit more than tripled in 1981, to almost 8 percent of GDP and climbed to 12 percent in the closing year of PASOK's second term.
 A long post-war tradition of balanced (or")
PASOK changes the fiscal paradigm (1981 -89) A long post-war tradition of balanced (or approximately balanced) budgets was abandoned. From that time onward, Greece entered a highrisk zone from which it has never succeeded in extracting itself.
 � Overall, a generous wages policy (especially")
PASOK changes the fiscal paradigm (1981 -89) � Overall, a generous wages policy (especially in 1981 -83), the upgrading of the lowest pensions (and the rise in the number of beneficiaries), the indirect nationalisation of firms in difficulty, the increase in the number of civil servants, the traditionally high expenditure in the ‘defence’ sector and, last but not least, PASOK’s manifest failure to curb major tax fraud – these dramatically deepened the public deficit and national debt.
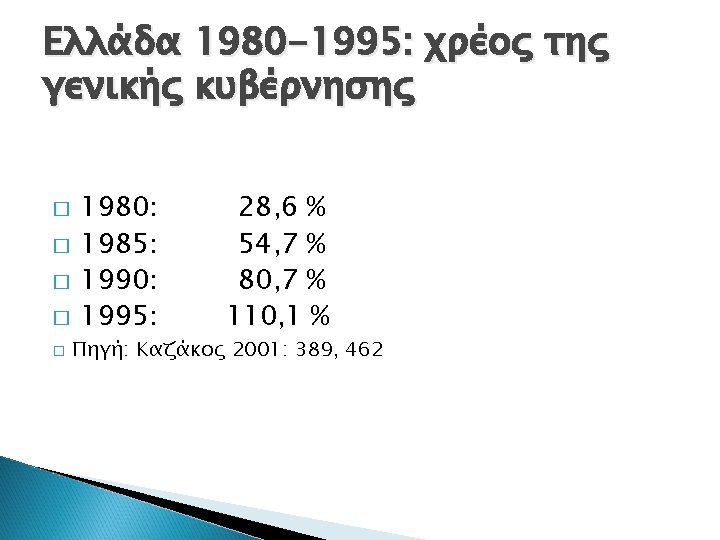

Greece – Eurozone: 1998 -2012 Maastricht definition of general government gross public debt 1998 1999 2000 2001 2002 2003 2004 2005 2006 2007 2008 2009 2010 2011 2012 Greece 94, 5 94 Eurozone 72, 7 71, 9 103, 4 103, 7 101, 7 97, 4 98, 9 100, 3 106, 1 105, 4 110, 7 127, 1 142, 8 152, 5 154, 7 69, 3 69, 5 68, 1 67, 9 Source: OECD Economic Outlook No 89, May 2011 69 70, 1 68, 4 66, 2 70 79, 4 85, 5 88, 4 89, 3

Living dangerously: The scandal of tax evasion

Without a genuine tax policy? Tax Receipts as a Percentage of GDP 1979 -1980 Total 1987 -1988 30, 3 35, 8 5, 2 5, 9 Indirect taxes 14, 3 17, 4 Social security Contributions 9, 1 11, 1 Income tax Πηγή: OECD Greece 1990: 52

A ‘don’t tax – just spend party’? For a party proudly asserting its left-wing identity and pursuing an economic line against the grain of European economic policy in the 1980 s, this is doubtless surprising. PASOK was never a ‘tax and spend party’ – the traditional image of the British Labour Party. Instead, it was a ‘don’t tax – just spend party’.
 The failure of ‘economic leftism’ dictated the turn")
The incomplete fiscal rationalization (1993 -2004) The failure of ‘economic leftism’ dictated the turn to a policy that was more or less respectful of liberal orthodoxy (1993 -2004). The governments of C. Simitis (1996 -2004), which initiated a vast programme of privatisation and market liberalisation, succeeded in reducing inflation and public deficits and – above all – in presiding over a period of strong growth, the strongest since 1981. During Costas Simitis’s second term (2000– 2004) there was again an obvious relaxation of fiscal discipline.

Not everything was rosy: Tax revenues elasticity 1997 -2009 Nominal GDP growth Tax revenues change (%) (Ι) (ΙΙ)/(Ι) (ΙΙΙ)/(Ι) 1997 10, 70% 14, 90% 1, 39 13, 70% 1, 28 1998 8, 80% 16, 30% 1, 86 11, 20% 1, 28 1999 6, 50% 12, 00% 1, 83 9, 70% 1, 48 2000 20, 90% 11, 20% 0, 54 14, 90% 0, 71 2001 7, 40% 2, 40% 0, 32 6, 60% 0, 88 2002 7, 00% 8, 20% 1, 18 11, 70% 1, 68 2003 10, 10% 3, 00% 0, 3 2, 90% 0, 29 2004 7, 80% 7, 10% 0, 91 11, 40% 1, 47 2005 5, 10% 6, 60% 1, 29 2, 80% 0, 55 2006 8, 20% 6, 90% 0, 84 12, 00% 1, 47 2007 7, 50% 7, 60% 1, 01 9, 80% 1, 31 2008 4, 30% 5, 50% 1, 28 5, 00% 1, 15 2009 -0, 80% -2, 70% 3, 32 -9, 10% 11, 35 Έτος Tax revenues elasticity VAT revenues change VAT revenues elasticity (%) Πηγή: Έκθεση Κυβερνητικού Προϋπολογισμού, Υπουργείο Οικονομικών, 2010
 � For all its great successes at the")
The incomplete fiscal rationalization (1993 -2004) � For all its great successes at the level of European politics, improvement in the macroeconomic indicators, and shaping of a more modern and culturally more liberal Greece, the PASOK of Costas Simitis failed to carry out a radical fiscal adjustment in the favorable conditions of economic growth and low interest rates. � The countdown towards bankruptcy had just begun
 1960 1980 2004 2005")
Greece and Eurozone: General Government Expenditure (in % of GDP) 1960 1980 2004 2005 2006 2007 2008 2009 2010 Greece 20, 6 29, 0 45, 5 44, 6 45, 2 47, 6 50, 6 53, 8 50, 2 Eurozone 30, 4 45, 0 47, 5 47, 3 46, 7 46 47, 1 51, 1 50, 9 Πηγή: Για τα έτη 1960 & 1980, Χαρδουβέλης 2008: 103. Για τα έτη 2004 -2010, Eurostat, 2011, http: //epp. eurostat. ec. europa. eu,

Greece and Eurozone: Tax Receipts as a Percentage of GDP 1998 1999 2004 2008 Greece 34, 3 35, 4 33, 3 35, 1 Eurozone 42, 3 42, 8 40, 7 40, 9 Πηγή: Eurostat, Statistics in focus — 23/2010. Economy and finance, Author: Alessandro LUPI

The “fatal deficit. ” � The logic of numbers does not allow any hesitation in diagnosis. The Greek debt is the product of thirty years of deficit budgets driven by the low level of tax receipts. This is the “fatal deficit. ” � Despite neoliberal affirmations, Greece’s fiscal catastrophe cannot be attributed to the size of the state, which nevertheless ceased being small a long time ago.

Are there extenuating circumstances?

The big …. . Shipping is Greece’s heavy industry. International shipping is an exceptionally competitive branch of the economy, which was globalized even prior to globalization. Greece is a superpower in this field. The approximately 2, 500 shipowning families “are an economic elite owning by far the largest part of the wealth and profits of Greek ‘big capital’” (Doxiadis 2013: 80). Τhe level of taxation is extremely low, verging on the ridiculous.

…. and the small : "Everything counts in large amounts" A country of small businesses with a high proportion of self-employed (according to OECD figures for 2007, 96. 5% of Greek businesses employ fewer than ten employees), is an ideal environment for flourishing tax evasion. The constellation of small and medium-size businesses , owing to their electoral clout, they can paralyze the best-intentioned, would -be political reformer.


� For a political system with a stable electoral dominance by the broader Left and with governmental dominance by the Socialists, the prevalence of tax evasion, tax avoidance and evasion of payment of insurance contributions constitutes a major political and economic scandal.

� The term “scandal” is not a matter of polemics. It is chosen with absolute respect for the Weberian principle of value-neutrality � What kind of social-democratic party was this that based its taxation policy primarily on the tax-paying capacity of wage-earners?


FIN
- Slides: 62