
The Graph Key to Discovery or Confusion The
- Slides: 16
The Graph Key to Discovery or Confusion The Graph
The Objectives Define graphing Understand graph theory Understand practical graphing techniques 11/29/2020 The Graph 2
Why? Major communication vehicle Wonderful, efficient model üillustrates complex relationships Discovery tool Often misused ü“Everyone spoke of an information overload, but what there was in fact was a non-information overload” R. S. Wurman 11/29/2020 The Graph 3
Graphing Defined “Visually display of measured quantities by means of combined use of points, lines, a coordinate system, numbers, symbols, words, shading, and color. ” E Tufte Visual pattern Abstraction Concept (p 176) 11/29/2020 The Graph 4
Graph Basics Serves a clear purpose Reveals the data (p 17, 27, 161) Focus on substance not technique Avoid distortion Space/Number efficiency Encourage comparisons Reveals multiple levels of detail 11/29/2020 The Graph 5
Graphical Limitations Silly theory = silly graph (p 15) garbage in = garbage out Small sets for small minds Technique Complexity ~ confusion Abstracting away the essentials 11/29/2020 The Graph 6
Graphical Integrity “Showing the obvious to the ignorant” E. Tufte ü “No one can write (graph) decently who is distrustful of the reader’s intelligence, or whose attitude is patronizing” E. B. White Apples 11/29/2020 Deceit (p 54) ü Lie Factor = Size of effect on graphic/Size of effect on data ü 3 D exaggeration (p 69) (C p 30) ü Quantization Tricks Use tables for small sets and oranges The Graph 7
Graphical Quality Data - Ink Ratio Avoid ü Above all else show data. ü Eliminate non-data ink the Duck (p 117) ü Form eliminates substance ü Also moiré & grids ü Dimensions ü Labels ü Effect vs. Cause ü The Golden Rectangle Data Density = # of entries/Graph Area Esthetics 11/29/2020 The Graph 8
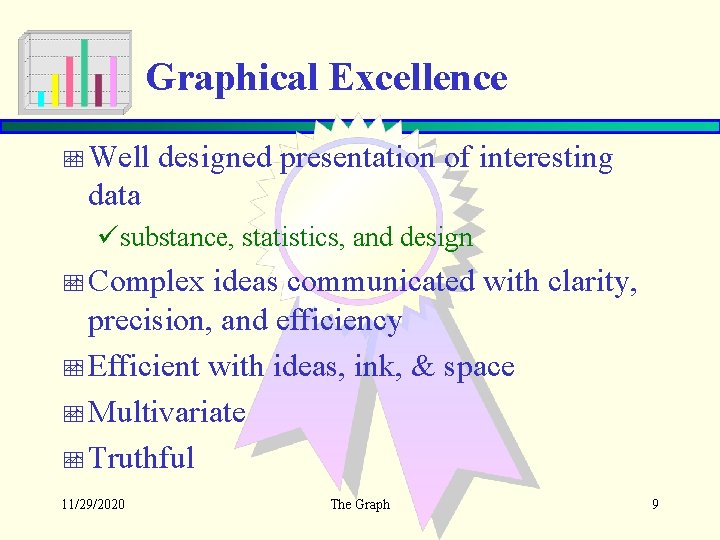
Graphical Excellence Well designed presentation of interesting data üsubstance, statistics, and design Complex ideas communicated with clarity, precision, and efficiency Efficient with ideas, ink, & space Multivariate Truthful 11/29/2020 The Graph 9
Getting Down to Business Practical Graphing Techniques The Graph
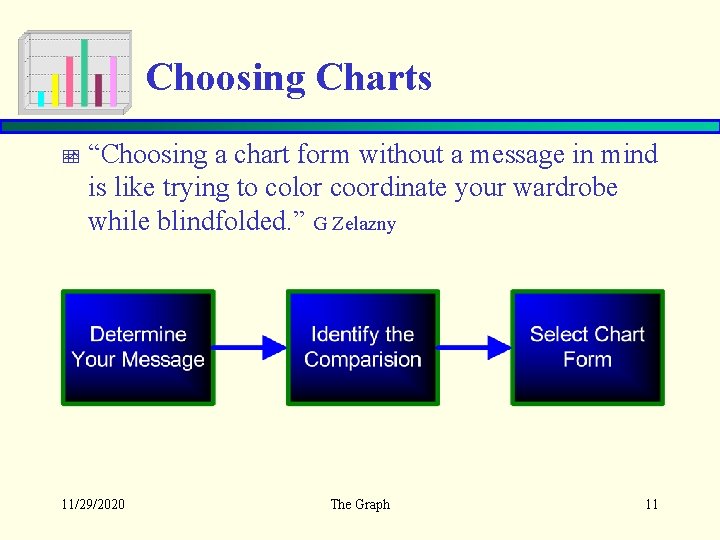
Choosing Charts “Choosing a chart form without a message in mind is like trying to color coordinate your wardrobe while blindfolded. ” G Zelazny 11/29/2020 The Graph 11
Determine Your Message Sketch Exercise Effective Title Chart üConclusion Driven 11/29/2020 The Graph 12
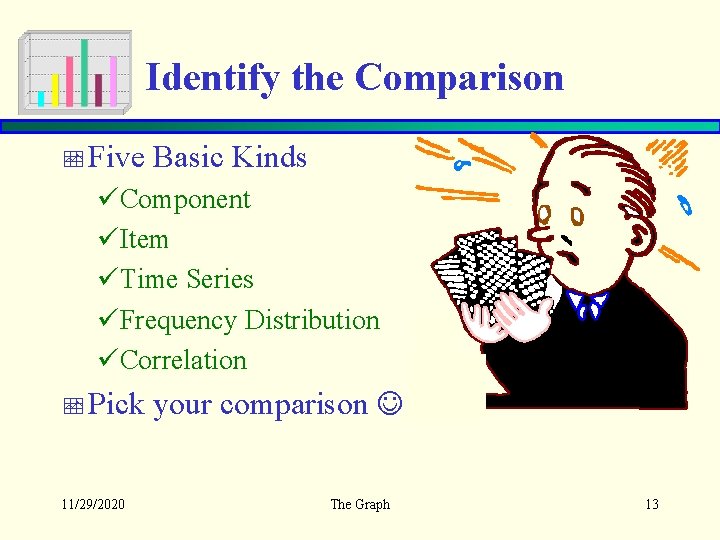
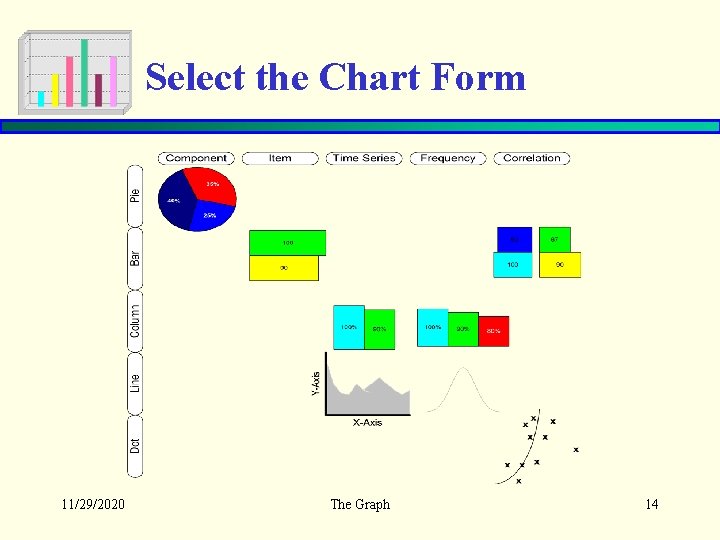
Identify the Comparison Five Basic Kinds üComponent üItem üTime Series üFrequency Distribution üCorrelation Pick 11/29/2020 your comparison The Graph 13
Select the Chart Form 11/29/2020 The Graph 14
Summary Reveal data richness instead of exaggerating data dearth üEffective data presentation üBeware the temptations Know and picture your goal üGoal : Comparison : Chart Be 11/29/2020 conscious of other’s failings The Graph 15
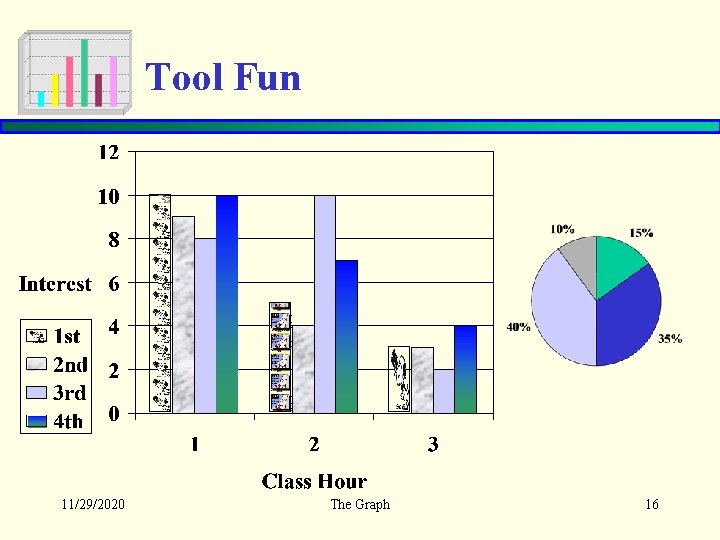
Tool Fun 11/29/2020 The Graph 16