The grand apartheid spatial legacy Population Structure of


![Same districts – North West [Map not Include]](https://slidetodoc.com/presentation_image_h2/6628c37d14b90eba22a6697f0748ee80/image-10.jpg "Same districts – North West [Map not Include]")


- Slides: 58
The grand apartheid spatial legacy Population Structure of South Africa national and provincial pyramids what do they tell us Migration patterns and implications on population structure by province Migration patterns and implications for social investment Population Attributes and the development challenge Challenges of getting out of poverty into the bell jar of a better life Profiling indices geographically: A platform for targeted action Towards A Development Index Framework to Measure and Manage Development
Human Settlement and Poverty Challenges for South Africa Evidence from Censuses Surveys and a DIF Pali Lehohla Statistician General Portfolio committee on Housing 14/09/04
Utilisation Framework for Official Statistics Top Political Authority Mass Media Resources Authority Planning Authority Specialist Groups Statistical Authority
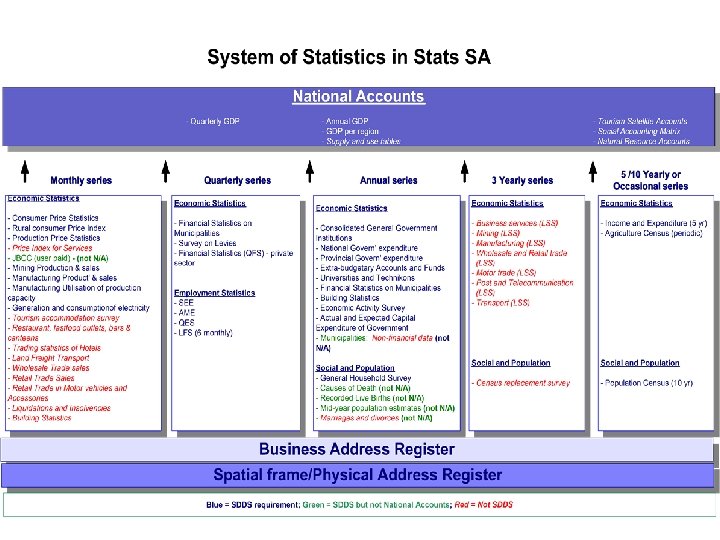
Measuring Poverty
Measuring Poverty Measure Moneymetric perspective Basic needs Approach and Type of indicator Poor if below defined measure or poverty line Indicators: Expenditure, welfare payments, wage levels. People living without basic needs Indicators: Access to water, literacy, life expectancy Social Exclusion Needs and exclusion from society and prosperity Indicators: political, social and economic components Sustainable livelihoods Individuals and communities vulnerability Indicators: Community generated indicators Spatial mapping Spatial representation Indicators: Segregation indices, area-value maps Composite indicators Combined indicators of well-being Indicators: e. g. Human Development Index
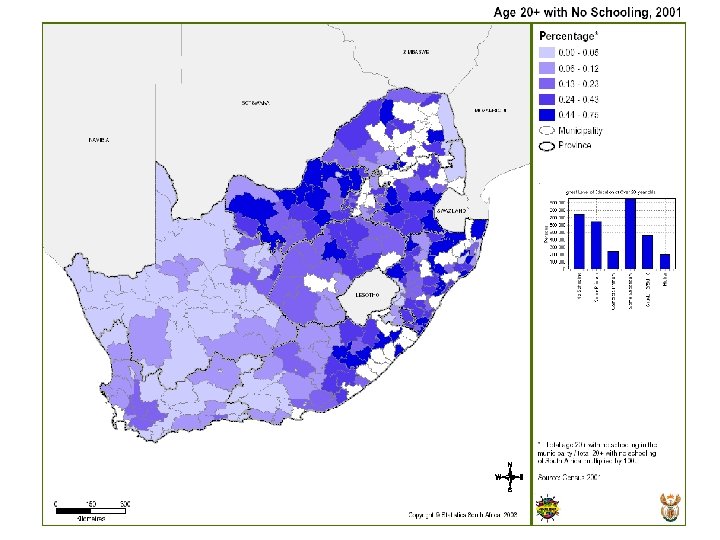
The grand apartheid spatial legacy
District boundaries Apartheid Era
Same districts – North West [Map not Include]
Population size vs UFI of former White and Black cities in SA, 1996
CPI & UFI of the first 50 centres
The SA urban rank-size – 1996, 2003
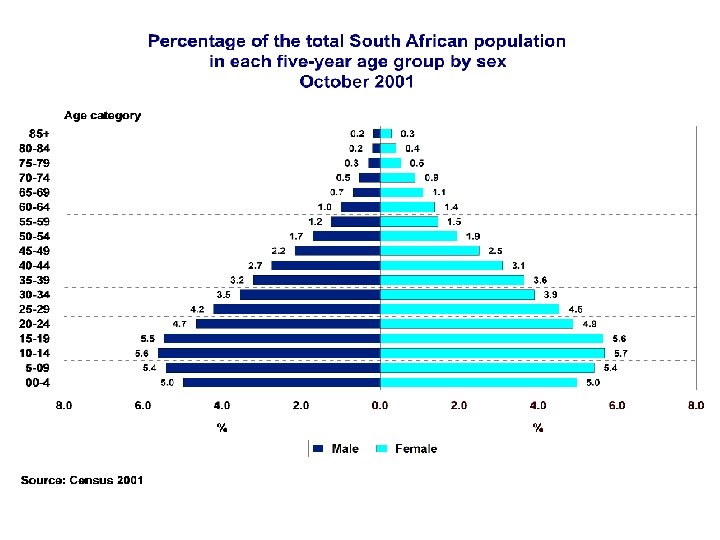
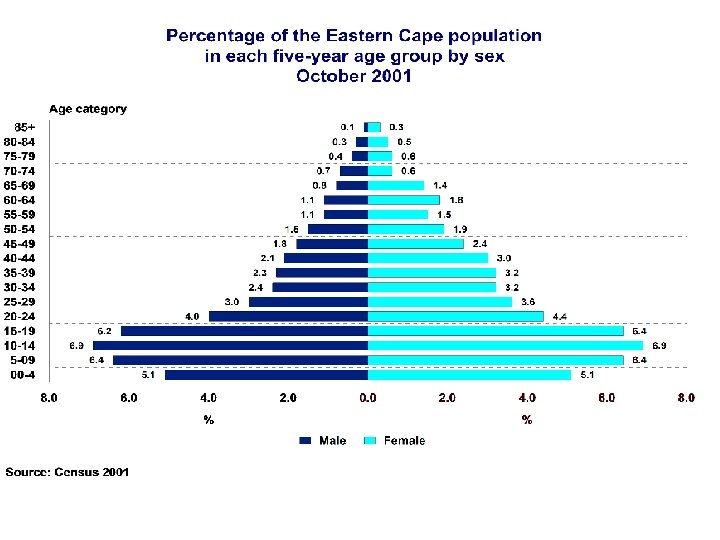
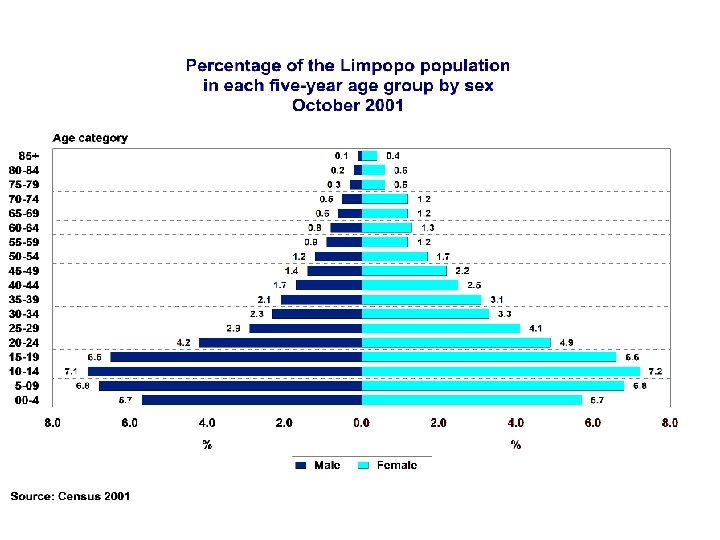
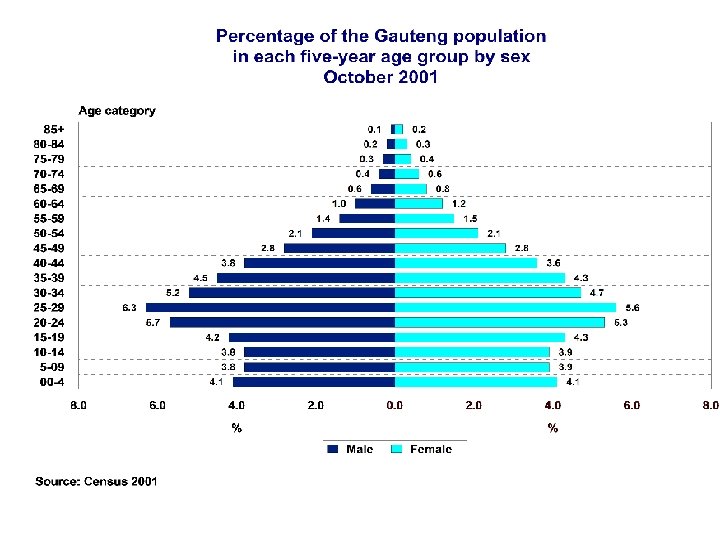
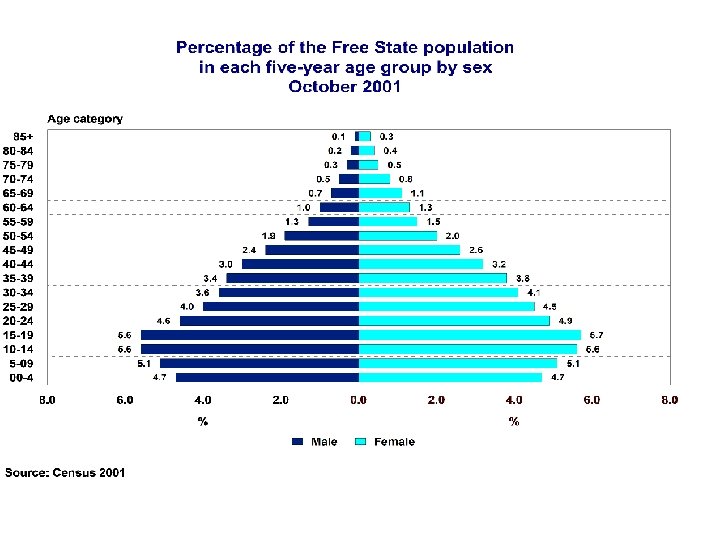
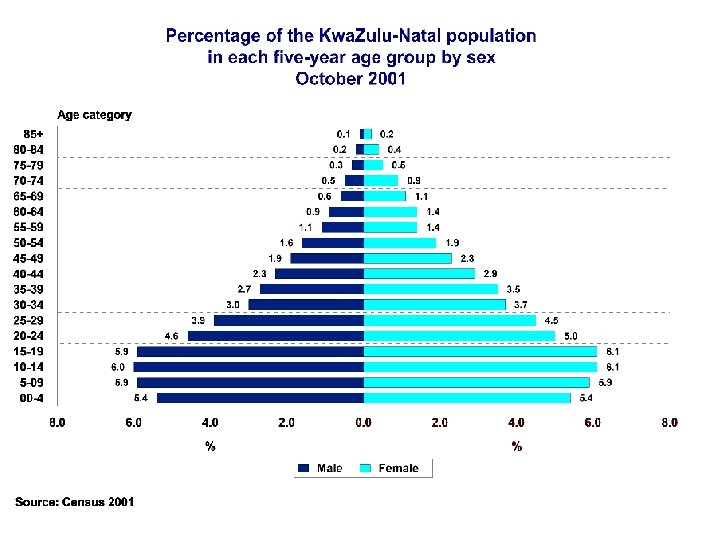
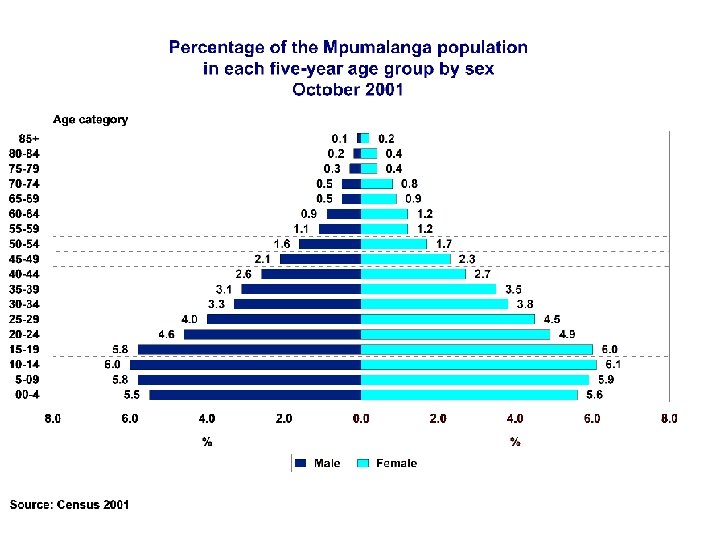
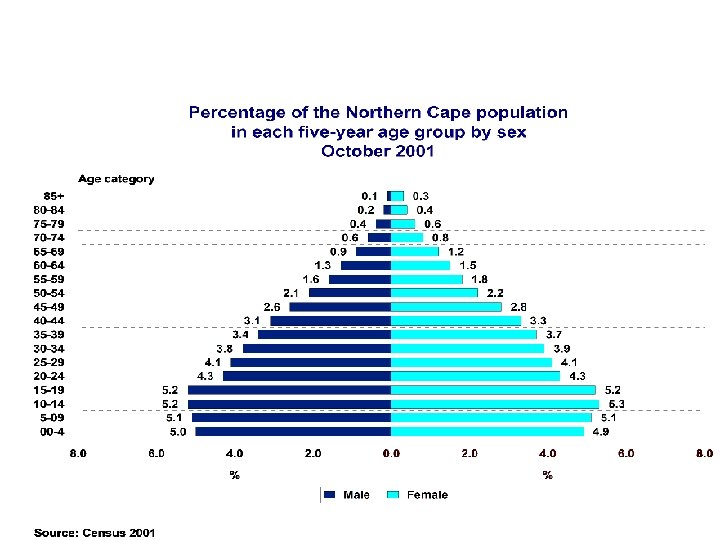
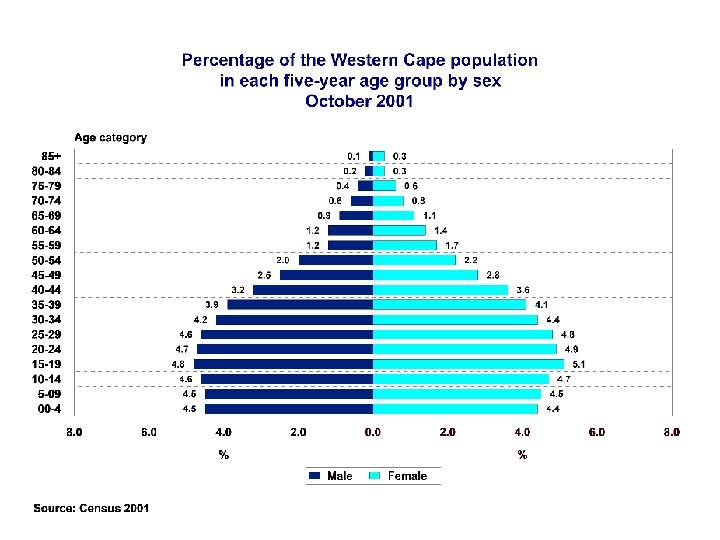
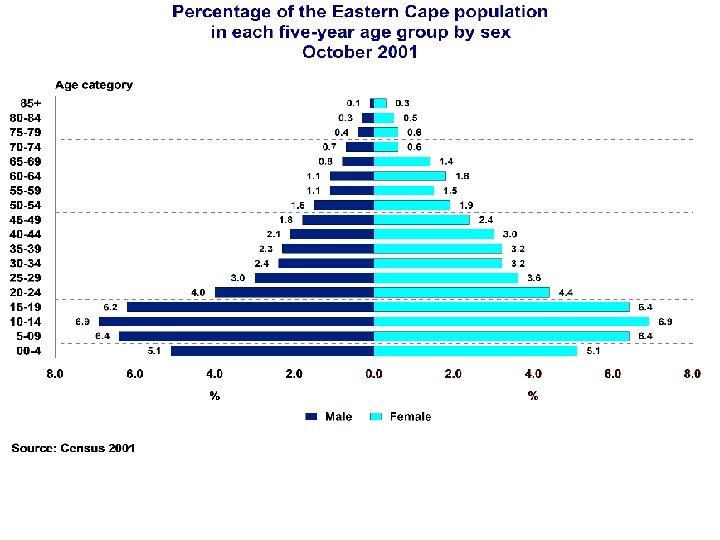
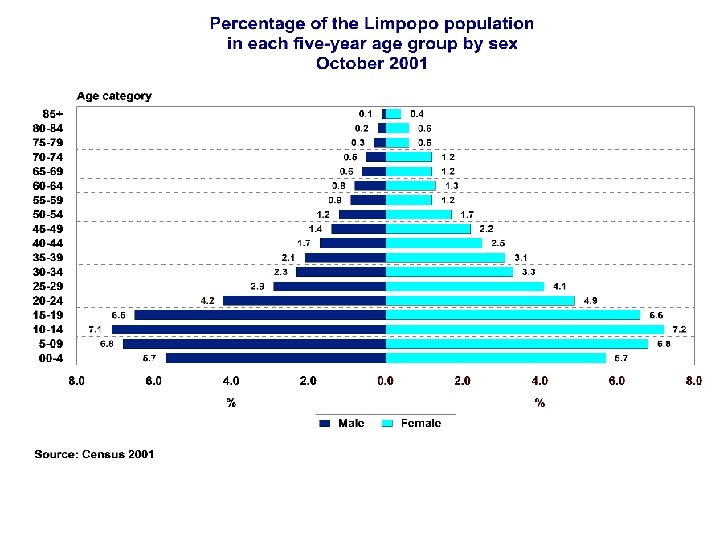
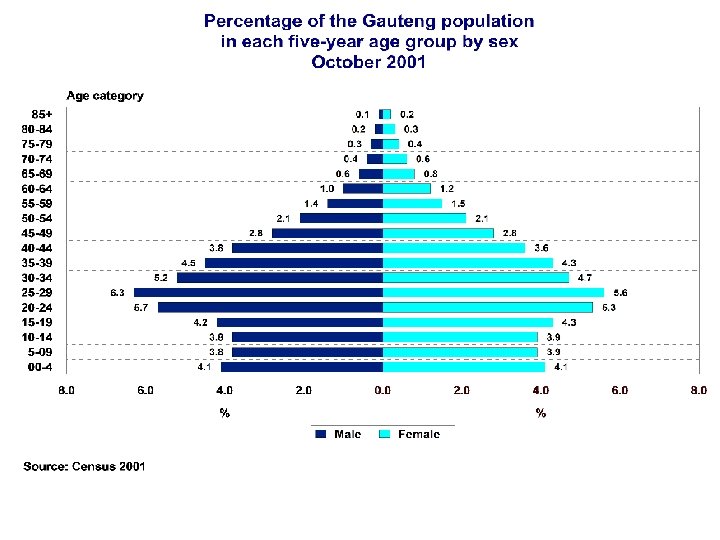
Population Structure of South Africa national and provincial pyramids what do they tell us
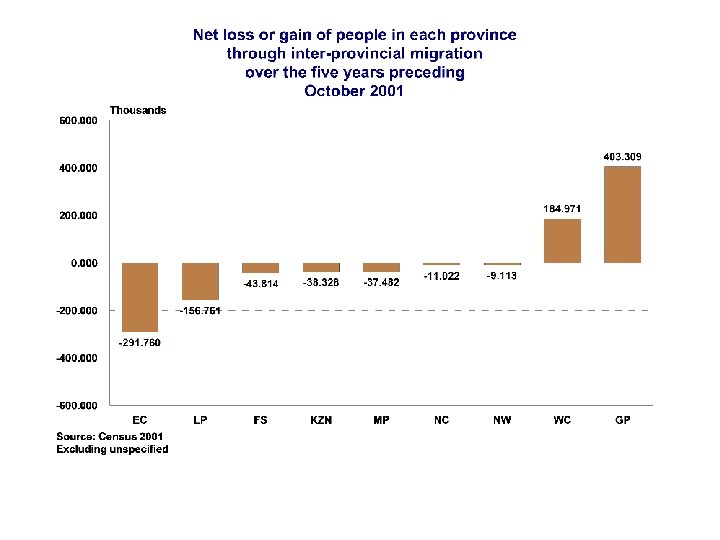
Migration patterns and implications on population structure by province
Among those who had moved between provinces between October 1996 and October 2001, province into which they moved
migration patterns and implications for social investment
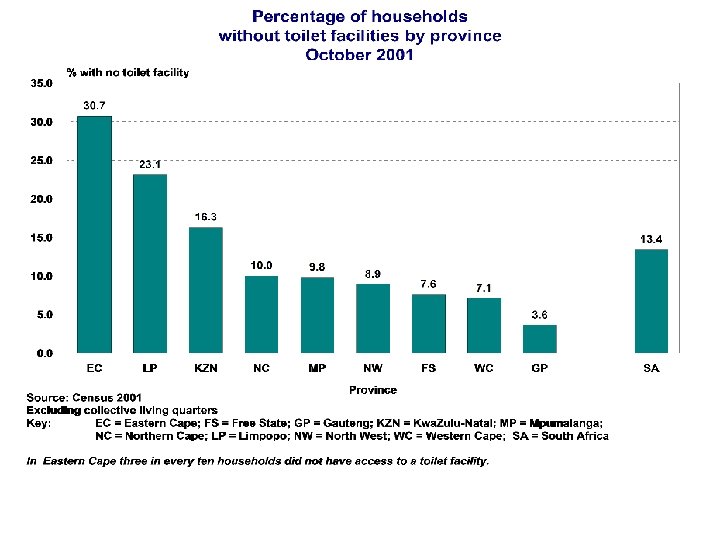
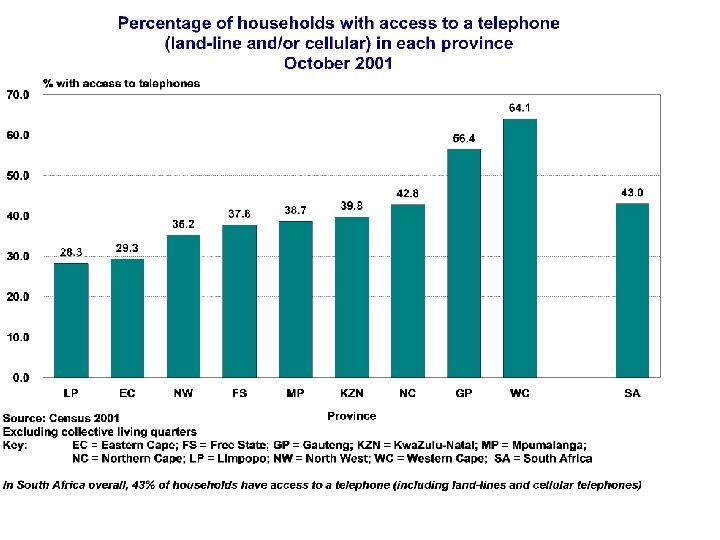
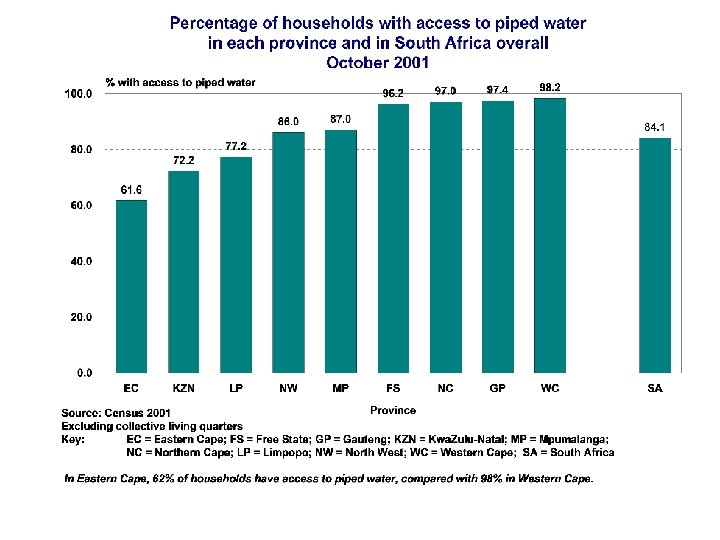
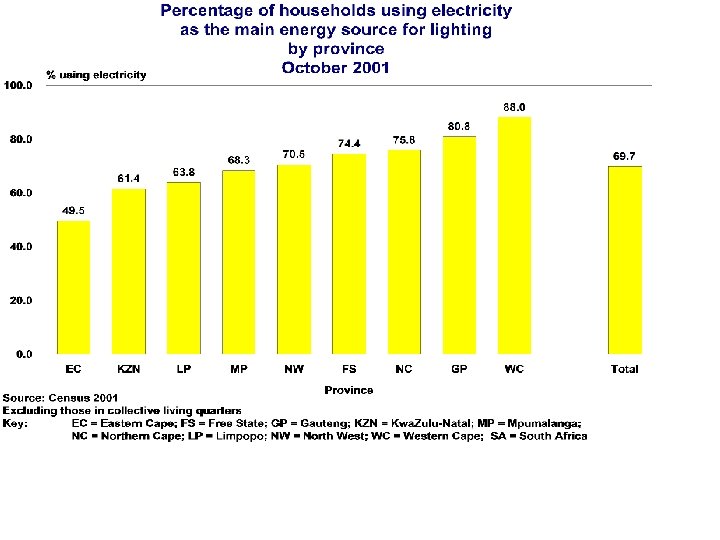
Population Attributes and the development challenge
Occupation for census 1996 and 2001 by population group
Field of study or Profession by population group – Census 2001
Official unemployment rate by population group: Feb. 2000 to Sept 2002
Official unemployment rate by population group and sex: Sept. 2002
Challenges of getting out of poverty into the bell jar of a better life
Distribution of the self-employed individuals by province and race group Census 1996 -2001
Distribution of the employers by province and race group Census 1996 -2001
Distribution of the self-employed by level of education and race group Census 1996 -2001
Distribution of the employers by level of education and race group Census 1996 -2001
Distribution of the self-employed by income category and race group Census 1996
Distribution of the self-employed by income category and race group Census 2001
Distribution of the employers by income category and race group Census 1996
Distribution of the employers by income category and race group Census 2001
Distribution of the self-employed by industry and race group Census 1996 -2001
Distribution of the self-employed by industry and race group… Continued Census 1996 -2001