The Future of Solar in the Sunshine State


 Chevy Volt (<35 miles ∞ MPG, 60 miles 89 MPG)")


 is")


 - 560 contracts totaling")

")


- Slides: 77
The Future of Solar in the Sunshine State
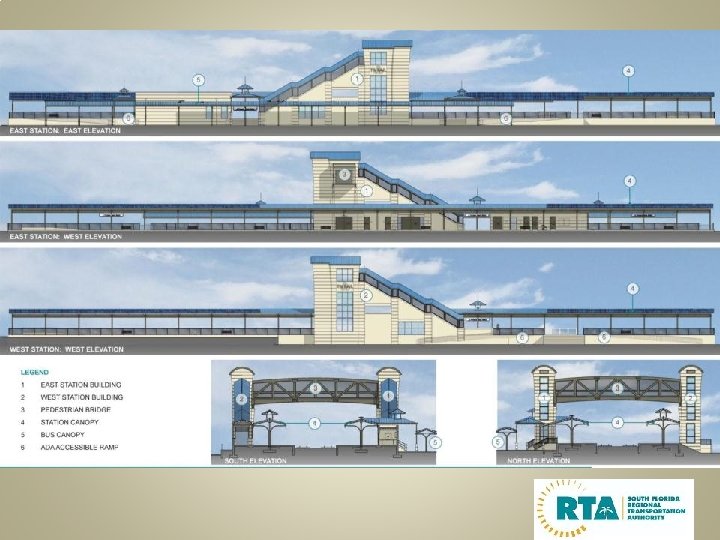
Pompano Beach Green Station Demonstration Project William L. Cross South Florida Regional Transportation Authority
Tri-Rail’s “Green Station” Demonstration Project Presented by: William L. Cross, P. E. South Florida Regional Transportation Authority January 25, 2013
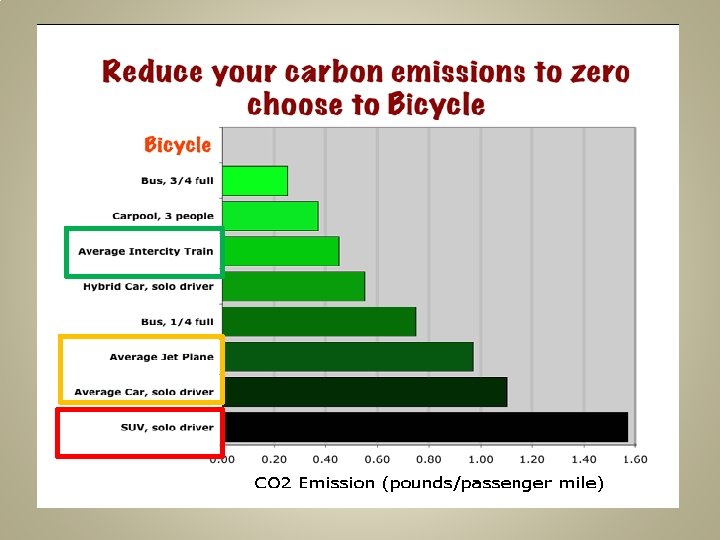
Why? Transportation accounts for 1/3 of CO 2 Emissions
SFRTA Board Supports “Green Initiatives”
Transit Allows High Density Land Use, Which Cuts CO 2 HIGH DENSITY MID-DENSITY LOWER-DENSITY
Pompano Beach Station Improvements Goals of Project: • Upgrade to current design guidelines • Improve pedestrian access & circulation • Improve vehicular circulation and increase parking • Obtain “Silver” LEED Certification • First “Green” Station & prototype West Lot East Lot
Tri-Rail Prototype “Green” Station 9/25/2020
Federal Transit Administration TIGGER Grant Transit Investments for Greenhouse Gas and Energy Reduction SFRTA submitted grant application August 2011 Competitive Project Selection Process FTA awarded $5. 7 million on November 16, 2011 Grant allowed Design to include: Increased solar energy to 100% plus Electric vehicle charging stations Parking canopy for additional solar panels and shaded parking
Existing and Typical Versus “Green” Tri-Rail Station 250000 Solar Generation 200000 150000 Existing Typical 100000 Green 50000 0 Annual Energy Consumption (KWH)
Annual Station O&M Costs Dollars $40, 000 34, 000 $35, 000 $30, 000 $25, 000 $20, 000 18, 000 $15, 000 10, 000 $5, 000 $0 Annual Station Operating & Maintenance Cost Existing Typical Green
Project Status Fully Funded Design Complete Procurement Package Being Finalized Anticipated Contract Procurement Mid-2013 Complete Late 2014
A Vision for Solar in the Sunshine State Cory Ramsel Manager of Development Florida Power & Light
Unleashing Florida’s Solar Potential Creating jobs and building a lasting industry Cory Ramsel Sr. Manager of Development Florida Power & Light Company January 25, 2013
Cautionary statements and risk factors that may affect future results Any statements made herein about future operating results or other future events are forward-looking statements under the Safe Harbor Provisions of the Private Securities Litigation Reform Act of 1995. These forward-looking statements may include, for example, statements regarding anticipated future financial and operating performance and results, including estimates for growth. Actual results may differ materially from such forwardlooking statements. A discussion of factors that could cause actual results or events to vary is contained in the Appendix and in our Securities and Exchange Commission (SEC) filings. 17
Next. Era Energy is comprised of two strong businesses supported by a common platform • $29. 7 B market capitalization(1) • 41, 493 MW in operation • $62. 0 B in total assets • • One of the largest U. S. electric utilities Vertically integrated, retail rate-regulated 4. 6 million customer accounts 24, 594 MW in operation • U. S. leader in renewable generation • Assets in 23 states, Canada, and Spain • 16, 899 MW in operation We have been in the solar business for 20 years! 18 1) Market Capitalization as of October 31, 2012, all other data September 30, 2012
FPL provides customers with electricity that is low-cost, clean and reliable with a diverse fuel mix including natural gas, nuclear and solar Service Area Power Plant Solar Facilities 19
Following the passage of legislation in 2008 allowing the PSC to approve renewable energy projects, FPL completed three solar facilities Solar Generation Development De. Soto Space Coast Martin • Located on FPL property in De. Soto County in central FL • Located at NASA’s Kennedy Space Center • Located at FPL’s Martin Plant in Indiantown, FL • Photovoltaic technology • Solar hybrid technology • 25 MW of capacity • 10 MW of capacity • 75 MW of capacity • Actual cost: $152 MM • Actual cost: $71 MM • Actual cost: $398 MM Combined, all three projects came in more than $100 million under budget and created 5, 000 direct and indirect jobs 20
The solar projects have created thousands of jobs, pumped millions of dollars into the local economy and are providing long term benefits to the state and region Martin Hybrid Solar Thermal Plant 21
Recent economic studies have confirmed the expected net results of these potential investments Example Solar Plant Impacts • Proposed 75 -MW Babcock Ranch solar plant could generate the following economic impacts : 1 – A total of 1, 375 direct, indirect and induced jobs – Over $90 million in potential labor income – Over $293 million in gross domestic product – A total economic impact of $401 million arising from the proposed solar project – Close to $70 million in state and local fiscal revenues 22 1) According to study conducted by The Washington Economics Group (WEG), April 2011.
Delivering Value to our Customers: Our typical residential customer bill continues to be the lowest of Florida’s 55 utilities Florida Electric Utility Bill Comparison $94. 62 FPL Compared with the state average, FPL’s typical bill means $373 in annual savings $125. 70 Florida Average based on rates for Jan. -March 2012 23 Sources: Average of January-March 2012 typical, 1, 000 -k. Wh monthly bill data compiled from the Florida Public Service Commission, Florida Municipal Electric Association, Reedy Creek Improvement District, Florida Electric Cooperatives Association and JEA. Notes: Figures include state gross receipts tax. “Florida Average” is the average of all bills depicted. Florida Public Utilities Co. operates as one utility but charges different rates in its two territories.
Our typical residential customer bill is also currently about 25 percent lower than the national average Keeping Florida Competitive $94. 62 FPL Compared with the national average, FPL’s typical bill is 25% lower based on rates for January 2012 $124. 31 National Average 24 Source: Typical 1, 000 -k. Wh residential bills , Edison Electric Institute (EEI) Typical Bills and Average Rates Report for Winter 2012, published in May 2012, for rates effective Jan. 2012. Notes: Averages only include utilities that report their rates to EEI and may not be all-inclusive. “Florida IOU Average” is based on EEI data for the state’s investor-owned utilities: FPL, Gulf Power, Progress Energy Florida and Tampa Electric.
Florida can also become a magnet for renewable manufacturers and research dollars at public universities • The “living lab” at our corporate headquarters allows us to test a variety of solar technologies under real world conditions – Crystalline Silicon (mono, poly) – Thin Film (adhesive, glass panels, cylindrical) – Pole Mounted • With supportive policy, renewable energy industry companies will locate manufacturing and assembly facilities to Florida 25
A diversification of Florida’s energy landscape is better for the economy, environment, and all of us! Together We Can Achieve • Energy security – Diversification of the state’s fuel sources and reduction of state’s dependence on fossil fuels • Economic development – Immediate creation of thousands of high‐paying direct and indirect jobs and industry‐driven revenue increase for local communities • Environmental benefits – Clean energy with no greenhouse gas emissions – Reduction of water consumed in conventional electric generation • Diversification of state economy – Leveraging state’s deep seaports, to become a primary exporter of renewable energy products – Attraction of renewable energy research and development • Administration and Policy support 26
The only guarantee for failure is to stop trying - John Maxwell 27
Enhancing Florida’s Economy and Environment Through Clean Energy Technologies Stephen Barkaszi Senior Research Engineer Florida Solar Energy Center
The Future of Solar in Florida PV on your roof & pay $1. 08 a gallon January 25, 2012 Broward Go Solar Fest Stephen Barkaszi A Research Institute of the University of Central Florida
Where Do We Stand? A little in the way of background. . . 30 FLORIDA SOLAR ENERGY CENTER — A Research Institute of the University of Central Florida
Toyota Prius (50 MPG) Chevy Volt (<35 miles ∞ MPG, 60 miles 89 MPG) 31 FLORIDA SOLAR ENERGY CENTER — A Research Institute of the University of Central Florida
“Game Changers” The New Electric Cars • 80% of VMT is less than 40 miles per day • 26% of Florida vehicles are small cars • 4, 000 k. Wh/yr for 12, 000 miles • If all small cars electric Nissan Leaf (all electric) – 1. 4 billion gallons of gasoline saved per year – $2. 6 billion net cost savings per year if PV electric – 15 TWh (billion k. Wh) additional energy needs per year (4 MORE LARGE POWER PLANTS)! Chevy Volt (plug-in hybrids) Total Cost of Electric Car ~ Cost of Gasoline Car at the end of 5 years FLORIDA SOLAR ENERGY CENTER — A Research Institute of the University of Central Florida 32
Net Cost Savings A Central Florida Example 33 FLORIDA SOLAR ENERGY CENTER — A Research Institute of the University of Central Florida
34 FLORIDA SOLAR ENERGY CENTER — A Research Institute of the University of Central Florida
FLORIDA SOLAR ENERGY CENTER — A Research Institute of the University of Central Florida
Residential Photovoltaic Power is Equivalent to $1. 08 Per Gallon Gasoline Fuel Efficiency Fuel Price Cost per Mile Cost per 12, 000 Miles 25 mpg $3. 25 per gal 13¢ per mile $1, 560 3 miles per k. Wh 13 ¢/k. Wh ($1. 08 per gal equiv. ) 4. 3¢ per mile $520 Gasoline Car Electric Car 36 FLORIDA SOLAR ENERGY CENTER — A Research Institute of the University of Central Florida
FLORIDA SOLAR ENERGY CENTER — A Research Institute of the University of Central Florida
http: //www 1. eere. energy. gov/solar/pdfs/sssummit 2012_plenary_swanson. pdf FLORIDA SOLAR ENERGY CENTER — A Research Institute of the University of Central Florida 38
39 FLORIDA SOLAR ENERGY CENTER — A Research Institute of the University of Central Florida
40 FLORIDA SOLAR ENERGY CENTER — A Research Institute of the University of Central Florida
“Back of the Envelope” Numbers All Small Cars PV Electric by 2030 Annual Florida Gasoline use Florida on-road vehicles Florida Small Cars (26. 3%) Displaced Gasoline (16. 7%) Displaced Gasoline Cost ($3. 25 /gal) PV Electricity (4 Power Plants) PV Capital Cost ($2. 9 Wp-dc installed) PV Job-Years (manuf. & install. ) PV Electricity Cost ($0. 13 /k. Wh) Cost Savings Displaced OPEC oil imports 8. 4 billion gal/y 14. 3 million 3. 76 million 1. 4 billion gal/y $4. 6 billion/y 15. 0 TWh/y $20. 4 billion 238, 000 $1. 96 billion/y $2. 63 billion/y 67 % 41 FLORIDA SOLAR ENERGY CENTER — A Research Institute of the University of Central Florida
Stephen Barkaszi, PE PV Systems Program Director A Research Institute of the University of Central Florida
Solar Powering Your Community Casey Johnston Director of Renewable Energy Programs ICLEI – Local Governments for Sustainability
Solar Powering Your Community Through Employee Group Purchasing Casey Johnston Renewable Energy Program ICLEI USA January 25 th, 2013
ICLEI’s Mission Our mission is to build, serve, and drive a movement of local governments to advance deep reductions in greenhouse gas emissions and achieve tangible improvements in local sustainability.
ICLEI USA Services Basic Member Resources: • • Tools and Programs Ad hoc technical support Communications/Media Support Recognition Training and Consulting Services • • GHG Inventories Climate Action Planning Sustainability Planning Training and TA for Solar
Sun. Shot Solar Outreach Partnership The Sun. Shot Solar Outreach Partnership (Solar. OPs) is a U. S. Department of Energy (DOE) program designed to increase the use and integration of solar energy in communities across the US.
Solar 3. 0 Solar 30. org Portal States PV Developers PV Installers Cities Local/State Fire Marshals Building Inspectors Code Officials Utilities Industry Partners
Energy Benefits Employee Group Purchase Program for ICLEI Members
The US Solar Market Top 5 Countries Solar Operating Capacity Germany 35. 6% A US % 5. 7 http: //www. map. ren 21. net/GSR 2012. pdf Germany Italy Japan Spain USA Rest of World
The US Solar Market Total installed solar capacity in the US 4 GW Capacity installed in Germany in Dec 2011 4 GW http: //www. map. ren 21. net/GSR 2012. pdf
The Cost of Solar in the US Comparison of US and German Solar Costs $ 7. 00 $ 6. 00 $ per Watt $ 5. 00 $ 4. 00 Total Installed Cost $ 3. 00 $ 2. 00 $ 1. 00 $- US Solar Cost German Solar Cost Source: NREL (http: //ases. conferenceservices. net/resources/252/2859/pdf/SOLAR 2012_0599_full%20 paper. pdf) (http: //www. nrel. gov/docs/fy 12 osti/53347. pdf) (http: //www. nrel. gov/docs/fy 12 osti/54689. pdf)
The Cost of Solar in the US Comparison of US and German Solar Costs $ 7. 00 $ 6. 00 $ per Watt $ 5. 00 $ 4. 00 Non-Hardware Cost $ 3. 00 Hardware Cost $ 2. 00 $ 1. 00 $- US Solar Cost German Solar Cost Source: NREL (http: //ases. conferenceservices. net/resources/252/2859/pdf/SOLAR 2012_0599_full%20 paper. pdf) (http: //www. nrel. gov/docs/fy 12 osti/53347. pdf) (http: //www. nrel. gov/docs/fy 12 osti/54689. pdf)
The Cost of Solar in the US Comparison of US and German Solar Costs $ 7. 00 $ 6. 00 $ per Watt $ 5. 00 $ 4. 00 Non-Hardware Cost $ 3. 00 Hardware Cost $ 2. 00 $ 1. 00 $- US Solar Cost German Solar Cost Source: NREL (http: //ases. conferenceservices. net/resources/252/2859/pdf/SOLAR 2012_0599_full%20 paper. pdf) (http: //www. nrel. gov/docs/fy 12 osti/53347. pdf) (http: //www. nrel. gov/docs/fy 12 osti/54689. pdf)
The Cost of Solar in the US Comparison of US and German Solar Costs $ 7. 00 $ 6. 00 $ per Watt $ 5. 00 $ 4. 00 Profits, Taxes, & Overhead $ 3. 00 Column 1 Non-Hardware Cost $ 2. 00 $ 1. 00 $- US Solar Cost German Solar Cost Source: NREL (http: //ases. conferenceservices. net/resources/252/2859/pdf/SOLAR 2012_0599_full%20 paper. pdf) (http: //www. nrel. gov/docs/fy 12 osti/53347. pdf) (http: //www. nrel. gov/docs/fy 12 osti/54689. pdf)
The Cost of Solar in the US Comparison of US and German Solar Costs $ 7. 00 $1. 60 $ 6. 00 $1. 40 $1. 20 $ per Watt $ 5. 00 $ 4. 00 $ 3. 00 $1. 00 $0. 80 $0. 60 $ 2. 00 $0. 40 $ 1. 00 $0. 20 $- $0. 00 US Solar Cost Solar Soft Costs Other Paperwork Permitting Column 1 Non-Hardware Cost Installation Labor Hardware Cost Customer Acquisition German Solar Cost Source: NREL (http: //ases. conferenceservices. net/resources/252/2859/pdf/SOLAR 2012_0599_full%20 paper. pdf) (http: //www. nrel. gov/docs/fy 12 osti/53347. pdf) (http: //www. nrel. gov/docs/fy 12 osti/54689. pdf)
Customer Acquisition $ 0. 80 $ 0. 70 10 x the cost for customer acquisition Cost per Watt $ 0. 60 $ 0. 50 $ 0. 40 $ 0. 30 $ 0. 20 $ 0. 10 $US Source: NREL, LBNL Germany
Solution: Group Purchasing
Solution: Group Purchasing § Solarize Portland (2009 -2011, 6 campaigns) - 560 contracts totaling 1. 7 MW § Solarize Mass (12 months, 2011) - 162 contracts totaling 829 k. W
Solarize Model: Advantages Barriers Solutions High upfront cost Group purchase Complexity Community outreach Customer inertia Limited-time offer
Solarize: Advantages Benefits to Local Government: Low implementation cost: < $10, 000 (+ labor) Quick turn-around: 6 -9 Months Long-term impact: Builds a self-sustaining
Energy Benefits: Employee Group Purchase Program 1083 participants / 118 Contracts Total Combined Capacity 652. 3 k. W 850 participants / 90 Contracts Total Combined Capacity 620 k. W
Energy Benefits to Local Government: § No cost/Low cost § Fosters collaboration between LG and community members § Increases maturation of local market, § Achieves community emissions reductions § ICLEI Markets success
Energy Benefits to Program Participants: § Technical Education /Consumer education § Lower cost: 10% - 20% § Long-term impact: financial and environmental
Energy Benefits: Case Study Solar Benefits Colorado Customer Pool ~150, 000 Source: Wikipedia
Solar Benefits Colorado: Timeline Solar Benefits Colorado Engage Leadership and Identify Employers Jan & Feb 2012 Jan 2012 Select Installer March & April 2012 Marketing, Workshops, & Enrollment Site Assessments and Contracting April – Aug 2012 Aug - Sep 2012 Installation Aug ‘ 12 – Apr ‘ 13 April 2013
Solar Benefits Colorado: Timeline Solar REC Solar Offering 15 -20% Benefits Below Colorado Avg Price Engage Leadership and Identify Employers Jan & Feb 2012 Jan 2012 Select Installer March & April 2012 Marketing, Workshops, & Enrollment Site Assessments and Contracting April – Aug 2012 Aug - Sep 2012 Installation Aug ‘ 12 – Apr ‘ 13 April 2013
Solar Benefits Colorado: Timeline Solar Benefits Colorado Engage Leadership and Identify Employers Jan & Feb 2012 Jan 2012 Select Installer March & April 2012 1083 households signed up Marketing, Workshops, & Enrollment April – Aug 2012 Site Assessments and Contracting Aug – Sep 2012 Installation Aug ‘ 12 – Apr ‘ 13 April 2013
Solar Benefits Colorado: Marketing Strategy: § In person workshops and lunch & learns § Program website § Email newsletters Source: Vote Solar
Solar Benefits Colorado: Marketing Frequently Asked Questions: § What happens if I move? § What happens when the power goes out? § Do I have to clean the panels? § Should I replace my roof first?
Solar Benefits Colorado: Timeline 451 households qualified of which 118 have moved forward. 26% Conversion Rate! Solar Benefits Colorado Engage Leadership and Identify Employers Jan & Feb 2012 Jan 2012 Select Installer March & April 2012 Marketing, Workshops, & Enrollment Site Assessments and Contracting April – July 2012 Jun - Aug 2012 Installation Aug ‘ 12 – Apr ‘ 13 April 2013
Solar Benefits Colorado: Timeline Solar Benefits Colorado Engage Leadership and Identify Employers Jan & Feb 2012 Jan 2012 Select Installer March & April 2012 Marketing, Workshops, & Enrollment Site Assessments and Contracting April – July 2012 Jun - Aug 2012 Installation Aug ‘ 12 – Apr ‘ 13 April 2013
Solar Benefits Colorado: Summary • • Outreach and education to 1083 118 new installations totaling 652 k. W <$4/W Pricing for Cash Purchases 24 Cash Purchases/94 Sun. Run Leases $2. 5 M in sales 15% – 20% discount in installation costs System size range: 2. 4 kw-9. 8 kw Average system size: 5. 5 k. W
Group Purchase Programs: Impact Lasting Impact Source: NREL
www. icleiusa. org The Solarize Guidebook
Solarize: Resources Resource The Solarize Guidebook A roadmap for project planners and solar advocates who want to create their own successful Solarize campaigns. www. nrel. gov
Thank You Casey Johnston casey. johnston@iclei. org 706. 206. 7220