The Future of Auditing and Audit Evidence Whats


 may")


 ◦ Identify")


 $13, 000 Funjet Vacations")


- Slides: 60
The Future of Auditing and Audit Evidence
What’s going on at the ASB? � https: //www. cpajournal. com/2019/02/25/w hats-happening-at-the-auditing-standardsboard/
Is there an update to the audit evidence standards coming?
AU-C 500 Audit Evidence exposure draft being released by the Auditing standards board • • Proposed update to evidence standards due to AI, blockchain, etc. (emerging techniques and technologies) • • • Provides practical guidance for digital analytics technology Uses existing principles applied to data Professional skepticism still must be applied to data analytics • Proposed definition – Audit evidence that is sufficient to persuade an experienced auditor to draw conclusions based on consideration of audit evidence “Sufficient” and “appropriate” currently defined separately in AU-C Section 500 New definition of ‘internal information” – reflects all internal information that management obtains, including accounting records, to prepare financial statements Proposed effective date for audits of financial statements for periods ending on or after December 15, 2020 (12/31/20 or 6/30/21)
AU-C 500 Audit Evidence exposure draft being released by the Auditing standards board • • ASB does not believe automated data analysis is an ‘audit procedure’, but is a technique that can be used to meet objectives Proposal also includes management specialists as a source of audit evidence – • Additional material included whether sufficient appropriate audit evidence obtained. • Other text changes on what is sufficient appropriate audit evidence
AU-C 500 Audit Evidence exposure draft being released by the Auditing standards board • • ASB does not believe automated data analysis is an ‘audit procedure’, but is a technique that can be used to meet objectives Proposal also includes management specialists as a source of audit evidence – • • Additional material included whether sufficient appropriate audit evidence obtained. Other text changes on what is sufficient appropriate audit evidence AICPA – attributes and factors used to evaluate whether information obtained represents appropriate audit evidence
AU-C 500 Audit evidence exposure draft being released by the auditing standards board • Auditors will need to evaluate relevance and reliability in the context of the sources from which it was obtained • Whether the evidence corroborates or contradicts assertions • 22 proposed paragraphs of application guidance just on relevance and reliability
AU-C 500 Audit evidence exposure draft being released by the auditing standards board • As important are the sources of information in gauging the relevance and reliability • Is it generated internally or outside the financial reporting system?
AU-C 500 Audit evidence exposure draft being released by the auditing standards board • Put them both together – does the evidence have relevance and reliability considering the sources • Are they contradictory or corroborative?
Using Data Analytics in Auditing - Not new to audit standards
Analytics and the Standards � CAATS – Computer Aided Audit Tools or Computer Assisted Audit Techniques � Mentioned in various AICPA SAS’s �AU-C 315 “Understanding Entity & Its Environment…” �. A 7 -. A 9 – Analytical Procedures � SAS 99 – now incorporated in clarified SAS’s ◦ Management override ◦ Journal Entries � COSO – Fraud Risk Management Guide ◦ Emphasis on data analytics ◦ Appendix E � GAO – A Framework for Managing Fraud Risks in Federal Programs
AU-C 330 �. A 17 The use of computer assisted audit techniques (CAATs) may enable more extensive testing of electronic transactions and account files, which may be useful when the auditor decides to modify the extent of testing (for example, in responding to the risks of material misstatement due to fraud). Such techniques can be used to select sample transactions from key electronic files, sort transactions with specific characteristics, or test an entire population instead of a sample.
AU-C 330 � . A 29 The nature of the particular control influences the type of audit procedure necessary to obtain audit evidence about whether the control was operating effectively. For example, if operating effectiveness is evidenced by documentation, the auditor may decide to inspect such documentation to obtain audit evidence about operating effectiveness. For other controls, however, documentation may not be available or relevant. For example, documentation of operation may not exist for some factors in the control environment, such assignment of authority and responsibility, or for some types of control activities, such as control activities performed by a computer. In such circumstances, audit evidence about operating effectiveness may be obtained through inquiry in combination with other audit procedures, such as observation or the use of CAATs.
Data analytics has been around for awhile, but not widely used due to lack of technology • • • Frequency distribution of the first digits in data Number 1 occurs naturally in about 30% of all transactions Larger the digit, less frequent Commonly used forensics, fraud analysis and many other scientific purposes 35 30 Frequency of First Digit (%) • 25 20 15 10 5 0 1 2 3 4 5 First Digit 6 First exhibited in 1938! 7 8 9
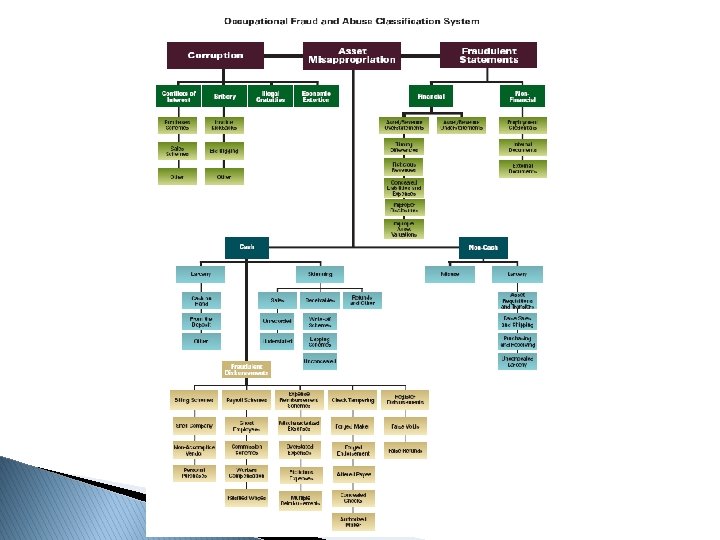
Report to the Nations - ACFE
Report to the Nations - ACFE
The speedy conversion to data-driven fraud detection • • • Traditional fraud detection is expert-based and usually ineffective (see previous on Fraud) Industry is moving quickly to data-driven fraud detection using analytics / ‘big data’ • More precise – uses volumes of information to uncover fraud patterns usually invisible • More efficient – can comply with strict time constraints • Cost efficient – less paper, less decision-making Changes the fraud cycle Process without analytics Fraud Detection - NEW Fraud Investigation Fraud Confirmation Automated process using analytics Fraud Prevention – Hopeful outcome
Where to start • Data needs to be categorized • Transactional data – usually structured and detailed – relational databases may be used • Contractual or account data – categorization by • • Type of expense / revenue Length of service (contract length) • • • Gender Marital status Income level Education level Occupation Many others • Socio / demographic • Data is then pooled and linked – think of what credit agencies do
What do these show? Wiley, 2015, 2018, Descriptive, Predictive and Social Network Techniques (Fraud analysis)
Where it is heading • Behavioral information • Using pooled data – where does the person exist • • • Shopping Social media / web surfing Living conditions / lifestyle Merge the data to predict result Show outliers – focus there on potential fraud – becomes a shift toward auditing by exception Using big data and focus on outliers then shifts assurance to: • Automation / AI • Bots • Integrity of transaction / process (DLT / Blockchain)
Pitfalls • • GIGO Data Governance • Where is the data from / what sources? • How secure is it? (Does it comply with GDPR)? • Is the analysis being performed internally or by third parties? • Data privacy based on results • Incorrect analysis conclusion (jumping to the answer without evaluation) • Is the analysis hindsight (forensic) or foresight (predictive)
Putting data analytics into practice � Jane has worked with the State Department of Revenue for 28 years. Her husband Dick is retired. They live a quiet life. Their credit scores are 760 -790. Their house is fully paid. Two kids are fully grown, married and out of the house. Dick and Jane have various hobbies that keep them busy. � While Jane was out of the house at the outlets buying an outfit for an upcoming family event, Dick made reservations on a two week cruise for Jane’s birthday. It’s on the same cruise line they went on six months ago and the company gave Dick an offer to the top suite for a special price. Dick gave his credit card and it was declined. Jane swiped her credit card at the outlets and it was declined.
Putting data analytics into practice • • Take 10 minutes What databases might have the credit card company(ies) used? If a D/A system is used in Internal Audit for the State DOR, what red flags would the systems ideally notice? Are there pitfalls here?
Example - journal entry testing • Parameters on 61, 825 journal entries in sample • Sample size based on audit risk = 33 • Predictive dates that could cause anomalies • • Federal holidays (New Years, MLK day, President’s day, Memorial day, July 4 th, Labor Day etc. ) Days of the week loaded where transactions unlikely (Saturday / Sunday) • Specific words searched for as well and within words • • Plug Fix Correct Balance Fraud Variance Asdfirgagggeerrorlllop Many others. .
Data Mining Journal Entries � Who ◦ � Summarize journal entries by the persons entering to determine if they’re authorized. What ◦ Extract nonstandard or manual journal entries (versus system entries such as an accounts payable ledger posting) for further analysis. ◦ Stratify size of journal entries based on amount (using the debit side of the transaction). ◦ Summarize journal entries by general ledger account to identify repetitive and unique account sequences used in the journal entry (based on the first five debit and credit account postings). ◦ Summarize general ledger activity on the amount field (absolute value of debit or credit) to identify the top occurring amounts. � When ◦ Extract journal entries posted on weekends and holidays. ◦ Extract Journal entries posted an odd times (after hours, way early) ◦ Extract journal entries relating to the prior year that were made just immediately following a fiscal year-end. ◦ Summarize journal entry credits and debits processing by day, month and year.
Data Mining Journal Entries � Where ◦ Extract journal entries made summarize by the person entering and corresponding account numbers. ◦ Extract journal entries to general ledger accounts known to be problems or complex based on past issues (errors of accounting in journal subsequently corrected by accounting staff or auditors). ◦ Extract debits in revenue and summarize by general ledger account. � Why (Unusual Activity) ◦ Extract general ledger transaction amounts (debit or credit) that exceed the average amounts for that general ledger account by a specified percentage. (Five times the average is a good starting point. ) ◦ Extract journal entries that equate to round/even multiples. ◦ Extract journal entries with key texts such as “plug” and “net to zero” anywhere in the record. ◦ Extract journal entries that are made below set accounting department approval limits, especially multiple entries of amounts below such limits. � Also perform benford analysis ◦ Extract journal entries that don’t net to zero/balance (debits less credits).
Data Mining � Vendors and accounts payable � Expense reimbursements � Payroll � Journal Entries (see previous slides 0 � Pension Census Data � Grants � And anywhere you have data!!!
Data Mining Vendor Analysis � � Analyze vendors population for recurring vendors (ex. utilities, monthly services, etc. ) Establish trends or average for certain vendors. ◦ Also consider types of expenditures � Supplies � Construction Projects � Equipment � Look for unusual payments above average. � Identify Vendors that may create a conflict of interest � Compare Vendor Master File address to Employee file ◦ Vend File: 320 My St. , 73160 ◦ Clean data: 320 , 73160 HR file – 320 My Street, 73160
Data Mining Vendor Analysis � Look for increases in amount and payment frequency over time. � Look for professional services or consulting contracts. � Duplicate invoices or duplicate payments for same services. (invoice #, Amounts, Sequential invoicing) � Multiple � Split Vendors with Same Address Purchases
Data Mining Vendor Analysis � Split Purchases � Invoice Date created before PO Date � Frequent Changes to Vendor Master
Data Mining Vendor Analysis � Unusual vendors or payees � High dollar /low frequency payments � High frequency /low dollar payments
Data Mining Expense Reimbursements � Reimbursements to employees ◦ Unusual activity ◦ Duplicate reimbursement ◦ Personal Use reimbursement � Travel reimbursements ◦ Duplicate claims for same expense ◦ Unallowable expenses ◦ Expense claimed but paid on procard
Data Mining Payroll Analysis � Summarize payments by month for each employee. Calculate approximate biweekly net based on approved compensation. � Identify � Look outliers or unusual payment amounts. for unusual coding for small number of payments.
Data Mining Payroll Analysis � Review Overtime ◦ Abnormal or exceeding policy limits ◦ Received overtime payment but exempt � Paid before hire date � Paid after termination
Data Mining Payroll Analysis � � � Look for extra payments. One time payments for “special projects” or “additional duties” or “stipends” which were not approved. Look for Holiday bonuses!!!!! Compare employees receiving payments to current employees. Identify duplicate employees with same direct deposit account. Inflated salaries or hours ◦ Statutory or board approved salaries for upper management
Data Mining Pension Census Data � Census Data: ◦ Comparison/Reconciliation of Prior Year to Current Year file: �Identify Additions/deletion of participants �Identify Null Fields �Compare Participants information and identify changes: �Salary �Age �Sex �Birthdate �Hire Date �Termination/Retirement Date �Marital Status �Job classification
Data Mining Pension Census Data � Census Data: ◦ Comparing pension system/actuary data files to outside sources �Department of Public Safety – Drivers license database �Age (date of birth) �Gender �Department of Health �Record of death
Procurement Cards There is fraud, waste, & abuse … have you found it?
Procurement Cards � P-Card programs are expanding: ◦ Promote efficiency in purchasing process ◦ Reduce cost ◦ Rebate ($) � Difficulty in monitoring � Resources for review & training may be lacking � Promotes Fraud, Waste, & Abuse
Procurement Card Testing � Perform Cardholder Analysis ◦ Identify unusual activity ($) ◦ Identify underutilization ◦ Identify individuals more prone to circumvent purchasing rules � Identification ◦ ◦ of Split Purchases Splits based on Single Transaction Limits Splits based on Purchasing limits Identification of splits over multiple days Collusion: �Splits by departmental staff
Procurement Card Testing � Day of the Week Test ◦ Identifying weekend activity � Identification of Potential Budget abuse � Joining information from HR/Payroll ◦ Leave activity (Annual/Sick) ◦ Office Holiday’s/Office Closed � Analysis on Fuel purchases ◦ Level II use avg fuel rates to calculate anomalies ◦ Level III use actual detail on fuel purchases ($ & Gallons)
Procurement Card Testing � Creation of Keyword Search ◦ Create listing of items that are more incline to be personal purchase or violation of policies ◦ Join listing with Level III data to identify red flag transactions � Identify high risk MCC Codes/Vendors ◦ Think “Headline in the Paper”
Example Activity Day of the Week Monthly Activity Do. W Month Settlement_Amount COUNT 1 Average_Day Rank 510, 495. 9 Wed 6 3387 2086 469, 187. 6 Tue 7 2866 2086 434, 689. 0 Thu 9 2714 2086 416, 700. 2 Fri 6 2355 2086 317, 074. 1 Mon 5 1726 2086 151, 037. 2 Sat 5 1135 2086 71, 869. 9 Sun 6 422 2086 Total 2, 371, 054. 34 1 2 3 06 01 10 05 4 5 02 09 6 08 7 04 03 07 11 12 Total $_Amount COUNT 1 Avg_Month Rank 413, 351. 6 4 2342 1217 1 233, 153. 3 5 977 1217 2 215, 235. 8 5 1340 1217 3 210, 911. 4 8 1125 1217 4 200, 571. 6 6 1198 1217 5 197, 809. 8 1 1280 1217 6 193, 707. 9 3 1098 1217 7 192, 616. 0 4 1224 1217 8 183, 668. 5 3 1101 1217 9 162, 860. 4 0 1049 1217 10 153, 941. 7 0 1032 1217 11 113, 225. 9 5 839 1217 12 530, 028. 05
Example Split Transaction CARDHOLDER_NAME Tran_Date CA_Dept 18 33 23 23 2/9/2012 Athletics 2/10/2012 Athletics 6/4/2012 Education 6/8/2012 Education Total Vendor_Name Settlement_Amount SINGLE_TRAN_LIMIT Description Athletic Supply Store 1, 282. 30 2500 Equipment for Player Athletic Supply Store 1, 340. 30 2500 Equipment Office Supply Store 327. 26 750 Office Supplies Office Supply Store 483. 81 750 Office Supplies $ 3, 433. 67
Example Cardholder Profile More likely to Circumvent Purchasing Rules ACCOUNT_NUMBER max 1 max 2 min 1 max_max 2 ******0856 2, 480. 03 1, 368. 68 10. 00 1 ******9797 2, 472. 00 2, 160. 00 5. 00 4 ******2989 2, 439. 50 899. 63 0. 57 1 ******5644 2, 437. 05 2, 262. 44 4. 50 8 ******7308 2, 460. 00 1, 950. 00 5. 89 6 ******0417 2, 430. 00 2, 250. 00 3. 84 8 ******7935 2, 415. 00 1, 222. 60 2. 44 8 ******9386 2, 431. 00 1, 922. 06 1. 44 6 ******9528 2, 418. 83 2, 396. 00 1. 30 1 1. 8 1. 1 2. 7 1. 0 1. 2 1. 0 1. 9 1. 2 1. 0 max_min COUNT 1 Total AVG_TRANS_AMT Single_Amount_Limit 248. 00 116 32803. 42 2 494. 40 78 21573. 6 8 4, 279. 82 79 7309. 34 3 541. 57 66 17361. 16 7 417. 66 38 20394. 23 9 632. 81 161 32142. 13 4 989. 75 38 7654. 38 3 1, 688. 19 139 34445. 9 3 1, 860. 64 55 13313. 85 8 271. 0 276. 5 92. 1 210. 9 536. 6 199. 6 201. 4 247. 7 240. 7 MAX_PRCT_STL 00 2, 499. 99% 00 2, 499. 98% 00 2, 499. 97%
Comparing Activity � Easily establish comparisons to identify potential issues ◦ ◦ Usage by Cardholder MCC Vendor Ability to perform monthly, quarterly, yearly comparisons
Fraud Examples ~ Executive Director, State CASA Association ~ “I cooked the books. ” “I had no fear. ” ~ Charged with 148 felony counts of embezzlement and 1 count of conspiracy. ~ Estimated loss: $650, 000 over 7 years. ~ Pretender – used stolen funds to buy lavish lifestyle. ~ Likelihood to Recover the Money? 0%
CASA issued credit card swiped for 3, 368 transactions totaling $471, 980. 50 from July 1, 2002 through November 21, 2008. Vendor Type of Business Transactions Amount Home Depot Home Improvement 83 $14, 249. 80 Kohl’s Dept. Store 76 $13, 820. 54 Foley’s Dept. Store 74 $10, 343. 53 Victoria’s Secret Women’s Wear 55 $ 6, 384. 87 E Bauer Clothing, accessories 39 $ 6, 259. 65 The Limu Co. Multi-level Marketing 31 $ 5, 285. 55 Total $56, 343. 94
More Questionable Expenses Unrelated to Association Business Cash Advances (5) $13, 000 Funjet Vacations (3) $ 4, 022 Cozumel Charges (22) $ 1, 964 Visiting Veterinarian (12) $ 1, 801
A Tale of Two Cities September 2008 September 8 Dahlia Lounge September 9 Northridge Medical Ctr. Florida September 9 Paul Meli, MD Florida September 10 Union Square Seattle, Washington $ 90. 00 $1, 600. 00 $1, 250. 00 $ 69. 00
Next steps • BOT / AI next? • Database linking defined in advance • Security testing • Continuous refinement
Skimming
Library of Data Analytics Tests CASH - SKIMMING Cash Receipts Analysis Review sequential numbering of cash receipts journal to ensure no out-of-sequence numbers Vertical Analysis Vertical analysis of sales accounts, (i. e. , cash as a percentage of total assets over time, etc. can be used to detect skimming at a high level) Horizontal Analysis Horizontal analysis of sales accounts, (i. e. , cash percent change over time, can be used to detect skimming at a high level) Current Ratio Analysis Track current assets to current liabilities over time Quick Ratio Analysis (Cash+Securities+Receivables) over Current Liabilities percent change over time Inventory Analysis Track inventory shrinkage due to unrecorded sales. Inventory detection may include statistical sampling, trend analysis, reviews of receiving reports and inventory records and verification for material requisition and shipping documentation as well as actual physical inventory counts Red Flags Bank employee questions the validity of a check Red Flags Inspect for a forged endorsement on a check Red Flags Inspect for an employee bank account with a name similar to the company name Red Flags Inspect for alteration of the check payee or endorsement Journal Entry Review Analysis of journal entries made to the cash and inventory accounts to identify: (1) False credits to inventory to conceal unrecorded or understated sales, (2) Write-offs related to lost, stolen or obsolete product, (3) Write-offs to accounts receivable, (4) Irregular entries to cash accounts Journal Entry Review Analysis of journal entries to review suspicous or inaccurate journal entries. Journal Entry Review Identify larger entries split into smaller entries to avoid exceeding their approval limit. To ensure authorization and validity of the Journal Entry based on the approval limits
Bid Rigging
Library of Data Analytics Tests BID RIGGING Corruption: Bid Rigging Compare inventory levels and turnover rates on a by project or by product basis, by region Corruption: Bid Rigging Inventory written-off and then new purchase made (total write-offs and quantities purchased by product) Corruption: Bid Rigging Compare contract awards by vendor (number of contracts won compared to bids submitted) Corruption: Bid Rigging Sole sourced contracts - number of bids per contract Corruption: Bid Rigging Check for vague contract specifications: (i) amendments, extension, increases in contract values, (ii) total number of amendments, (iii) original delivery date and final delivery date, (iv) original contract value and final contract value Corruption: Bid Rigging Check for split contract (same vendor, same day) Corruption: Bid Rigging Bids submitted after bid closing date Corruption: Bid Rigging Last bid wins Corruption: Bid Rigging Low bidder drops out, and subcontracts to higher bidder (compare contractor with invoice payee) Corruption: Bid Rigging Fictitious bids - verify bidders and prices
Fictitious Revenue
Library of Data Analytics Tests REVENUE RECOGNITION Bill & Hold Analysis of inventory that has been "segregated" or shipped to a third party intermediary where the customer has not taken title and assumed the risks, yet the company has booked this isolated inventory as revenue Bill & Hold Identify revenue and receivables recorded prior to shipment Channel Stuffing Compare discounts or incentives on a monthly basis to identify unusual spikes at the end of the quarter or year. Channel Stuffing Compare sales and corresponding returns on a per customer basis Debt Swap Identification of Journal Entries with Net Debit to Liability and Credit to Revenue Debt Swap Identification of Journal Entries with Net Debit to Liability and Credit to Expenses Fake Invoices Analysis of sequentially numbered invoices Fake Invoices Benford's analysis of the first two digits to identify anomalies such as a disproportionate number of invoices starting with 7, 8 or 9 Fake Invoices Analysis of company names that "sound like" known vendors Fake Invoices Examine inventory records to identify locations or items that require specific attention during or after the physical inventory count Revenue Recognition Analysis and anomaly detection of the sequence of transactions to identify missing checks, invoices Revenue Recognition Compare A/R credit memos to A/P invoices Revenue Recognition Compare revenue reported by month and by product line during the current period with comparable prior periods Revenue Recognition Confirm with selected, high risk customers relevant contract terms or question company staff regarding shipments near the end of the period Revenue Recognition Identification of revenue recognized at period end and subsequently reversed or partially reversed Fraud Triangle Analytics E-mail analysis of selected employees (accounting or sales) for "Rev Rec" related key words around incentive/pressure, opportunity and rationalization
Questions?