The Flow Viz Menu and Parallel Scatterplot Matrix


 Parallel Coordinates")
 and Node-Link Diagram to visualize a graph")


 Rotating around x- or y-axes causes a transition from Scatterplot")


![Scatterplot Staircase (SPLOS) Inspired partly by quilts [Watson et al. 2008] Sequence of scatterplots:](https://slidetodoc.com/presentation_image/25a69ffb8a97ac9a53729c0e393d056f/image-21.jpg "Scatterplot Staircase (SPLOS) Inspired partly by quilts [Watson et al. 2008] Sequence of scatterplots:")


 ADL: Layout based on a scatterplot selected in the Flow. Viz.")


 • Rotating around x- or y-axes causes a transition from")


- Slides: 44
The Flow. Viz. Menu and Parallel Scatterplot Matrix: Hybrid Multidimensional Visualizations for Network Exploration Christophe Viau, École de technologie supérieure, Montreal Michael J. Mc. Guffin, École de technologie supérieure, Montreal Yves Chiricota, Université du Québec à Chicoutimi, Chicoutimi Igor Jurisica, Ontario Cancer Institute, Toronto
Network exploration by graph metrics ?
Network exploration by graph metrics Computed metrics: • Degree
Network exploration by graph metrics Computed metrics: • Degree • Closeness centrality • Clustering coefficient • K-core decomposition • . . .
Network exploration by graph metrics Computed metrics: • Degree • Closeness centrality • Clustering coefficient • K-core decomposition • . . .
Multi-dimensional visualizations Scatterplot Matrix (SPLOM) Parallel Coordinates
Related work Using a Scatterplot Matrix (SPLOM) and Node-Link Diagram to visualize a graph Graph. Dice [Bezerianos et al. , 2010]
Related work Integration of scatterplots and parallel coordinates Yuan et al. , 2009 Steed et al. , 2009 Holten and van Wijk, 2010
Our proposed interface
Our proposed interface Parallel Scatterplot Matrix
Our proposed interface Flow. Viz. Menu Parallel Scatterplot Matrix
Our proposed interface Attribute-Driven Layout Flow. Viz. Menu Parallel Scatterplot Matrix
A sequence of scatterplots
A sequence of scatterplots
Rotating scatterplots around the y-axis
Rotating scatterplots around the y-axis
Rotating scatterplots around the y-axis
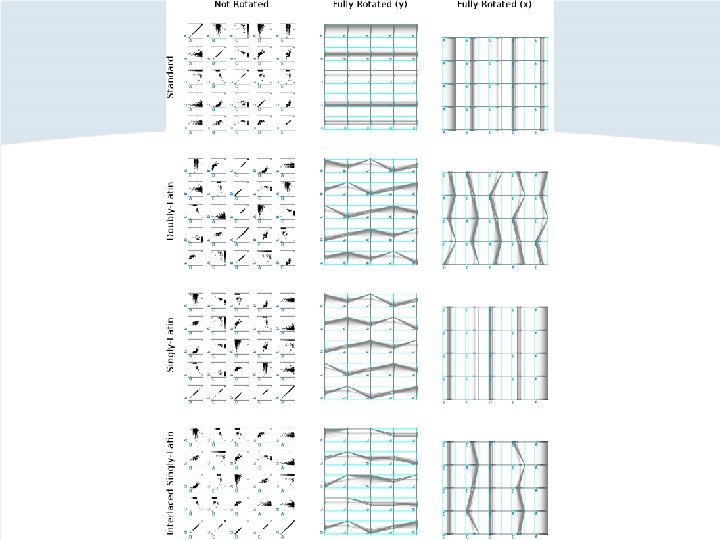
Parallel Scatterplot Matrix (P-SPLOM) Rotating around x- or y-axes causes a transition from Scatterplot Matrix (SPLOM) to stacked Parallel Coordinates. Scatterplot Matrix (SPLOM) Parallel Coordinates
Ordering of axes within P-SPLOM Problem: traditional SPLOM ordering doesn’t yield useful parallel coordinates. Axes are repeated in each row and column Repeated axes: useless for parallel coordinates
Ordering of axes within P-SPLOM Solution: order the axes according to a Latin square. Each row and column contains each axis once. Useful parallel coordinates
Scatterplot Staircase (SPLOS) Inspired partly by quilts [Watson et al. 2008] Sequence of scatterplots: treats one dimension differently. Scatterplot Staircase (SPLOS): all dimensions treated uniformly; every adjacent pair of plots share an axis. Parallel coordinates: more difficult to judge correlations than in scatterplots [Li et al. , 2010]
Flow. Viz. Menu • Variant of a Flow. Menu with embedded visualization • Smoothly animated transitions • Brushing and linking • More than two dimensions possible with PCA
Flow. Viz. Menu In-out gesture to quickly select axes of scatterplot
Attribute-Driven Layout (ADL) ADL: Layout based on a scatterplot selected in the Flow. Viz. Menu. The network layout can be a mixture of • Attribute-Driven Layout (ADL) • Manual layout • Force-directed layout
Demo
Initial user feedback Five bioinformaticians used our prototype and gave feedback. All had experience working with network data. Results: Pros: • Exploring along multiple metrics, smooth transitions, and integration of views were judged useful • All participants stated they would use the interface if it were made available to them Cons: • Some pairings of metrics within the scatterplots may not be useful • Too many hotkeys + button combinations in the current prototype
Contributions: Three hybrid multidimensional visualization techniques for visualizing networks
Contributions: Three hybrid multidimensional visualization techniques for visualizing networks • A Parallel Scatterplot Matrix (P-SPLOM) that transitions between a scatterplot matrix and parallel coordinates
Contributions: Three hybrid multidimensional visualization techniques for visualizing networks • A Parallel Scatterplot Matrix (P-SPLOM) that transitions between a scatterplot matrix and parallel coordinates
Contributions: Three hybrid multidimensional visualization techniques for visualizing networks • A Parallel Scatterplot Matrix (P-SPLOM) that transitions between a scatterplot matrix and parallel coordinates • A Flow. Viz. Menu to quickly select the dimensions for an embedded scatterplot
Contributions: Three hybrid multidimensional visualization techniques for visualizing networks • A Parallel Scatterplot Matrix (P-SPLOM) that transitions between a scatterplot matrix and parallel coordinates • A Flow. Viz. Menu to quickly select the dimensions for an embedded scatterplot
Contributions: Three hybrid multidimensional visualization techniques for visualizing networks • A Parallel Scatterplot Matrix (P-SPLOM) that transitions between a scatterplot matrix and parallel coordinates • A Flow. Viz. Menu to quickly select the dimensions for an embedded scatterplot • An Attribute-Driven Layout to configure the graph according to a scatterplot of graph metrics
Future directions • Application to other domains • Evaluation of performance and usability • Exploration of the design space of each visualization (e. g. , on a small screen)
Acknowledgments We thank our collaborators for their feedback: • SAP Business Objects • Members of Jurisica Lab at OCI • Members of the Multimedia Lab at ETS This research was funded by an SAP Business Objects ARC Fellowship, NSERC, and the FQRNT.
Thank you
P-SPLOM: variants
P-SPLOM: Pearson correlation coefficient
P-SPLOM: Latin square
P-SPLOM: another latin square
Scatterplot Staircase
Parallel Scatterplot Matrix (P-SPLOM) • Rotating around x- or y-axes causes a transition from Scatterplot Matrix (SPLOM) to stacked Parallel Coordinates
Ordering of axes within P-SPLOM The traditional SPLOM ordering doesn’t produce interesting parallel coordinates Repeated axes: useless for parallel coordinates
P-SPLOM ordering • We explored variants of latin square