
The FiveNumber Summary Lecture 16 Sec 5 3
The Five-Number Summary Lecture 16 Sec. 5. 3. 1 – 5. 3. 3 Tue, Feb 12, 2008
The Five-Number Summary n n A five-number summary of a sample or population consists of five numbers that divide the sample or population into four equal parts. These numbers are called the quartiles. ¨ 0 th Quartile = minimum. ¨ 1 st Quartile = Q 1. ¨ 2 nd Quartile = median. ¨ 3 rd Quartile = Q 3. ¨ 4 th Quartile = maximum.

Example n If the distribution were uniform from 0 to 10, what would be the five-number summary? 0 1 2 3 4 5 6 7 8 9 10
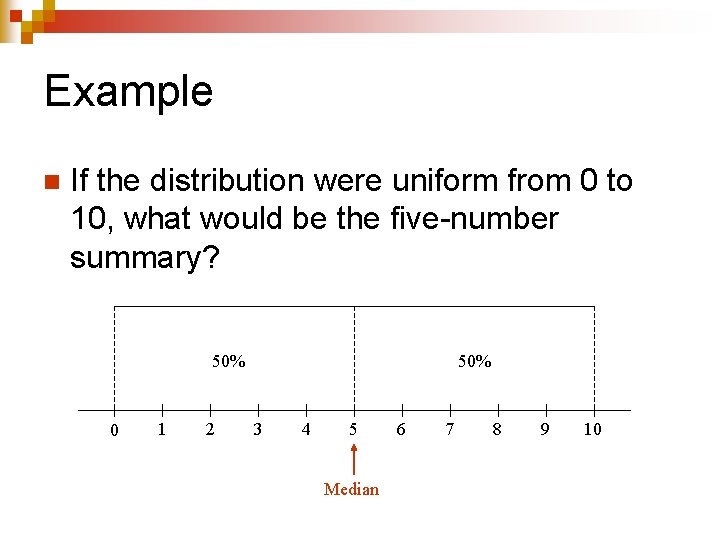
Example n If the distribution were uniform from 0 to 10, what would be the five-number summary? 50% 0 1 2 50% 3 4 5 Median 6 7 8 9 10
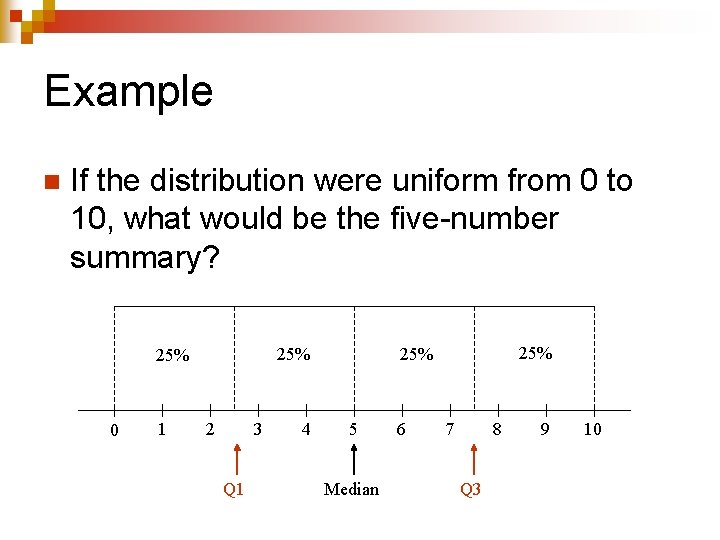
Example n If the distribution were uniform from 0 to 10, what would be the five-number summary? 0 1 2 3 Q 1 4 25% 25% 5 Median 6 7 8 Q 3 9 10
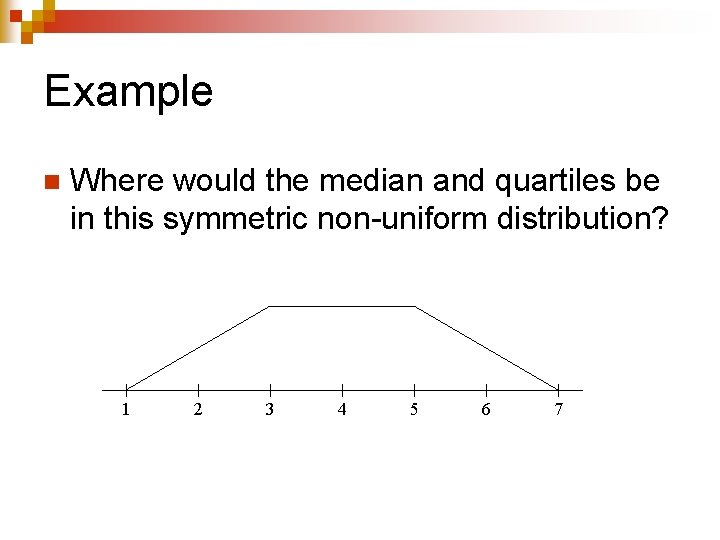
Example n Where would the median and quartiles be in this symmetric non-uniform distribution? 1 2 3 4 5 6 7
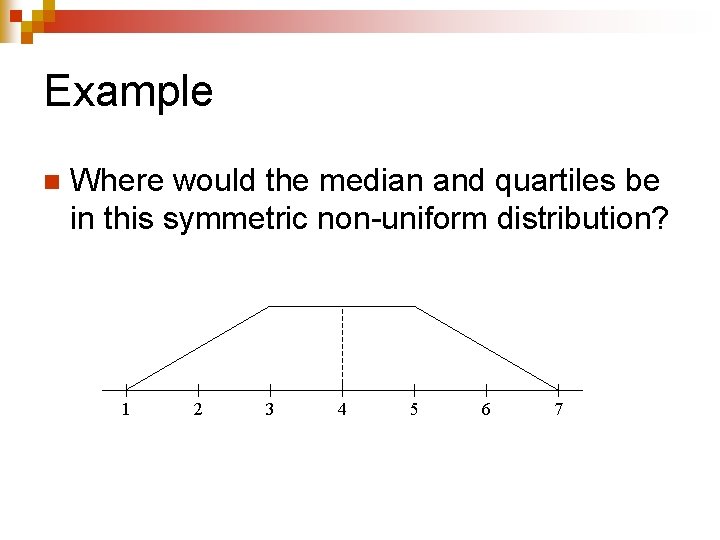
Example n Where would the median and quartiles be in this symmetric non-uniform distribution? 1 2 3 4 5 6 7
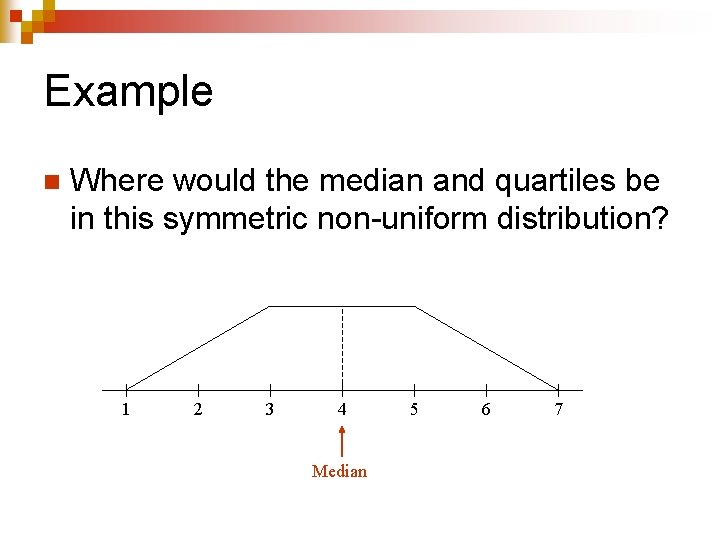
Example n Where would the median and quartiles be in this symmetric non-uniform distribution? 1 2 3 4 Median 5 6 7
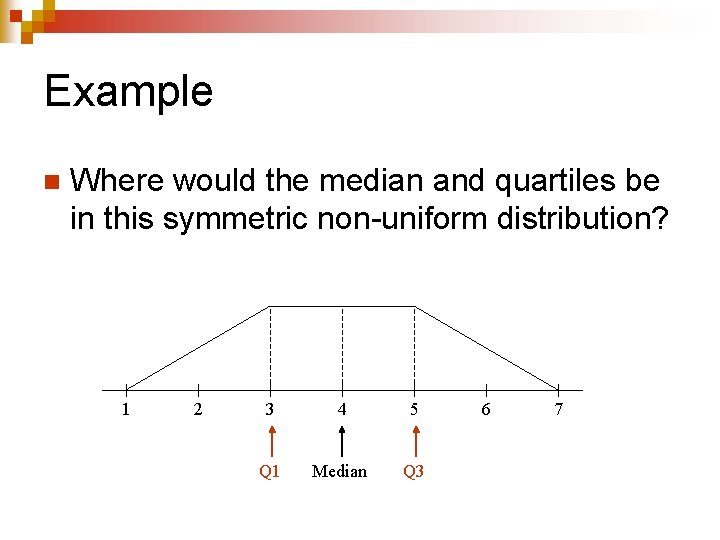
Example n Where would the median and quartiles be in this symmetric non-uniform distribution? 1 2 3 4 5 Q 1 Median Q 3 6 7
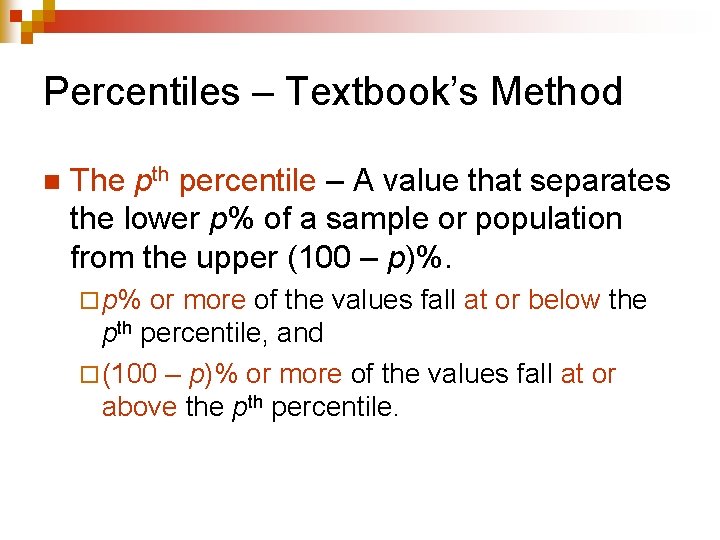
Percentiles – Textbook’s Method n The pth percentile – A value that separates the lower p% of a sample or population from the upper (100 – p)%. ¨ p% or more of the values fall at or below the pth percentile, and ¨ (100 – p)% or more of the values fall at or above the pth percentile.
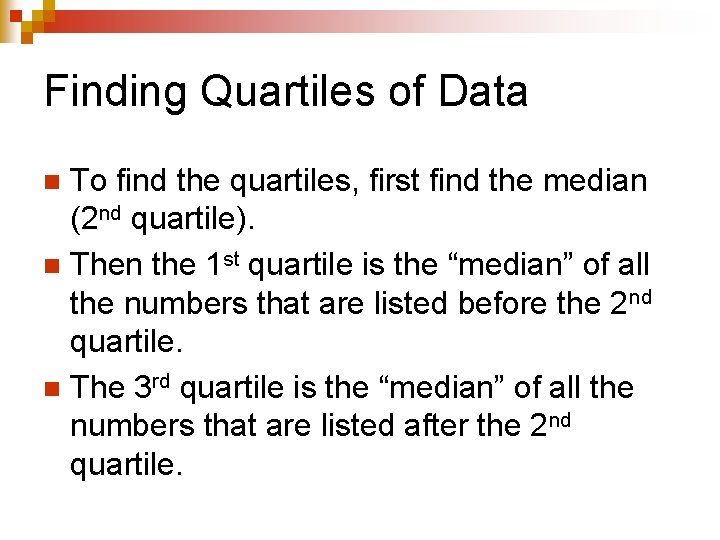
Finding Quartiles of Data To find the quartiles, first find the median (2 nd quartile). n Then the 1 st quartile is the “median” of all the numbers that are listed before the 2 nd quartile. n The 3 rd quartile is the “median” of all the numbers that are listed after the 2 nd quartile. n
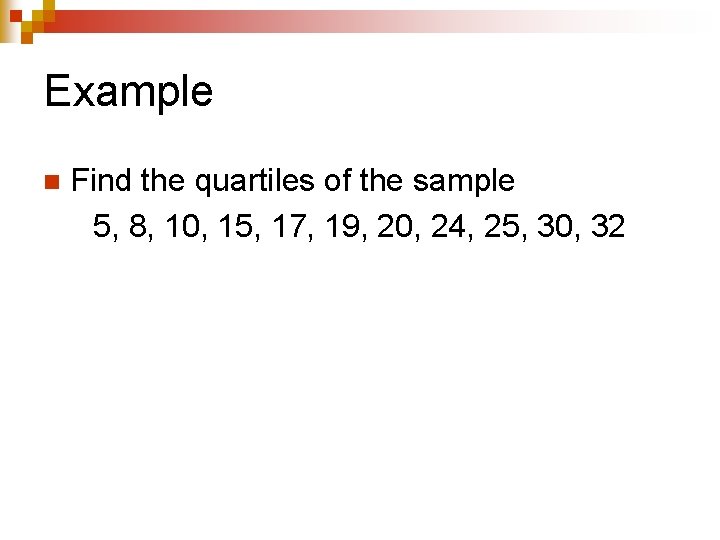
Example n Find the quartiles of the sample 5, 8, 10, 15, 17, 19, 20, 24, 25, 30, 32
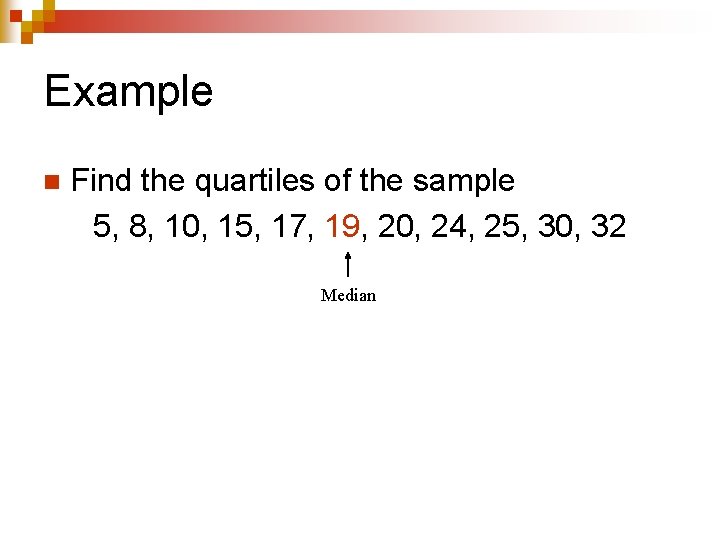
Example n Find the quartiles of the sample 5, 8, 10, 15, 17, 19, 20, 24, 25, 30, 32 Median
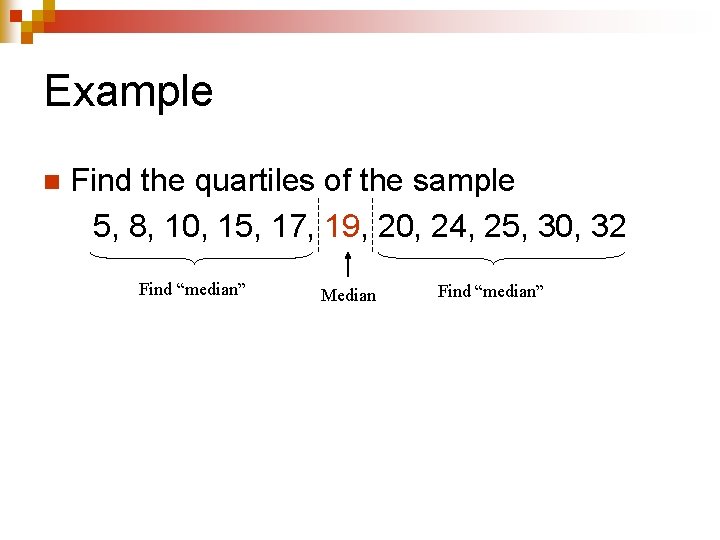
Example n Find the quartiles of the sample 5, 8, 10, 15, 17, 19, 20, 24, 25, 30, 32 Find “median” Median Find “median”
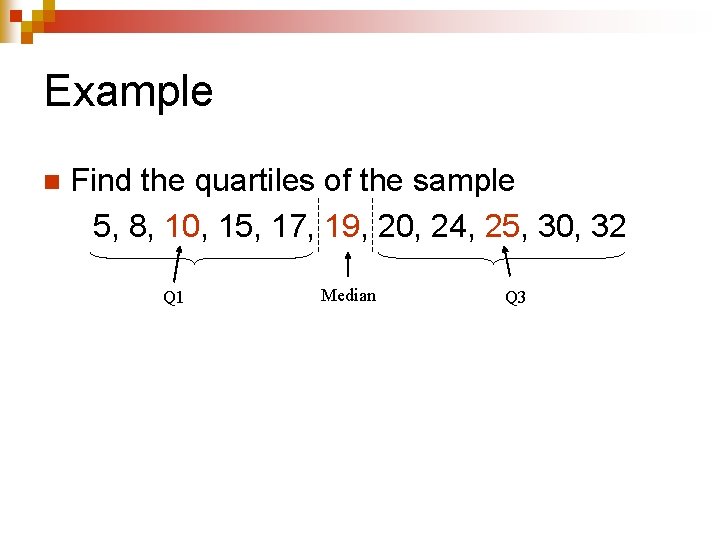
Example n Find the quartiles of the sample 5, 8, 10, 15, 17, 19, 20, 24, 25, 30, 32 Q 1 Median Q 3
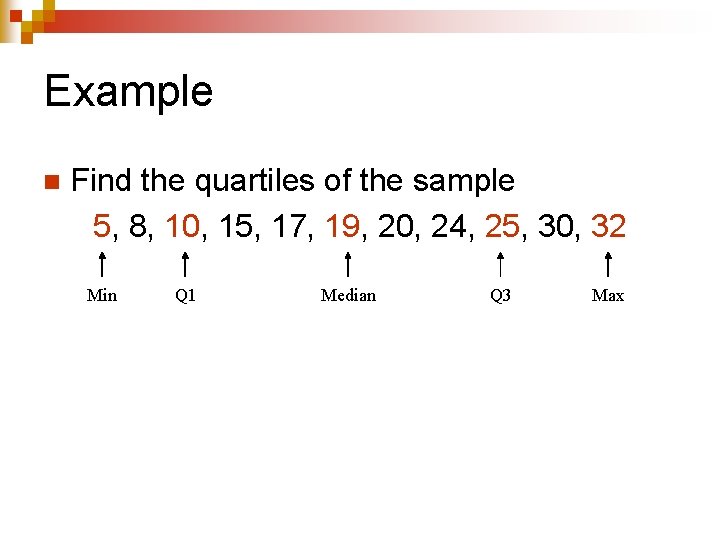
Example n Find the quartiles of the sample 5, 8, 10, 15, 17, 19, 20, 24, 25, 30, 32 Min Q 1 Median Q 3 Max
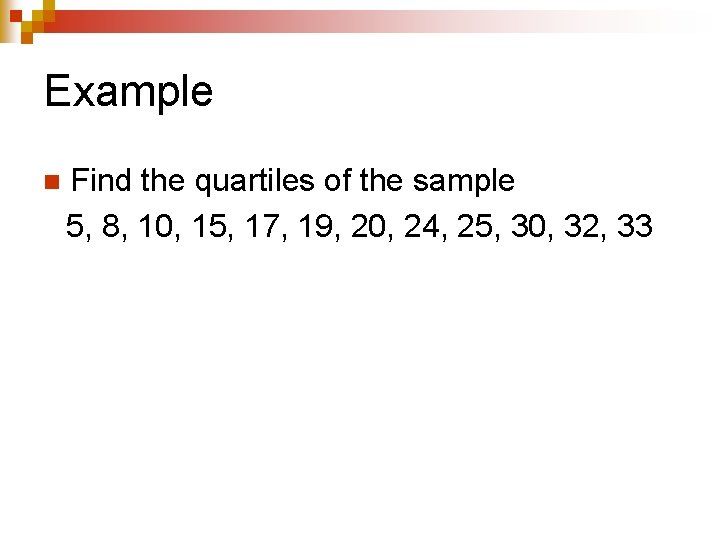
Example n Find the quartiles of the sample 5, 8, 10, 15, 17, 19, 20, 24, 25, 30, 32, 33
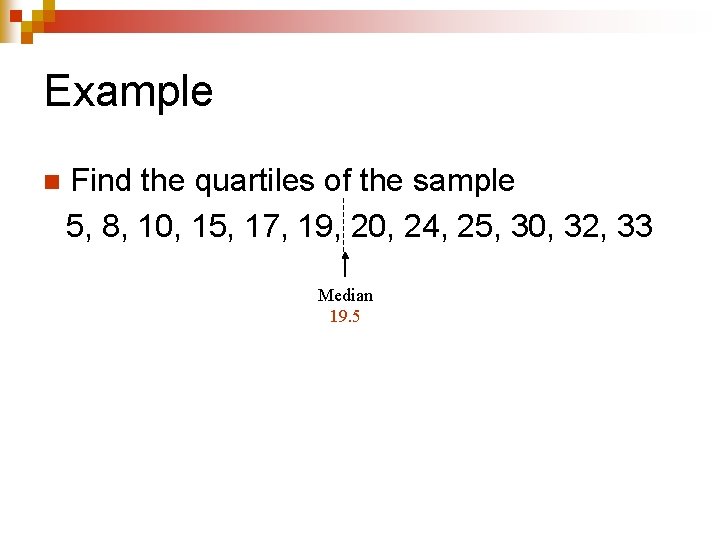
Example n Find the quartiles of the sample 5, 8, 10, 15, 17, 19, 20, 24, 25, 30, 32, 33 Median 19. 5
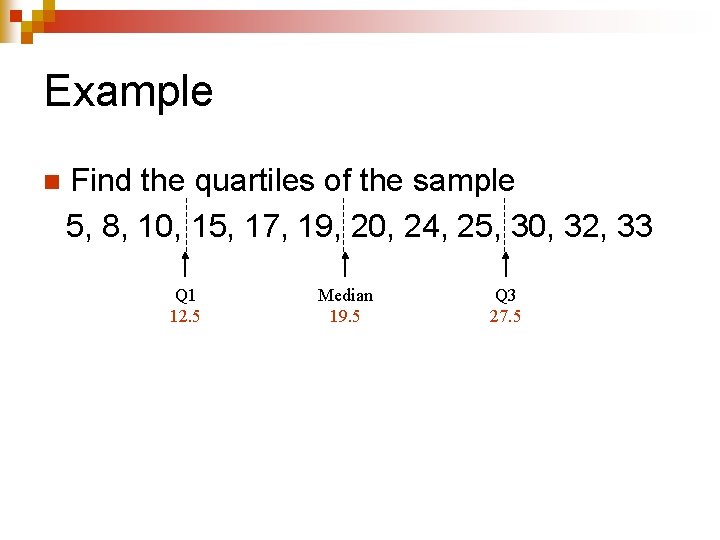
Example n Find the quartiles of the sample 5, 8, 10, 15, 17, 19, 20, 24, 25, 30, 32, 33 Q 1 12. 5 Median 19. 5 Q 3 27. 5
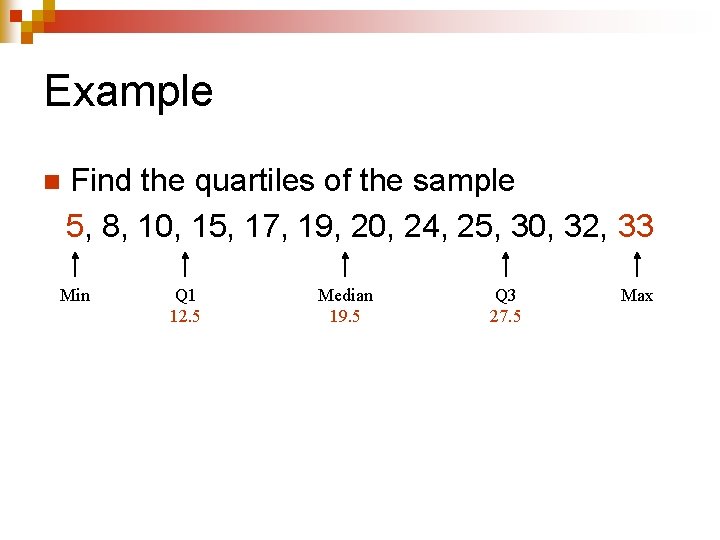
Example n Find the quartiles of the sample 5, 8, 10, 15, 17, 19, 20, 24, 25, 30, 32, 33 Min Q 1 12. 5 Median 19. 5 Q 3 27. 5 Max
The Interquartile Range The interquartile range (IQR) is the difference between Q 3 and Q 1. n The IQR is a commonly used measure of spread, or variability. n Like the median, it is not affected by extreme outliers. n
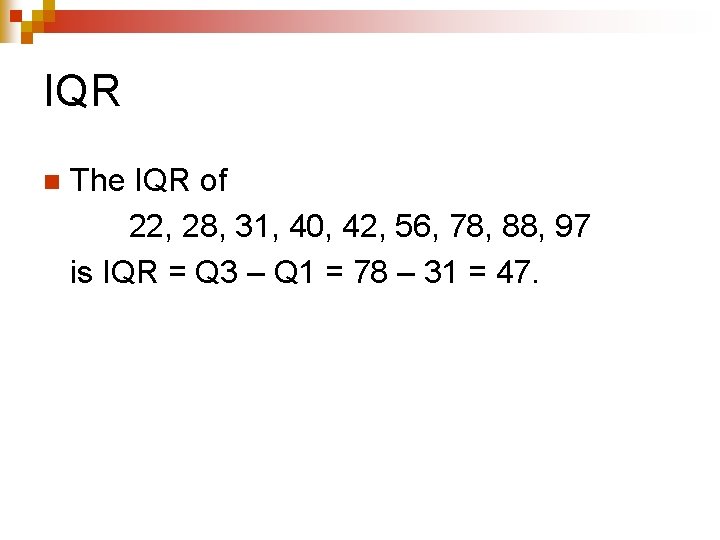
IQR n The IQR of 22, 28, 31, 40, 42, 56, 78, 88, 97 is IQR = Q 3 – Q 1 = 78 – 31 = 47.
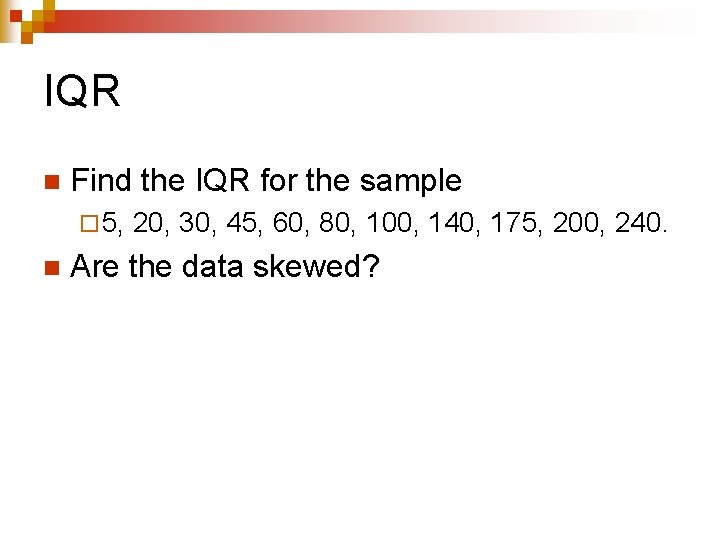
IQR n Find the IQR for the sample ¨ 5, n 20, 30, 45, 60, 80, 100, 140, 175, 200, 240. Are the data skewed?
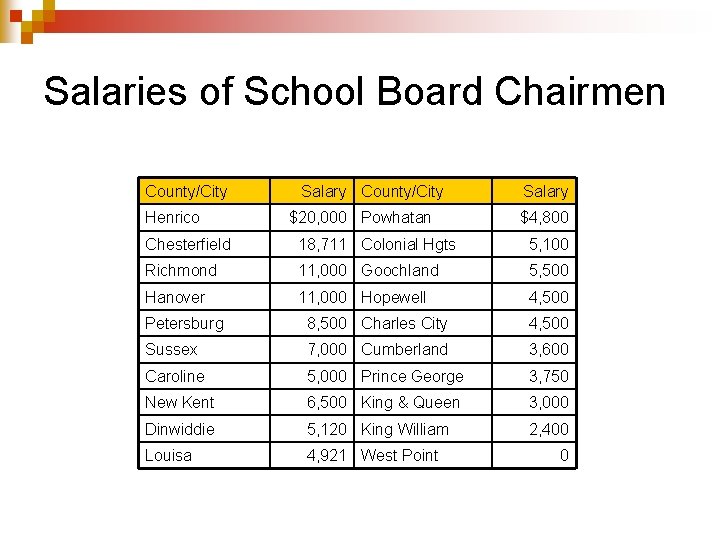
Salaries of School Board Chairmen County/City Henrico Salary County/City $20, 000 Powhatan Salary $4, 800 Chesterfield 18, 711 Colonial Hgts 5, 100 Richmond 11, 000 Goochland 5, 500 Hanover 11, 000 Hopewell 4, 500 Petersburg 8, 500 Charles City 4, 500 Sussex 7, 000 Cumberland 3, 600 Caroline 5, 000 Prince George 3, 750 New Kent 6, 500 King & Queen 3, 000 Dinwiddie 5, 120 King William 2, 400 Louisa 4, 921 West Point 0
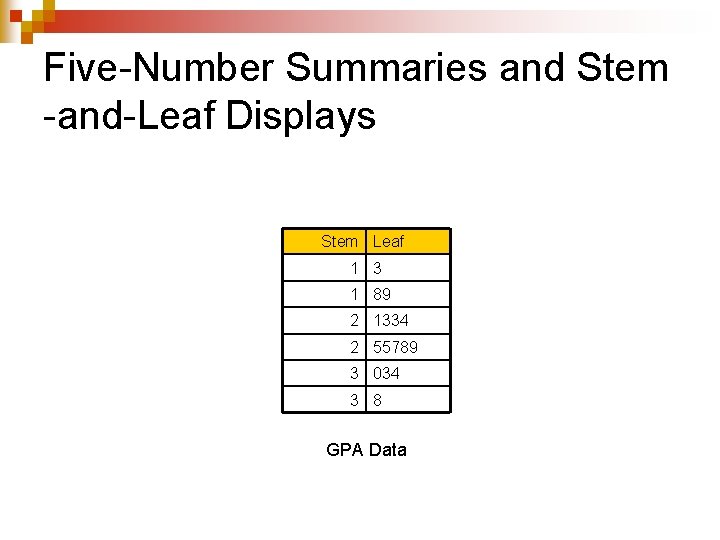
Five-Number Summaries and Stem -and-Leaf Displays Stem Leaf 1 3 1 89 2 1334 2 55789 3 034 3 8 GPA Data
- Slides: 25