The Exponential Logarithmic Functions Exponential Growth Decay Worked


log 381 = 4 (b)log 42 = (c)log 3")

 log 102 + log 10500 b) log 363 – log")
 Since")


 = 50 e-2 t: a) evaluate P(0) b) for what")
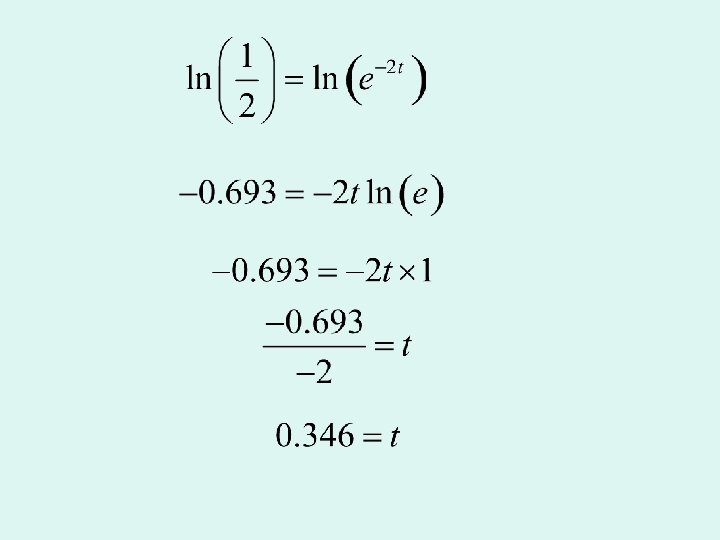


 How long does it take for the substance to reduce to half it")


 Show that y")
 Taking logs of x and y gives: 1. 69 1. 32 2. 28")
Since the points lie on a straight line, we can say that: If Then")


- Slides: 28
The Exponential & Logarithmic Functions
Exponential Growth & Decay Worked Example: Joan puts £ 2500 into a savings account earning 13% interest per annum. How much money will she have if she leaves it there for 15 years? Let £A(n) be the amount in her account after n years, then:
Example 1: The population of an urban district is decreasing at the rate of 2% per year. (a) Taking P 0 as the initial population, find a formula for the population, Pn, after n years. (b) How long will it take for the population to drop from 900 000 to 800 000? ? (a) Suggests that
Using our formula And setting up the graphing calculator In the fifth year the population drops below 800 000
Example 2: The rabbit population on an island increases by 15% each year. How many years will it take for the population to at least double? Let Set be the initial population After 4 years the population doubles
A Special Exponential Function – the “Number” e The letter e represents the value 2. 718…. . (a never ending decimal). This number occurs often in nature f(x) = 2. 718. . x = ex is called the exponential function to the base e. Although we now think of logarithms as the exponents to which one must raise the base to get the required number, this is a modern way of thinking. In 1624 e almost made it into the mathematical literature, but not quite. In that year Briggs gave a numerical approximation to the base 10 logarithm of e but did not mention e itself in his work. Certainly by 1661 Huygens understood the relation between the rectangular hyperbola and the logarithm. He examined explicitly the relation between the area under the rectangular hyperbola yx = 1 and the logarithm. Of course, the number e is such that the area under the rectangular hyperbola from 1 to e is equal to 1. This is the property that makes e the base of natural logarithms, but this was not understood by mathematicians at this time, although they were slowly approaching such an understanding
Example 3: The mass of a fixed quantity of radioactive substance decays according to the formula m = 50 e-0. 02 t, where m is the mass in grams and t is the time in years. What is the mass after 12 years?
Linking the Exponential Function and the Logarithmic Function In chapter 2. 2 we found that the exponential function has an inverse function, called the logarithmic function. The log function is the inverse of the exponential function, so it ‘undoes’ the exponential function:
2 3 4 Example 4: (a)log 381 = 4 (b)log 42 = (c)log 3 “…. 3 to what power gives 81 …. ? ” “…. 4 to what power gives 2…. ? ” = -3 “…. 3 to what power gives …. ? ”
Rules of Logarithms Rules for indices: Rules for Logs:
Example 5: Simplify: a) log 102 + log 10500 b) log 363 – log 37 Since
c) Since
Using your Calculator You have 2 logarithm buttons on your calculator: log which stands for log 10 and its inverse log ln which stands for loge and its inverse ln Try finding log 10100 on your calculator 2
Solving Exponential Equations Solve 51 = 5 and 52 = 25 so we can see that x lies between ……and…………. . 1 2 Taking logs of both sides and applying the rules
For the formula P(t) = 50 e-2 t: a) evaluate P(0) b) for what value of t is P(t) = ½P(0)? a) b) Could we have known this?
Example The formula A = A 0 e-kt gives the amount of a radioactive substance after time t minutes. After 4 minutes 50 g is reduced to 45 g. (a) Find the value of k to two significant figures. (b) How long does it take for the substance to reduce to half it original weight? (a) Take logs of both sides
remember
(b) How long does it take for the substance to reduce to half it original weight?
Experiment and Theory When conducting an experiment scientists may analyse the data to find if a formula connecting the variables exists. Data from an experiment may result in a graph of the form shown in the diagram, indicating exponential growth. A graph such as this implies a formula of the type y = kxn
We can find this formula by using logarithms: If Then So Compare this to So Is the equation of a straight line
From We see by taking logs that we can reduce this problem to a straight line problem where: So And
Worked Example: The following data was collected during an experiment: a) Show that y and x are related by the formula y = kxn. b) Find the values of k and n and state the formula that connects x and y.
a) Taking logs of x and y gives: 1. 69 1. 32 2. 28 1. 67 Plotting these points 2. 70 1. 92 2. 84 2. 00 We get a straight line and hence the formula connecting X and Y is of the form
b)Since the points lie on a straight line, we can say that: If Then So Compare this to
By selecting points on the graph and substituting into this equation we get using Subtract So
So we have Compare this to so and solving so You can always check this on your graphics calculator