The Exponential Logarithmic Functions Exponential Graph Logarithmic Graph
 (1 ,")


 = 2 x 2 to what")


 ? ” (b) ? ” (c)")

 log 102")


 on curve 2 = log")


 Write down")

 i) Sketch the graph of ii) On the same diagram, sketch b) Prove")
- Slides: 44
The Exponential & Logarithmic Functions Exponential Graph Logarithmic Graph (a , 1) (1 , 0) (1 , a) (0 , 1) y = ax y = logax
Exponential Growth & Decay Joan puts £ 2500 into a savings account earning 13% interest per annum. How much money will she have if she leaves. Multiplying it there forfactor 15 years? is 1∙ 13 Let theinitial amount in her account after n years, The investment A(0) = 2£A(n) 500 be then: A(1) = 2 500 × 1∙ 13 After 1 year A(2) = 2 500 × 1∙ 132 A(15) = 2 500 × 1∙ 1315 A(3) = 2 500 × 1∙ 133 A(n) = 2 500 × 1∙ 13 n After n years = £ 15 635· 68
The population of an urban district is decreasing at the rate of 2% per year. Multiplying factor is 0∙ 98 (a) Taking P 0 as the initial population, find a formula the population, Pn, after. Pnn=years. P 0 for The initial population 800 000, P 0 = 900 000 n× 900 P 1 (b) = 0∙ 98×P 0∙ 98 000 = 882 000 How long will it take for the population to drop 0 from 900 000 to 800 000? 2×P P = 0∙ 98 n× 882 000 = 864 360 2 0 P 3 = 0∙ 983×P 0 Pn = 0∙ 98 n×P 0 Population after n years And so on Takes 5 years to drop below 800 000
A Special Exponential Function – the “Number” e The letter e represents the value 2· 71828. . Exponential functions are used to model populations, carbon date artifacts, help coroners determine time of death, compute x = ex f(x) = 2· 718. . investments. is called the exponential function to the base e.
The mass of a fixed quantity of radioactive substance decays according to the formula m = – 0∙ 02 t -0∙ 02 t m = 50 e 50 e , where m is the mass in grams and t is the time in years. – 0∙ 02× 12 m = 50 e What is the mass after 12 years? m = 50 e – 0∙ 24 m = 39∙ 3 grams
Linking the Exponential and Logarithmic Function loga 1 = 0 y = ax y=x a 0 = 1 loga a = 1 a 1 = a loga y = x ax = y (0, 1) (1, 0) y = logax The log Thefunction log function and the is the exponential inverse offunctions the exponential are reflections function, of each so other it ‘undoes’ in theor line reverses y=x
Linking the Exponential and the Log Function f(x) = 2 x 2 to what power gives the required number? f(1) → 2 21 so log 22 = 1 f(2) → 4 22 so log 24 = 2 f(3) → 8 23 so log 28 = 3 f(4) → 16 24 so log 216 = 4 f(x) = log 2 x
Linking the Exponential and the Log Function It is useful to remember a basic connection 3 2 =8 log 2 8 = 3
Linking the Exponential and the Log Function 23 = 8 ↔ log 28 = 3 Examples: 1) 72 = 49 ↔ log 749 = 2 2) log 101000 = 3 ↔ 103 = 1000 3) log 5125 = 3 ↔ 53 = 125 4) 27 = ↔ log 2128 = 7 5) 35 = 243 ↔ log 3243 = 5 128
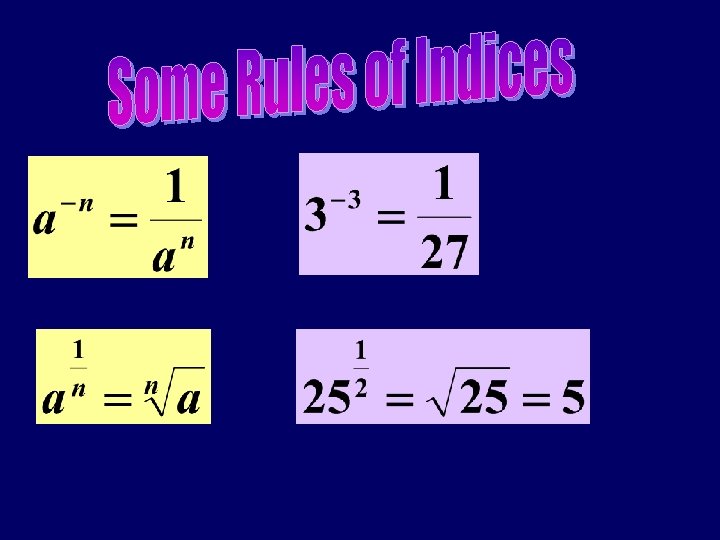
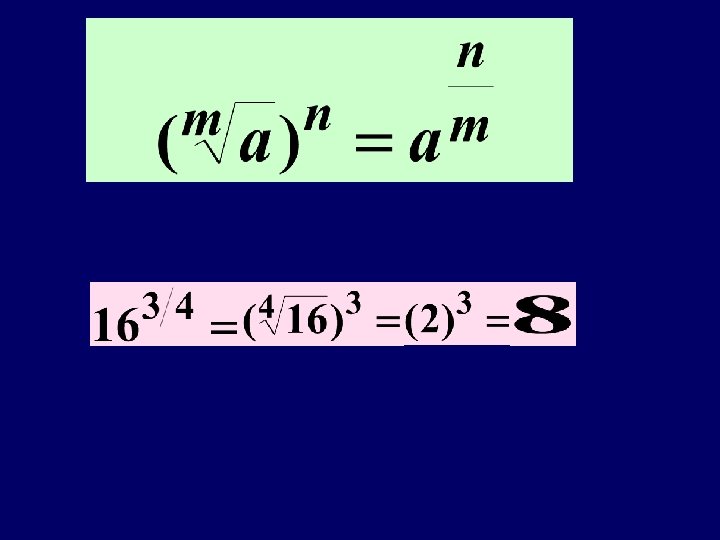
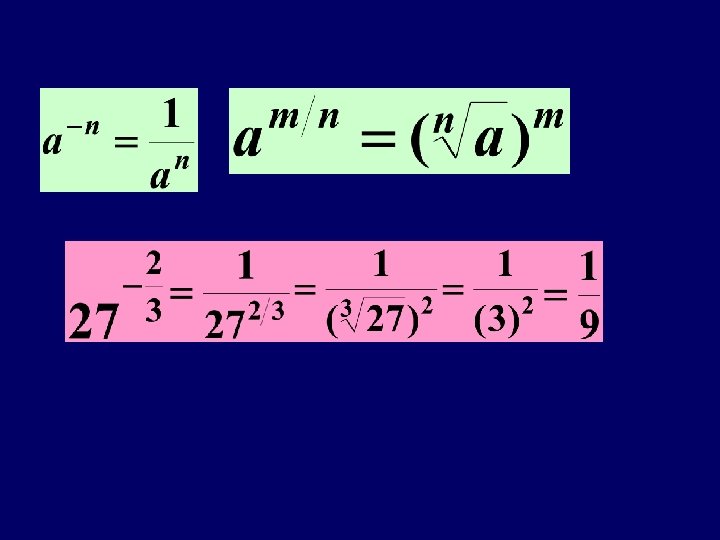
Examples : Simplify the following
34 = 81 √ 4 = 2 (a) ? ” (b) ? ” (c) ? ” log 381 =4 1/ log 42 = log 3 √ 4 = 41/ 2 “ 3 to what power gives 81 1/ 3 = 3 -3 = 27 3 “ 41 to what power gives 2 =-3 / “ 32 to what power gives
Rules of Logarithms logax + logay = logaxy x logax – logay = loga /y logaxn = n logax
Rules of Logarithms Examples loga. Simplify: x + logay = logaxy a) log 102 + log 10500 = log 10 2× 500 logax – logay = logax/y b) log 363 – log 37 = log 363/7 = log 10 1000 = log 3 9 = log 10 (10)3 = log 3 (3)2 =3 =2
Simplify logaxn = n logax = logaxn logax – logay = logax/y = log 2 (2)1
Using your Calculator log You have 2 logarithm buttons on your calculator: which stands for ln log 10 which stands for loge x xits inverse and e 10 and its inverse
Using your Calculator 23 = 8 log 2 8 = 3 23 = 8 1) log 10 x = 3∙ 5 x = 10 3∙ 5 x = 3162 2) ln x = 3∙ 5 x = e 3∙ 5 x = 33∙ 1 3) e x = 47 loge 47 = x ln 47 = x x = 3∙ 85 4) 10 x = 78 log 10 78 = x x = 1∙ 89
S Solving Exponential Equations o loga xn = n loga x l v Take logs of both sides e log 5 x = log 32 ln 5 x = ln 32 5 x x log 5 = log 32 x ln 5 = ln 32 = x = log 32 ÷ log 5 x = ln 32 ÷ ln 5 3 2 x = 2∙ 15
S Solving Exponential Equations o loga xn = n loga x l v Take logs of both sides e log 7 x = log 90 ln 7 x = ln 90 7 x x log 7 = log 90 x ln 7 = ln 90 = x = log 90 ÷ log 7 x = ln 90 ÷ ln 7 9 0 x = 2∙ 31
Solving Exponential Equations If the equation involves 10 x or ex then we do not need to take logs of both sides. Just “undo” the power using 23 = 8 log 28 = 3 ex = 34 x = ln 34 = 3∙ 53 e 5 p = 187 5 p = ln 187 = 5∙ 23 p = 5∙ 23 ÷ 5 = 1∙ 05 6 e 1∙ 8 x = 906 e 1∙ 8 x = 151 1∙ 8 x = ln 151 x = 2∙ 79
The formula A = A 0 e-kt gives the amount of a radioactive substance after time t minutes. After 4 minutes 50 g is reduced to 45 g. t = 4 significant A = 45 g When t =(a) 0 AFind = A 0 the = 50 g value of. When k to two Afigures. = 50 e – kt 45 = 50 e – k× 4 – 4 k = 0∙ 9 45/50 = esubstance (b) How long does it take for the to reduce to half it original weight? ln 0∙ 9 = – 4 k k = ln 0∙ 9 ÷ – 4 = 0∙ 026
The formula A = A 0 e-kt gives the amount of a radioactive substance after time t minutes. After 4 minutes 50 g is reduced to 45 g. – 0∙ 026 t When A =(a)1/2 Find A 0 = the 25 gvalue of 25 = 50 e k to two significant figures. 25/50 = e – 0∙ 026 t = 0∙ 5 (b) How long does it take lnfor 0∙ 5 the = –substance 0∙ 026 t to reduce to half it original weight? t = ln 0∙ 5 ÷ – 0∙ 026 = 26∙ 7 mins
Experiment and Theory y When conducting an experiment scientists may analyse the data to find if a formula connecting the variables exists. Data from an experiment may result in a graph of the form shown in the diagram, indicating exponential growth. A graph such as this implies a x
We can convert y = kxn log xy = log x + log y using logarithms: log x n = n log x T lo ga log y gyke y= lo Gradient n = gs lo (0 , log k) n gon lo lo b gkx Compare this n n gxot to y = mx + c a hkxn is converted into a y =x+ straight line log x + si line using logarithms lo straight
x y 50∙ 1 20∙ 9 194∙ 9 46∙ 8 501∙ 2 83∙ 2 707∙ 9 102∙ 3 The following data was collected during an l experiment: og 1∙ 2∙ y 120 n k 32 01 ∙ 9 02 = y and x are related by the formula y = kxn, find the = n ∙ 3 0∙ 2∙ values of k and n and state the formula that n lo = 06, connects x and y. × g n lo 1∙ x lo g 2∙ 0∙ 3 y = 2 x 70 85 + g 50 k + lo 7∙ 1 =
Variables x and y are related by the equation kxn. Find the values of k and n. log 2 y = log 2 kxn 5 = 32 log k = 5 k = 2 2 log 2 y = log 2 xn + log 2 k log 2 y = nlog 2 x + log 2 k n = 0∙ 5 y=
The size of the human population, N, can be modelled using the equation N = N 0 ert where N 0 is the population in 2006, t is the time in years since 2006, and r is the annual rate of increase in the population. N = Noert No = 61 million, r = 1∙ 6, t = 14 (a) In 2006 the population of the United Kingdom was approximately 61 million, with an annual rate of increase of Assuming rate remains what 14 =this 0∙ 224 N =1∙ 6%. 61 e 0∙ 016 61 egrowth = 61× 1∙ 251 constant, = 76∙ 3 million would be the population in 2020?
The size of the human population, N, can be modelled using the equation N = N 0 ert where N 0 is the population in 2006, t is the time in years since 2006, and r is the annual rate of increase in the population. rt No =population 5∙ 1 million, r = 0∙ 43, was N approximately = 10∙ 2 million 5∙ 1 N =(b)NIn e of Scotland o 2006 the million, with an annual rate oft increase of 0. 43%. Assuming 0∙ 0043 t 0∙ 0043 10∙ 2 =this 5∙ 1 e 2 = e constant, how ln 2 long = 0∙ 0043 growth rate remains would itt take for size? t = ln 2 ÷ 0∙ 0043 Scotland’s population to double in t = 161 years
Two variables x and y satisfy the equation y = 3 × 4 x. x. (a) Find the value of a if (a, 6) lies on y = 3 × 4 a a a) 6 = 3 4 2=4 a=½ (b) If (-1/2, b ) also lies on the graph, find b. b) b(c)= A 3 graph 4 -1/2 is drawn b of = log 3 1 y/√ 4 against x. b Show = 11/2 that its 10 equation will be of the form log 10 y = Px + Q and state the x x log y = log 3 + log 4 c) log y = log 3 4 gradient of this line. 10 10 10 log 10 y = log 103 + xlog 104 Gradient = log 104
It is claimed that a wheel made from wood is over 1000 years old. Carbon dating is used to test the claim, using the formula -0∙ 000124 t A(t) = 0∙ 88 Ao = Aoe A(t) = Aoe - 0∙ 000124 t to determine the age of the wood. Ao is -0∙ 000124 t 0∙ 88 = e the amount of carbon in any living tree, A(t) is the amount of loge 0∙ 88 = – 0∙ 000124 t carbon after t years. For the wheel it was found that A(t) was 0∙ 88 in ÷ –a living 0∙ 000124 88% of the amountt = ofln carbon tree. Is the claim true? t = 1031 Claim true
This is the graph of y = 2 mx What is the value of m? (3 , 54) on curve 54 = 2 m 3 27 = m 3 m=3
What is the value of q? (q , 2) on curve 2 = log 3(q – 4) 23 = q – 4 8=q– 4 q = 12
loga x + loga y loga xy loga x – loga y loga x/y loga xn n loga x loga 1 = 0 loga a = 1 You must know and use these rules in both directions
Linking the Exponential and Logarithmic Function loga 1 = 0 y = ax y=x a 0 = 1 loga a = 1 a 1 = a loga y = x ax = y (0, 1) (1, 0) y = logax The log Thefunction log function and the is the exponential inverse offunctions the exponential are reflections function, of each so other it ‘undoes’ in theor line reverses y=x
Simplify log 5 2 + log 5 50 – log 5 4 loga x + loga y = loga xy 52 = 25 loga x – loga y = loga x/y
Find x if 4 logx 6 – 2 logx 4 = 1 n loga x = loga xn 4 logx 6 – 2 logx 4 = 1 loga x – loga y = loga x/y
Given x = log 5 3 + log 5 4 find algebraically the value of x. Take logs on both sides log 10 works just as well
The graph illustrates the law y = kxn If the straight line passes through A(0∙ 5, 0) and B(0, 1). Find the values of k and n. log 5 y = log 5 kxn log 5 y = log 5 k + log 5 xn log 5 y = log 5 k + n log 5 x log 5 y = n log 5 x + log 5 k y = mx + c log 5 k =1 k = 51 k=5 n = – 1/0∙ 5 n=– 2
Before a forest fire was brought under control, the spread of fire was described by a law of the form where A 0 is the area covered by the fire when it was first detected and A is the area covered by the fire t hours later. If it takes one and a half hours for the area of the forest fire to double, find the value of the constant k.
The results of an experiment give rise to the graph shown. a) Write down the equation of the line in terms of P and Q given that P = logep and Q = logeq b) Show that p and q satisfy p = aqb Gradient y-intercept
The diagram shows part of the graph of Determine the values of a and b. Use (7, 1) Use (3, 0) Hence, from (2) and from (1)
a) i) Sketch the graph of ii) On the same diagram, sketch b) Prove that the graphs intersect at a point where the x-coordinate is