The Experimental Program of the FLASH Experiment Fluorescence


, Kakimoto et al. (1995), Nagano et al. ( 2002,")
 and Bunner")

 experiments • Path-lengths from shower to detector almost")


 at. 85 Me.")
 from Nagano et al. (p. c. )-at. 85 Me.")


 Decay Time Measurement")


- Slides: 40
The Experimental Program of the “FLASH” Experiment
Fluorescence efficiency is the foundation for our belief that we are measuring “energy” • How well is it know ( for an ionizing particle)? • Is it linear with particle number (size) in an extensive air shower? • Can it be affected by “accidental” conditions? Impurities, etc. • How do we determine answers to these issues with sufficient accuracy?
Second Knee, showing correlation between knee energy and spectral normalization
Second Knee Spectrum, Shifted to make knee come out at same energy
Second Knee, cont. • All experiments agree when a scale shift is applied. • But what is the actual energy of the second knee? • Fluorescence method should be very reliable ( nearby events, little atmospheric attenuation ). • Position comes primarily from our knowledge of air fluorescence efficiency.
Bunner Air-fluorescence spectrum
Current Understanding • Bunner (1967), Kakimoto et al. (1995), Nagano et al. ( 2002, unpublished) indicates ~15% systematic errors in overall yield and larger errors in individual spectral lines. • Ground based experiments – non-linear effects possible due to λ dependence of atmospheric attenuation. • At 30 km, event energy can change by 25% if 390 nm line intensity changes by 40%.
Photon yields between 300 and 406 nm from Nagano, Kakimoto( Hi. Res) and Bunner
Relative Contributions of Different Spectral Lines at Different Horizontal Distances
Importance to Euso and OWL (space-based) experiments • Path-lengths from shower to detector almost constant – small λ dependence (~10% integral variation over different fluorescence models) • Most showers detected over oceans – effect of water-vapor and other impurities may be important. Some evidence for H 2 O quenching already exists.
Fluorescence Pressure Dependence τ= lifetime P=pressure T=temp.
Reference Pressure
Fluorescence Yield • Y = photons per meter -ionizing particle • P, P’ = pressure and reference pressure • C = spectral line intensity at zero pressure
Dependence of Air Fluorescence ( from Nagano et al (personal communication) at. 85 Me. V
Life time vs Pressure (Air) from Nagano et al. (p. c. )-at. 85 Me. V • Air fluorescence lifetimes ~ 25 nsec • Bunner quotes lifetimes near 40 nsec • Large uncertainties remain.
Dependence on electron energy – Kakimoto et al. and T 461
SLAC test run results • Two week run in June 2002 • Prototype thin target setup • Measured pressure dependence integrated over 300 -400 nm. • Measured average lifetime over 300 -400 nm. • Confirmed linear behaviour of Y with respect to beam current below 109 ppb
LEDs T 461 Setup PMTs
SLAC test result on linearity
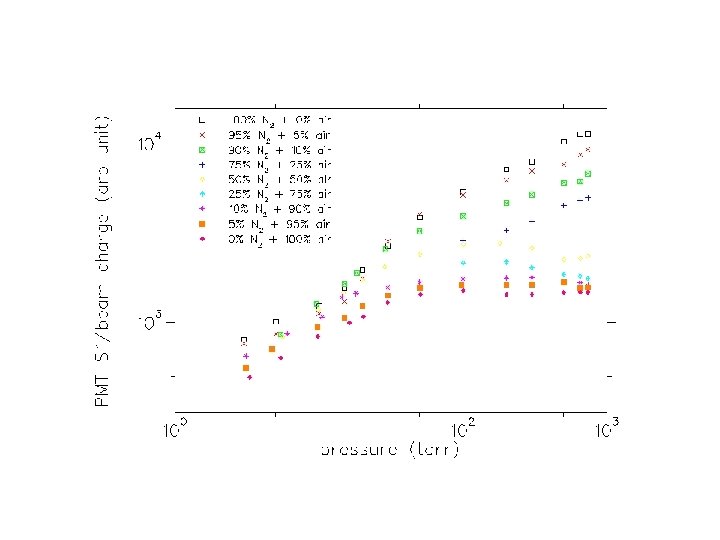
SLAC test result- comparison of N 2 and Air efficiency
SLAC test N 2 Decay Time Measurement
N 2 (in air) Decay Time Measurement
SLAC Test and Beyond • Test clearly established ability to detect air fluorescence in FFTB beams. • Test showed that we can measure the pressure dependence and fluorescence lifetime integrated over total spectrum • What is needed, however, is spectrally resolved pressure and lifetime measurement. • Test only measured Y at 28. 5 Ge. V. Energy dependence over realistic shower energies is required.
OBJECTIVES OF E-165 • Spectrally resolved measurement of fluorescence yield to better than 10%. • Investigate dependence on electron energy. • Study effects of atmospheric impurities. • Observe showering of electron pulses in air equivalent substance (Al 2 O 3) with energy equivalents around 1018 e. V.
Proposed Program • Gas Composition – N 2/O 2 dependence, and Ar, CO 2, H 2 O impurities • Pressure Dependence – Yield versus Pressure down to 10 torr • Energy Dependence – Yield versus electron energy distribution down to 100 ke. V • Fluorescence Spectrum – Resolve individual bands using narrow band filters or spectrometer. • Pulse Width – Pressure dependence of fluorescence decay time for each spectral band
THIN TARGET STAGE • Pass electron beam through a thin-windowed air chamber. – Measure the total fluorescence yield in air at ~30 Ge. V. – Measure the yield over wide range of pressures at and below atmospheric. – Measure emission spectrum using narrow band filters or spectrometer. – Effects of N 2 concentration. Pure N 2 to air. Also H 2 O, CO 2, Ar, etc.
General Requirements for thin target run • FFTB downstream of last magnets • <1% R. L. in beam – no radiation problem • Require 108 – 109 e/pulse for linear operation. • Require improved torroid sensitivity to monitor beam at this intensity (or equivalent cross-calibrated measurement).
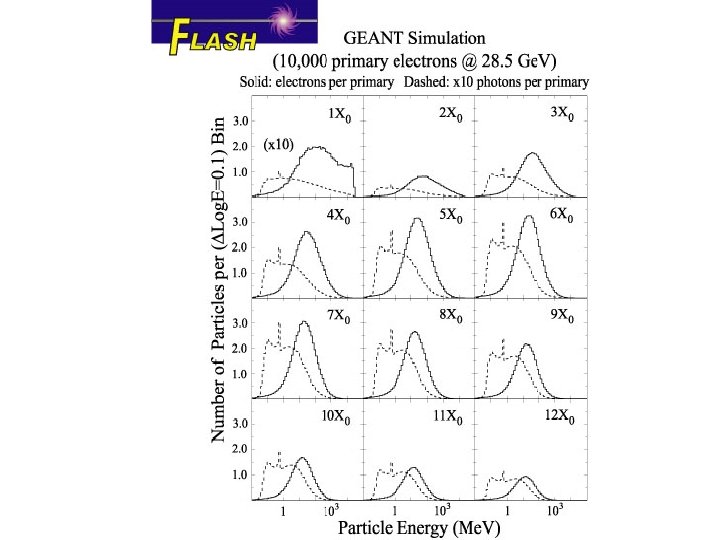
THICK TARGET STAGE • Pass electron beam through varying amounts of ~ air equivalent showering material (Al 2 O 3). • Measure light yield as a function of depth in the shower ( sample light from a wide range of electron energies). – Is fluorescence proportional to d. E/dx? – What are the contributions of low-energy (<1 Me. V) electrons? – Can existing shower models (EGS, GEANT, CORSIKA) correctly predict fluorescence light? – How does the fluorescence yield in an air shower track the shower development?
THICK TARGET SETUP
CORSIKA AIR SHOWERS
BREMSSTRAHLUNG BEAM OPTION
THICK TARGET SHOWER DEVELOPMENT
SYSTEMATIC UNCERTAINTIES • Beam charge should be measurable by the beam toroids to better than 2%. • The uncertainties in showering 3%. • Detector systematic uncertainties of 5. 4%. • Detector Optics 4% (thin) 6. 5 % (thick). • Total systematic uncertainty of 7 -9%.
SYSTEMATIC UNCERTAINTIES Beam Showering Detector System Optical System Total Thin Target Thick Target 2% 2. 2% - 3% 5. 4% 4% 6. 5% 7% 9. 2%
CONCLUSION • FLASH aims to achieve an accuracy of 10% in the total fluorescence yield and individual spectral lines. • Verify energy dependence of yield down to ~100 ke. V. • Both thin target and thick target approaches will be invoked. • Dependence of yield and spectrum on pressure and atmospheric impurities will be measured. • Shower developments equivalent to ~1018 e. V will be measured at various depths and compared with codes. • We hope that FLASH will help to shed light on the apparent differences between Hi. Res and AGASA, and provide reliable information for future fluorescence-based UHECR experiments.