The Evolution of Metabolic Syndrome A Staged Approach

The Evolution of Metabolic Syndrome: A Staged Approach to Reducing Macrovascular and Diabetes Risks Chaicharn Deerochanawong M. D. Diabetes and Endocrinology unit, Department of Medicine, Rajavithi Hospital, Ministry of Public Health

Topic • Evolution of metabolic syndrome • New definition • Current concept of the causes of metabolic syndrome: Adiponectin • Goals and guidelines of treatment • Role of statin in prevent atherosclerosis and diabetes in metabolic syndrome
 • 1989 Deadly")
Evolution of metabolic syndrome • 1988 Syndrome X ( Reaven ) • 1989 Deadly quartet • 1992 Insulin resistance syndrome ( Defronzo ) • 1994 Metabolic syndrome ( Alberti ) • 1998 WHO : Metabolic syndrome ( Kaplan )

WHO definition of ‘Metabolic Syndrome’ AT LEAST ONE OF: • IGT • type 2 diabetes • insulin resistance* * Insulin resistance defined under hyperinsulinemic, euglycemic conditions as glucose uptake below the lowest quartile for the background population under investigation + AT LEAST TWO OF: • impaired glucose regulation or diabetes • insulin resistance* • arterial pressure 140/90 mm. Hg • plasma triglycerides 150 mg/dl and/or HDL cholesterol < 35 mg/dl for men; < 39 mg/dl for women • central obesity waist: hip ratio > 0. 90 for men, > 0. 85 for women; and/or BMI > 30 kg/m 2 • microalbuminuria urinary albumin excretion rate 20 g/min or albumin to creatinine ratio 30 mg/g World Health Organization. Definition, diagnosis and classification of diabetes mellitus and its complications. Part I: Diagnosis and classification of diabetes mellitus. WHO Department of Noncommunicable Disease Surveillance; 1999.
 • 1989 Deadly")
Evolution of metabolic syndrome • 1988 Syndrome X ( Reaven ) • 1989 Deadly quartet • 1992 Insulin resistance syndrome ( Defronzo ) • 1994 Metabolic syndrome ( Alberti ) • 1998 WHO : Metabolic syndrome • 2001 NCEP III : Metabolic syndrome ( Kaplan )
 Men Women TG")
ATP III: The Metabolic Syndrome* Risk Factor Abdominal obesity† (Waist circumference‡) Men Women TG HDL-C Men Women Blood pressure Fasting glucose Defining Level >102 cm (>40 in) >88 cm (>35 in) 150 mg/d. L <40 mg/d. L <50 mg/d. L 130/ 85 mm Hg 110 mg/d. L *Diagnosis is established when 3 of these risk factors are present. †Abdominal obesity is more highly correlated with metabolic risk factors than is BMI. ‡Some men develop metabolic risk factors when circumference is only marginally increased. JAMA. 2001; 285: 2486 -2497.
 • 1989 Deadly")
Evolution of metabolic syndrome • 1988 Syndrome X ( Reaven ) • 1989 Deadly quartet • 1992 Insulin resistance syndrome ( Defronzo ) • 1994 Metabolic syndrome ( Alberti ) • 1998 WHO : Metabolic syndrome • 2001 NCEP III : Metabolic syndrome ( Kaplan ) • ICD-9 Code “Dysmetabolic syndrome” – 277. 7 • 2005 IDF/ADA : Metabolic syndrome

IDF/AHA 2005: Metabolic Syndrome • To Identify individual at high risk of CVD and diabetes • To be useful for clinician • To be useful for international comparison
 plus")
IDF/AHA 2005: Metabolic Syndrome • Abdominal obesity ( waist circumference by ethnic/country specific) plus at least 2 of the followings 1. Triglyceride > 150 mg/dl 2. HDL-C <40 mg/dl (men), <50 mg/dl (women) 3. SBP > 130 mm/Hg and/or DBP > 85 mm/Hg 4. FPG > 100 mg/dl or known diabetes

Ethnic specific values for waist circumference Country/Ethnic group Waist circumference Europids Male > 94 cm In the USA, the ATP III values (102 cm male; 88 cm female) are likely to continue to be used for clinical purposes Female > 80 cm South Asians Male > 90 cm Based on a Chinese, Malay and Asian. Indian population Female > 80 cm Chinese Male > 90 cm Female > 80 cm Male > 85 cm Female > 90 cm Japanese Ethnic South and Central Americans Use South Asian recommendations until more specific data are available Sub-Saharan Africans Use European data until more specific data are available Eastern Mediterranean and Middle East (Arab) populations Use European data until more specific data are available
 predominate visceral fat • Gynoid obesity")
Obesity • Android obesity ( apple shape ) predominate visceral fat • Gynoid obesity ( pear shape ) predominate subcutaneous fat

Visceral Obesity Subcutaneous Obesity

18 16 P < 0. 0001 14 12 10 8 6 4 2 0 0 1, 000 2, 000 3, 000 4, 000 Visceral adipose tissue volume per unit surface area (ml/m 2) 5, 000 Glucose disposal (mg/kg LBM/min) Visceral obesity is associated with insulin resistance Women Men 18 16 14 12 10 8 6 4 2 0 0 5, 000 10, 000 15, 000 20, 000 Total subcutaneous adipose tissue volume per unit surface area (ml/m 2) Banerji MA, et al. Am J Physiol 1997; 273: E 425–E 432.

Waist circumference is a surrogate marker of visceral fat Men > 40 inch > 36 inch or 90 cm( Asia ) Women inch > 35 inch > 32 inch or 80 cm( Asia )

Epidemiology of Metabolic Syndrome

Metabolic syndrome Prevalence of components *US adults age 20 and over (NHANES III, 1988 -94) • Abdominal obesity 39% • Hypertriglyceridemia 30% • Low HDL cholesterol 37% • High blood pressure or medication use 34% • High fasting glucose or medication use 13% • >1 • >2 • >3 71% 44% 24% (~45% of people age 50 -70 years) Ford et al. JAMA; 287: 356 -9, 2002

Metabolic Syndrome in Thailand Chaicharn Deerochananwong M. D. For the Endocrine Society of Thailand

Prevalence of Metabolic Syndrome • Prevalence of Metabolic Syndrome by NCEP ATPIII in Thai High Risk Population = 24. 1 % ( Male 22. 2% and female 24. 7% ) • If using waist circumference cut off point by WHO Asian Guideline ( Male > 90 cm, Women > 80 cm ), the prevalence of metabolic syndrome in Thai High Risk Population= 33. 3 % ( Male 36. 0% and female 32. 6% )
 by Risk Factors • • •")
Prevalence of Metabolic Syndrome ( NCEP ATPIII ) by Risk Factors • • • Obesity Hypertension Dyslipidemia GDM or macrosomic baby FH of diabetes 38. 2% 34. 2% 29. 4% 17. 9% 14. 1%
by Age")
Prevalence of Metabolic Syndrome ( NCEP ATPIII )by Age

Metabolic Syndrome and Mortality • Population based, prospective 1209 Finnish men aged 42 -60 year at baseline (1984 -9), follow-up through December 1998 • Relative risk NCEP III CHD Mortality 2. 9 (1. 2 -7. 2) CVD Mortality 2. 6 (1. 4 -5. 1) All cause Mortality 1. 9 (1. 2 -3. 0) WHO 4. 2 (1. 6 -10. 8) 3. 0 (1. 5 -5. 7) 2. 1 (1. 3 -3. 3) Lakka. JAMA 2002; 288: 2709 -16

Metabolic syndrome: The Role of Obesity Visceral Obesity FFA, cytokines, adipokines Triglycerides HDL Insulin Resistance Blood glucose Type 2 Diabetes Cardiovascular Disease Blood Pressure

Causes of Metabolic Syndrome • Genetic causes • Acquired causes Overweight and obesity Physical inactivity

Genetic causes of Metabolic Syndrome • • • Beta 3 -adrenergic-receptor gene Cd 36, Fatty acid transporter (FAT) gene 11 beta-HSD 1 gene Adiponectin gene Etc.

TNF- IL-6, IL-8 MCP-1 TGF IGF-1 FGF Bone Morphogenic Protein IGFBP Fatty acids EGF Lysophospholipid Visfatin Lactate Adenosine Resistin Adipose Tissue Prostaglandins Glutamine Adiponectin Unknown Factors Adipsin Agouti Estrogen Angiotensin-II Angiotensin Leptin Retinol Plasminogen activator inhibitor -1 Acylation-Stimulating Protein

a tisdipo su se e in lun g liv er kid ne y ov ary ute rus pla ce int nta es ti mu ne sc le bra art he Adiponectin 1 18 41 107 Collagenlike Fibrous Domain 244 C 1 q-like Globular Domain
 • Abundant in blood")
Adiponectin: A ‘Good’ Fat-Derived Hormone • Secreted by adipocytes (SC) • Abundant in blood (ug/ml) • Reduced in obesity / T 2 DM / CVD • Specific receptors (2) in many tissues • turns on fat oxidation • Improves insulin sensitivity

Lancet, 1 Nov 2003

LOW Plasma Adiponectin Is Correlated With Insulin Resistance Weyer, et al. , JCEM, 86, No. 5, 2001

Adiponectin: A ‘Good’ Fat-Derived Hormone • Increases fatty acid oxidation • Improves insulin action in liver and skeletal muscle • Anti-atherogenic / anti-inflammatory
 37487 -37491, 2002")
Adiponectin and Atherogenesis Matsuda, et al JBC 277 (40) 37487 -37491, 2002
 20 * p<0. 01 15 10 5")
Hypoadiponectinemia and CAD Plasma Adiponectin ( g/ml) 20 * p<0. 01 15 10 5 0 non-CAD Circulation 199
 lipid adjusted")
6 year risk of myocardial infarction adjusted relative risk (p< 0. 001) lipid adjusted RR (p < 0. 02) 1. 2 1. 0 0. 8 0. 6 0. 4 0. 2 0. 0 1 (7. 9) 2 (12. 6) 3 (16. 5) 4 (21. 1) 5 (29. 2) g/ml quintile of adiponectin Pischon, T. , et al. , JAMA, 2004. 291(14): p. 1730 -7.

Adiponectin • Unique adipocyte-derived hormone with antidiabetic effect antiinflammatory effect antiatherogenic effect

Goal of Treatment of Metabolic Syndrome • Prevent atherosclerosis events • Prevent type 2 diabetes

Objectives of Management • To reduce underlying causes Obesity and physical inacitivity • To treat associated risk factors High blood pressure High blood sugar Dyslipidemia Prothrombotic state

Modest weight loss has beneficial health effects Modest weight loss of >5% in obese individuals with type 2 diabetes, hypertension or hyperlipidaemia resulted in: • • Improved glycaemic control Reduced blood pressure Improved lipid profile 20% reduction in premature mortality in overweight women with obesity-related health conditions Goldstein DJ. Int J Obesity 1991; 16: 397– 415

Clinical Management of Metabolic Syndrome • Therapeutic Lifestyle Changes - Dietary restriction of calories, simple carbohydrates, and saturated fat - Regular aerobic exercise • Pharmacologic therapy

Clinical Management of Metabolic Syndrome • • Therapeutic Lifestyle Change Pharmacologic therapy -Insulin sensitizing drugs -Weight loss drugs -Drugs for heart disease prevention eg. ACEI, aspirin, statin
")
Studies in The Prevention of Type 2 DM Baseline Patient Characteristics OGTT (% pts) Age BMI IGT DPS 1 55 31 100 0 DPP 2 51 34 100 0 STOP-NIDDM 3 55 31 100 0 Normal XENDOS 4 79 1. Tuomilehto J et al. N Engl J Med 2001; 344: 1343 -50 2. DPP N Engl J Med. 2002; 346: 393 -403 3. Chiasson J-L et al. Lancet 2002; 359: 2072 -77 4. Sjostrom et al. 9 th ICO, Sao Paulo 2002. Poster Presentation 43 37 21
 • Mean duration of")
Diabetes Prevention Study ( NEJM 2001; 344: 1343 -50 ) • Mean duration of follow-up was 3. 2 years • The intervention group: mean weight loss at the end of year 1 and 2 = 4. 2 kg and 3. 5 kg respectively compared with 0. 8 kg in both year in control group • The cumulative incidence of diabetes after four years was 11% in the intervention group and 23% in the control group • During the trial, the risk of diabetes was reduced by 58% ( P<0. 001) in the intervention group • The reduction in the incidence of diabetes was directly associated with changes in lifestlye
 40 Cumulative incidence of diabetes")
Diabetes Prevention Program ( NEJM 2002; 346: 393 -403) 40 Cumulative incidence of diabetes (%) Placebo 30 RR* 31% Metformin Lifestyle 20 RR* 58% 10 0 0 0. 5 1. 0 1. 5 2. 0 2. 5 Year *Reduction in risk of progressing to type 2 diabetes versus placebo 3. 0 3. 5 4. 0 DPP. N Engl J Med. 2002; 346: 393 -403

Diabetes Prevention Program CVD Risk factors BMI Systolic BP Diastolic BP Triglyceride Total cholesterol LDL-C HDL-C CRP Fibrinogen Placebo -0. 4% -0. 6+0. 5 -1. 9+0. 3 -11. 2+2. 7 -4. 6+1. 0 -2. 0+0. 9 -0. 3+0. 3 0% +2. 4% Met -2. 9%* -0. 3+0. 5 -1. 6+0. 3 -8. 2+2. 8 -4. 1+1. 1 -3. 3+1. 0 +0. 5+0. 3 -13. 2%* +1. 9% TLC -7. 2%* -3. 3+0. 5* -3. 8+0. 3* -25. 3+2. 7* -6. 9+1. 1 -2. 8+0. 9 +1. 0+0. 3* -29. 5%* - 1. 0%* * P-value < 0. 05 compare with placebo

Is Intensive Lifestyle Changes or Metformin Cost Effective in Prevent DM? Lifestyle Lifetime costs $ 59, 917 Metformin Placebo $ 64, 871 Lifetime QALY 10. 8 10. 3 △ Cost vs Plac - $ 3, 523 + $ 1, 431 △ QALY vs Plac 0. 8 0. 3 △ Cost /△ QALY Cost saving $ 5, 628 $ 63, 440 10. 0 - Conclusions: lifestyle intervention is cost-saving and metformin is cost effective ( < $ 6, 000 per QALY )

The Stop NIDDM Trial Eligible criteria: age 40 -70 yr, BMI 25 -40, FPG > 5. 6 mmol/l Acarbose 100 mg tid vs Placebo tid for 3 year and then follow up with Placebo in 2 group for 3 months • Results 1. Absolute risk reduction of diabetes = 9 % 2. Relative risk reduction of diabetes = 21. 5% 3. A hazard ratio 0. 76 (CI 0. 64 -0. 90) to onset of DM 4. NNT to prevent 1 case in 3 years of DM = 11 5. Cumulative incidence of DM Acarbose Placebo At the end of treatment 32. 8% 41. 8% 3 Months after stop treatment 39. 7% 44. 9%
 Placebo +")
XENDOS Results Effect of Orlistat on Body Weight Change in weight (kg) Placebo + lifestyle Orlistat + lifestyle 0 -3 -4. 1 kg -6 -6. 9 kg -9 -12 p<0. 001 vs placebo 0 52 104 156 Week Sjostrom et al. 9 th ICO, Sao Paulo 2002. Poster Presentation 208

XENDOS Results Cumulative Incidence of Type 2 DM Incidence Placebo + lifestyle of T 2 D (%) Orlistat+ lifestyle 10 9. 0% 8 RR^ 37% p=0. 0032 6. 2% 6 4 ^Hazard ratio reduction vs placebo plus lifestyle 2 0 0 26 52 78 104 Week 130 156 182 Sjostrom et al. 9 th ICO, Sao Paulo 2002. Poster Presentation 208

Treatment of Elevated Blood Pressure • Goal of blood pressure < 140/90 mm. Hg, except for diabetes ( < 130/80 mm. Hg ) • No randomized controlled trial of antihypertensive agents in patients with metabolic syndrome and no definite guidelines existed • Suggestion can be made based on assumed pathophysiologic mechanisms

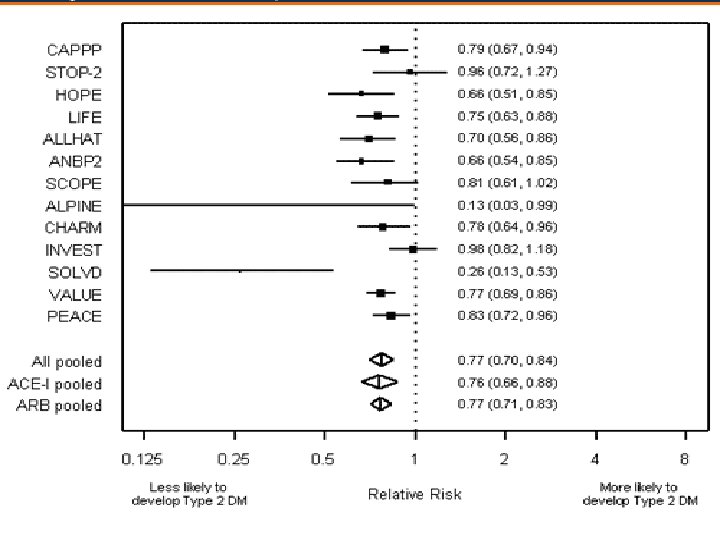
ACE-I and ARB • May be considered preferred agents because of 1. Metabolically neutral 2. Can prevent or retard type 2 diabetes 3. Most effective agents in preventing proteinuria and retard the progression of obesity hypertension-related ESRD 4. May prevent cardiac hypertrophy and progression to heart failure

Management of Dyslipidemia in Metabolic Syndrome • Primary goal LDL-Cholesterol • Secondary goal Hypertriglyceridemia > 400 mg/dl: TG lowering drug 200 -400 : Non-HDL-chol Low HDL-C ( < 40 mg/dl )

LDL-C Goal and Cutpoints for Treatment NCEP ATP III ( Circulation July 13, 2004 ) Risk Category CHD and CHD Risk equivalents LDL goal and initiate TLC <100, >100 LDL consider drug Rx > 100 ( optional goal < 70 ) ( <100 drug optional ) 2+ risk factors <130, >130, 160 0 -1 risk factor <160, >160 >190

Drugs for non-HDL cholesterol lowering • 2 approaches to drug therapy • First, the non-HDL cholesterol goal can be achieved by LDL-lowering drug • Second, fibrate or nicotinic acid • Fibrate or nicotinic acid can be added with statin, if used with appropriate caution, to achieve the non-HDL cholesterol goal

Lowering LDL-C With Statin Therapy Reduces the Risk of CV Events Many major trials have established beyond question that LDL-C–lowering therapy reduces risk for CHD events 4 S-P Patients with CHD event (%) 25 Primary prevention 20 Simvastatin LIPID-P 4 S-S Pravastatin 15 CARE-P HPS-P PROSPER-S 10 5 Secondary prevention LIPID-S CARE-S HPS-S ASCOT-S* Lovastatin PROSPER-P WOSCOPS-S S = statin-treated P = placebo-treated ASCOT-P* AFCAPS-P AFCAPS-S 0 2. 3 (90) 2. 8 (110) Atorvastatin 3. 4 (130) 3. 9 (150) 4. 4 (170) 4. 9 (190) 5. 4 (210) *Extrapolated to 5 y LDL-C mmol/L (mg/d. L) Modified from Kastelein JJP. Atherosclerosis. 1999; 143(suppl 1): S 17 -S 21.
 diabetics Relative Risk Reduction 0 Diabetes Non diabetes (n=1,")
PPP (WOS, CARE, and LIPID) diabetics Relative Risk Reduction 0 Diabetes Non diabetes (n=1, 444) (n=18, 324) -10 -20 23% -30 26% (p<0. 001) (p=0. 002) (%) * CHD Death, Non fatal MI, CABG, or PTCA: 3, 717 events Sacks F et al. : Circulation 2000; 102: 1893 -1900 33490 -01 -N

THE METABOLIC SYNDROME IN WOSCOPS
 5815 Tg > 1.")
THE METABOLIC SYNDROME IN WOSCOPS YES NO 632 (9. 8%) 5815 Tg > 1. 69 m. M 3153 (48. 9%) 3294 HDL < 1. 04 m. M 2447 (38. 0%) 4000 Metabolic Syndrome BMI > 30 Fasting PG > 6. 1 m. M SBP >130 / DBP >85 or on Rx N with 3 or more RF’s 95 (1. 5%) 4743 (73. 6%) 1537 (23. 8%) Excluding diabetics and fasting glucose > 7. 0 m. M. 6352 1704 4910
 Non Metabolic Syndrome (n=4, 756) Metabolic Syndrome")
Pravastatin Reduces CHD In Metabolic Syndrome (WOSCOPS) Non Metabolic Syndrome (n=4, 756) Metabolic Syndrome (n=1, 691) CHD Prevalence ( %) 10 -27% 8 6 4 2 0 -31% 10. 4% 6. 2% 7. 7% 4. 4% Placebo Pravastatin Circulation, 2003
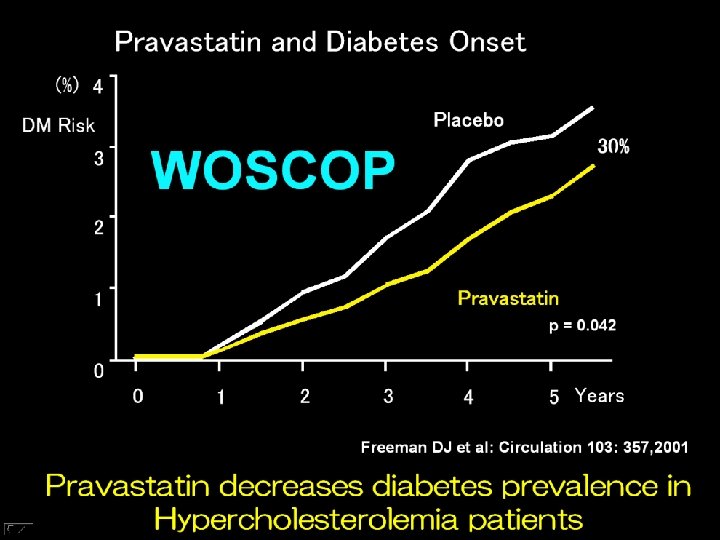

Statin and Development of Diabetes

Shimomura, Jpn. Endo. Soc. 2004

Shimomura, Jpn. Endo. Soc. 2004
 40")
Pravastatin Increases Plasma Adiponectin Levels WOSCOP Subanalysis % Changes (v. s baseline ) 40 30 p < 0. 001 20 10 0 p = N. S. -10 Placebo Pravastatin Shimomura, Jpn. Endo. Soc. 2004

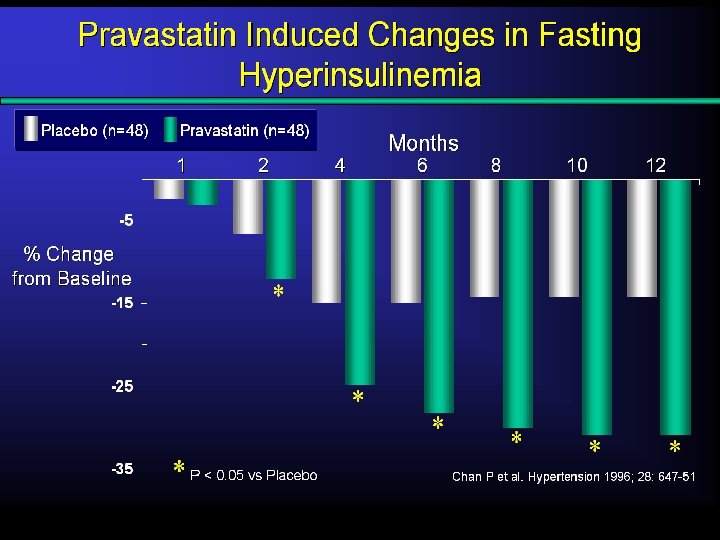
Pravastatin might prevent postprandial hyperglycemia and hyperlipidaemia leading to endothelial dysfunction

Importance of 1 st phase insulin secretion ↓ Postprandial hyperglycemia Postprandial hyperlipidaemia Endothelial dysfunction Atherosclerosis progression Yutaka Mori

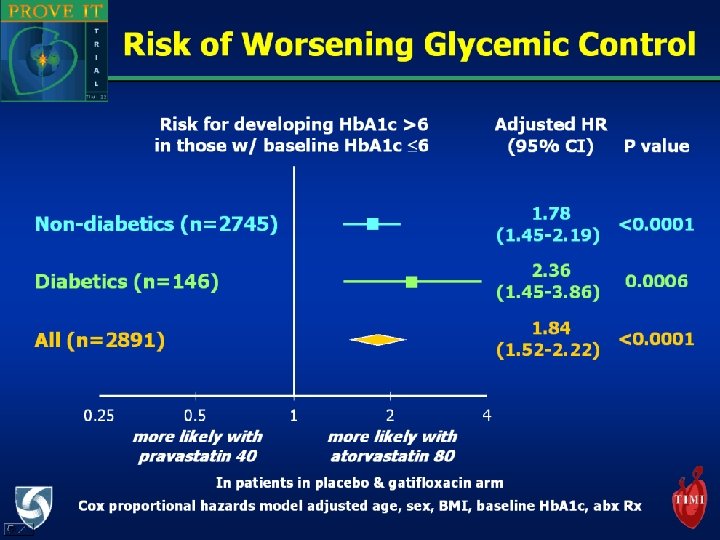
Implications • Statin that don’t affect insulin spike are favorable for hypercholesterolemic patients with insulin resistance. • Some data show that hydrophobic statins like Atorvastatin and Simvastatin inhibit insulin secretion. On the other hand, Pravastatin has a low lipid solubility and it doesn’t transfer into pancreatic beta-cells and doesn’t inhibit insulin secretion

Metabolic Syndrome • Closely linked to insulin resistance that caused by genetic and abdominal obesity and physical inactivity • First line therapies are weight reduction and increased physical activity • Beyond the underlying causes, to treat the associated risk factors of atherosclerosis are also very important

- Slides: 71