The evidence of evolution Biological evolution describes the

The evidence of evolution • Biological evolution describes the change over time in the genetic composition of a population of organisms • The evidence from the fossil record, genetics and other resources is used to back theory of evolution
 Theory of evolution by natural selection (or survival of the")
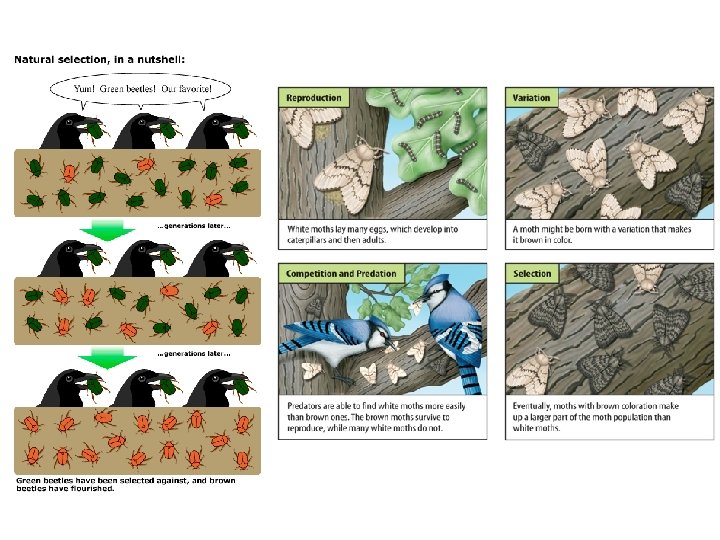
Darwin and Wallace (1859) Theory of evolution by natural selection (or survival of the fittest) • Organisms produce more offspring than can survive • Offspring show variation. Some variations more suited to environment than others • Those individuals with favourable characteristics more likely to survive and produce more offspring • Successive generations will become modified over time – eventually becoming a new species

Time scales in Evolution • The earliest geological time scales simply used the order of rocks laid down in a sedimentary rock sequence (stratum), with the oldest at the bottom and newer layers on top. • However, geologists realised that particular fossils were restricted to particular layers of rock. This built up the first generalised geological time scale.

Geological Time Scale • This time scale was developed in the nineteenth century when geologists observed that particular rocks were characterised by distinctive groups of fossils. • Names were based on areas where they were first recognised, or on the distinctive nature of the rocks. • Geological time scale divided into Eras (e. g. Precambrian), Periods (e. g. Proterozoic) and Epochs. • The time interval predating the appearance of the first abundant fossils is called the Precambrian.
 • How do we determine the")
Dating Methods (working out how old something is) • How do we determine the ages of rocks, fossils and other items? – Relative time (working out how old something is in relation to something else) – Stratigraphic correlation (comparing fossils that occur in different rock layers, in different parts of the world to determine their relative age) – Absolute time (estimating the actual age of something)
 The Principal of Superposition “in an undisturbed")
Relative Time (working out age by comparison) The Principal of Superposition “in an undisturbed sequence of layered rocks, the oldest layers lie at the bottom and the successively high layers are progressively younger”. This principal can also be applied to any fossils that are contained in the layers (strata). A rock succession

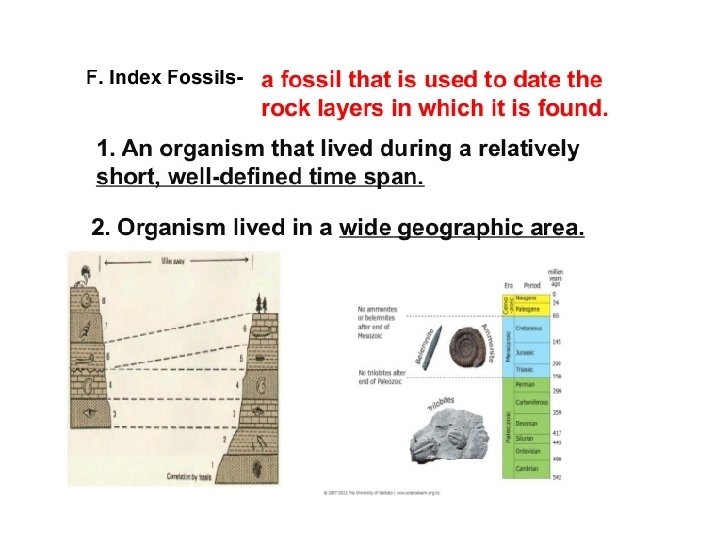
Stratigraphic Correlation – Using Index Fossils • Index fossils are geologically, short lived, but abundant species with a limited occurrence so that they are restricted to a particular strata (exist for a “short” time and therefore are only in one or very few, layers) • The presence of such fossils in a particular strata, even in widely separated regions, are used to infer the strata as being of the same age. Both layers are presumed to be the same age as they contain the same index fossil Location 1 Location 2

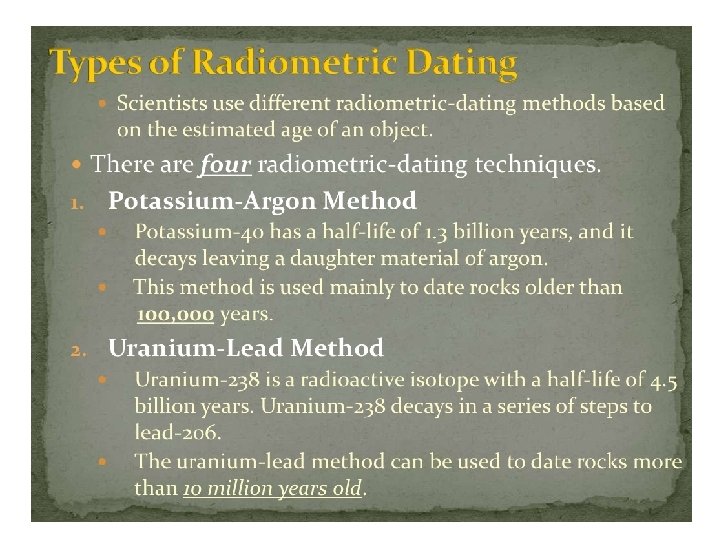
Absolute Time • Techniques that assign an approximate numerical date to the sample. • Techniques include radiometric dating, carbon dating, electron spin resonance and luminescence • Radiometric dating is the most common technique.

Radiometric dating • The method is based upon the radioactive decay of unstable atoms to a more stable atom. • In a certain period of time, called the half life, half of the unstable atoms will have decayed into the more stable atom. • By measuring the ratio of unstable to stable decay products, the time that has elapsed since the decay began can be calculated. This is equivalent to the age of the rock.
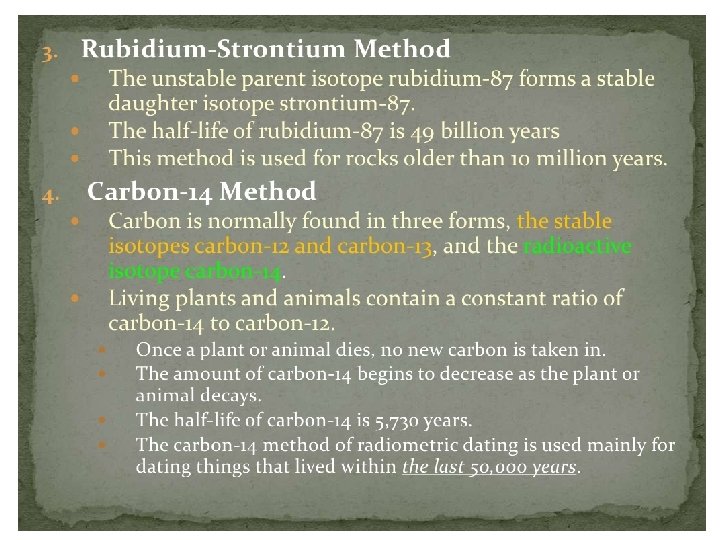

Radiometric dating • Carbon Dating - used to date objects younger than 60, 000 years (these objects must contain carbon e. g. bone, fabric) http: //www. youtube. com/watch? v=udk. Qw. W 6 a. Lik&feature=related

Radiometric dating Carbon dating is not useful for organic material older than about 60 000 years ago. However, another technique of dating, known as electron-spin resonance (ESR), is useful for ages from about 50 000 years ago to 500 000 years old.
 • When objects are buried in soil, they are exposed")
ESR (electron spin resonance) • When objects are buried in soil, they are exposed to low levels of radiation from the soil • The radiation alters the energy level of electrons in the object • When the object is dug up or burnt, the electrons “reset” and the information regarding their age is lost.

ESR This method can only estimate the age of objects since they were last buried or burnt Estimates ages between 50, 000 and 500, 000 years.

Evidence of Evolution

Evidence for Evolution Web. Quest • http: //www. pbs. org/wgbh/evolution/educato rs/lesson 3/act 2. html

1. The Fossil Record • Fossils are the remains or traces of pre-existing life forms preserved in rocks. • Usually only the hard parts (shells or skeletons) are preserved. • Trace fossils are the signs or remains of an organism’s activities such as footprints, bite marks, burrows and coprolites. • there are gaps in the fossil record as not all organisms become fossils. • The fossil record is used as evidence of biological evolution.

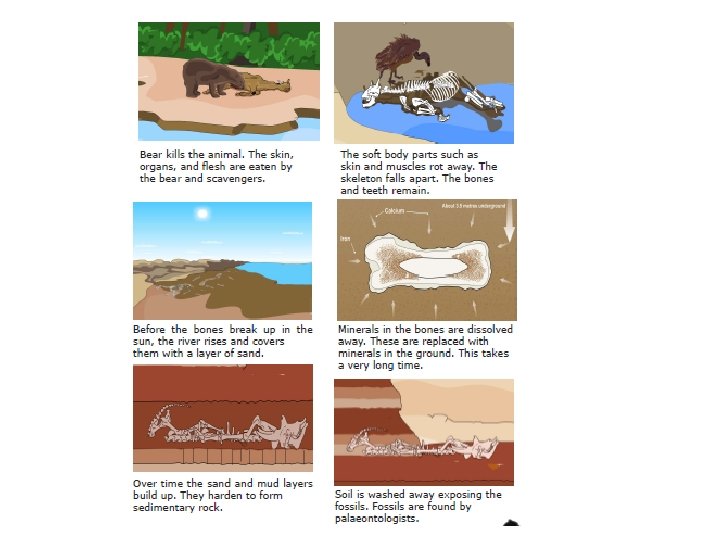
Fossilisation • Fossils are formed when an organism dies and the body or part of the body is preserved in some way. Conditions for fossilisation (REMEMBER THESE!): 1. the body needs to be rapidly and permanently buried in sediments. Ø Rapid burial prevents destruction of the organism by predators, bacterial or weathering.

Fossilisation • Burial can occur: – on the bottom of the sea, rivers, and lakes – on land by blowing sand or volcanic ash, – by the entrapment of the organism in some sticky substance such as tar or tree sap (amber). 2. Oxygen deprivation Ø Limits the extent of decay by microorganisms

Fossilisation 3. Minerals dissolved in water must be present Ø the original hard parts are progressively replaced by other minerals such as quartz or opal Ø (with mould fossils, the hard parts dissolve away completely, leaving only an impression, or a natural mould of them remaining in the rock. This may be filled by minerals, giving a mould fossil of the organism)

Fossilisation 4. Continued sediment accumulation Ø This is the opposite of an eroding surface and ensures the organism remains buried in the long-term 5. The absence of excessive heating or compression Ø this might destroy the organism before or during fossilisation.

Types of Fossils • When an organism decays it leaves a cavity known as a mould. • When the cavity is later filled by other material a cast is formed. Impression of the hard exoskeleton of a trilobite that lived during the Cambrian Period, about 500 mya.

Types of Fossils • Thin tissue is sometimes preserved as a carbon film or impression in a rock.
. The shell")
Types of Fossils • Ammonoid fossil shell from the Jurassic Period (England). The shell has been replaced with iron sulphide (pyrite). • Cockle shell replaced with opal from Cretaceous Period, Cooper Pedy, SA.

Types of Fossils • Petrified tree trunk in Arizona. • Plant material is replaced with mineral salts that petrified the tissue – the tree literally turns to stone.

Types of Fossils • A human cast formed in volcanic ash at Pompeii.

Types of Fossils are not only found in rock! • Animals have been trapped in natural tar pits. • Mammoths and other animals have been trapped in ice or frozen underground, so that flesh and stomach contents have been preserved. • Extinct insects have been found in amber (tree sap). Insect preserved in amber from the Baltic Region dated from the Oligocene Period

What the fossil record shows…. snapshots of organisms over time http: //faculty. icc. edu/easc 111 lab/labs/labf/geologicalscaleclock/geologicscale_clock. html

Making Connections: Transitional Fossils • Fossils that are intermediate between the ancestral form and a new species. • If birds share a common ancestor from reptiles, then the fossil record could show a fossil that has characteristics of both reptiles and birds. e. g. Archaeopteryx

Transitional Fossils • Fossils showing possible links from fish to amphibians, then to reptiles.

Important exam advice! • NEVER write that one organism “evolved from” another organism Ø Instead write that both organisms “share a common ancestor” • NEVER write that an organism “adapted to” its environment Ø Instead write that the organism “was selected for”

2. Homology • Homologous structures: different organisms, have an underlying similar basic pattern/structure. • Molecular homology: refers to similar sequences of nucleotides in DNA and/or amino acids in proteins.

Homologous structures • Comparative anatomy: Related organisms will show similarities in basic structures regardless of their functions (suggests they shared a common ancestor)
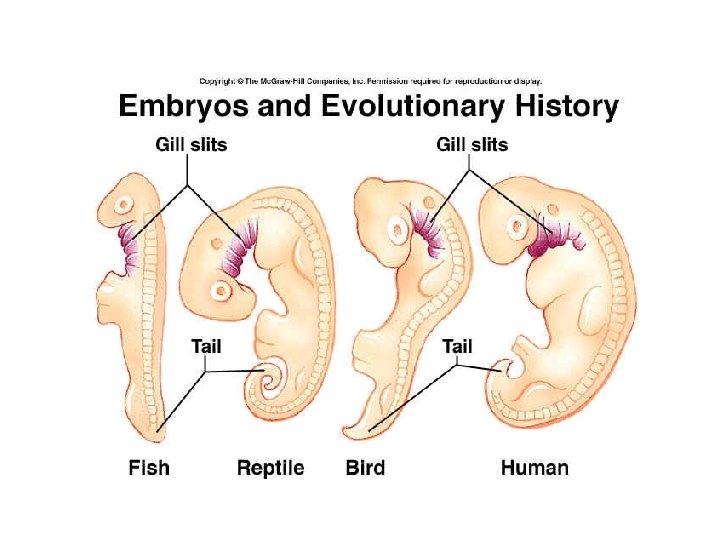
 – e. g. all vertebrates")
Homologous structures • Comparative anatomy in embryonic development (embryology) – e. g. all vertebrates have embryos that develop similiarly (have gill slits and tails). Therefore they share a common ancestor.

Molecular Homology • Molecular changes accumulate over time in DNA. These genetic changes may also be reflected in the sequences of amino acids. • Closely related organisms will show similarities in their molecular makeup. • The longer the separation between two species (since they shared a common ancestor) the greater the accumulation of molecular differences over time.

Molecular Homology • All proteins are composed of the same set of twenty amino acids. We can compare the similarities in amino acid sequences. • DNA sequences from difference species can also be compared • Entire genomes can also be compared to look for what genes various species have in common.

Gene Sequences • Species that are closely related will show more similarities in the base sequences of their common genes. • Gene sequences may be strongly conserved over time (suggests that gene is important for survival). • Strongly conserved genes will show very similar base sequences. E. g. Haemoglobin – Human: – Orangutan: – Rabbit: TGA CAA GAA CA TCA CGA GAA CA TGG TGA TAA CA

Ancestry based on similarities between haemoglobin amino acid sequences

Molecular Homology • Cytochrome C is a vital protein in the electron transport chain in cellular respiration. • Difference in cytochrome C between species: – Human and Rhesus monkey: 1 amino acid – Human and whale: 7 amino acids – Human and bird: 13 amino acids – Human and tuna fish: 22 amino acids (humans share the most recent common ancestor with rhesus monkeys, followed by whales, birds then tuna)

DNA Hybridisation: Measuring relatedness Single DNA strand from species 1 Single DNA strand from species 2 • Heat double stranded fragments and record temperature at which half become single stranded again. This is known as the melting temperature. – Lower melting temperature = the lower the complementary pairing (the more evolutionarily distantly related they are) – Higher melting temperature = the higher the complementary pairing (the more closely evolutionarily related they are).

Cautions interpreting molecular data • Not all DNA mutations are reflected in amino acid changes (therefore comparing DNA sequences may be more accurate) • Sometimes mutations can change back (e. g. a base change may occur, and then a few generations later, the nucleotide base may mutate back to the original base). • Different types of proteins may mutate at different rates (need to be careful which protein is chosen to compare between species)
 between organisms • The")
Chromosomal homology • Comparison of chromosome number (and banding pattern) between organisms • The more similar they are, the more closely evolutionarily related they are

3. Vestigal Organs

Presumed whale common ancestor

4. Analogous Structures
")
Analogous structures (show separate ancestors, but similar selection pressures)

5. Biogeography • The field of biogeography is concerned with the distribution of species in relation both to geography and to other species. Ø identical fossil plants and animals had been discovered on opposite sides of the Atlantic. Since the ocean is too far for them to have crossed it on their own, it’s seen as evidence that the continents had once been connected.

Biogeography Ø Also allows scientists to determine how the differences in environments have effected the evolutionary development of different species of common origin. Same common ancestor, but differences in environments result in different selection pressures, and differences in phenotypes.
 • All eukaryotic cells contain mitochondria. • Mitochondria were")
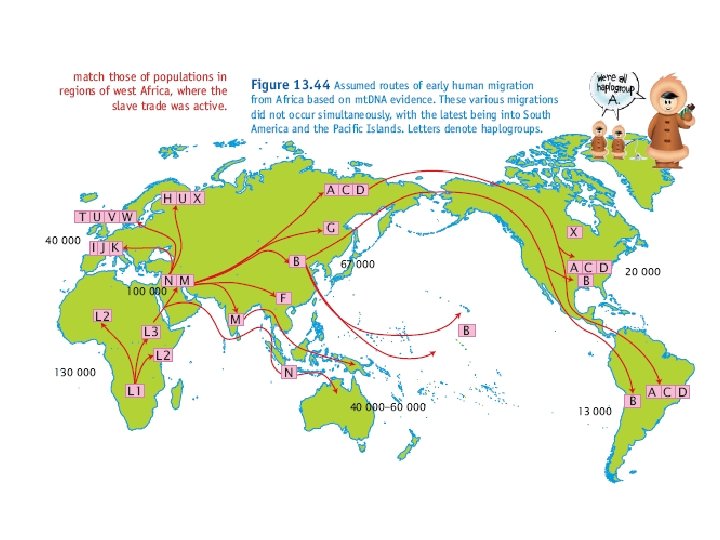
6. Mitochondrial DNA (mt. DNA) • All eukaryotic cells contain mitochondria. • Mitochondria were once free living prokaryotes that became incorporated into the eukaryotic host cell. • They carry their own DNA.

Features of the mitochondrial genome • A circular DNA molecule • Contains little non-coding regions (no introns- has a bacterial ancestor) • Only inherited through maternal ancestry (mt. DNA always comes from the mother) • Accumulates DNA mutations (different mutations accumulate in different isolated human populations) • The different mutation types are called haplogroups • Can be used to determine how closely evolutionarily related different races are

7. Comparative Genomics • The study of the relationships between the genomes of different species. • We can identify relationships by comparing the fraction of shared genes between species. • The greater the degree of shared genes the more closer is the relationship.

8. Immunology The more similar the different species are to the original salamander (the one that had its blood injected into the rat), then the more precipitation occurs

The big picture • http: //www. sumanasinc. com/webcontent/ani mations/content/evolution. html Good summary of evidence for evolution and natural selection (watch both animations)

Types of Evolution

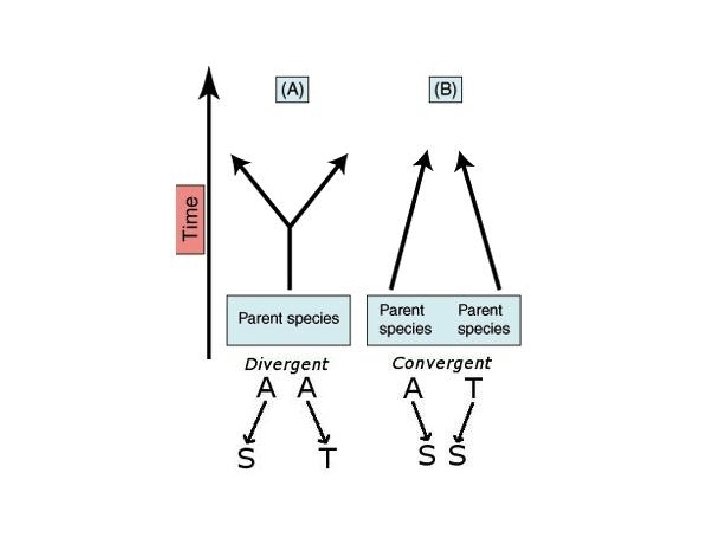
Divergent Evolution • Closely related species become more dissimilar over time, in response to different selection pressures. • Adaptive radiation is when a variety of different species evolve from a single ancestral species (a type of divergent evolution).

Adaptive radiation • The process whereby organisms with a common ancestor develop into various sub-species, or new species due to different environmental selection pressures (e. g. different food sources)
")
Adaptive Radiation (a type of divergent evolution)
")
Homologous Structures (evidence of divergent evolution)

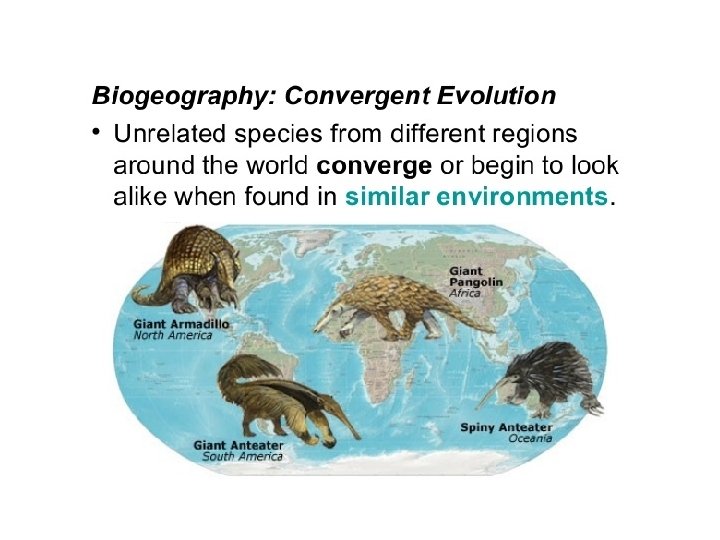
Convergent Evolution • Over time selection pressures may act on distantly related species to produce similarities called analogous structures. • This is due to similar selection pressures
")
Analogous Structures (evidence of convergent evolution)
 of")
Co-evolution • Coevolution is a change in the genetic composition (and therefore phenotype) of one species (or group) in response to a genetic (and therefore phenotypic) change in another. Crabs with more powerful claws are selected for NEVER write that a species “evolves” some feature…. . it is “selected for”

Depicting Evolutionary Relationships • Phylogeny is the study of evolutionary relationships between species. • These relationships are depicted in a branching diagram called a cladogram or phylogenetic tree.
 • All the species at a particular branch point share a")
Cladograms (Phylogenetic Trees) • All the species at a particular branch point share a common ancestor. • The approximate time that the species existed and branched from each other is shown on the side (usually as millions of years ago – mya) • Extinct organisms will not be at the present day time point. Species A is extinct

Constructing Phylogenetic Trees • Branches terminate at a single species. • Adding branch lengths gives an indication of the evolutionary time since a divergent event.

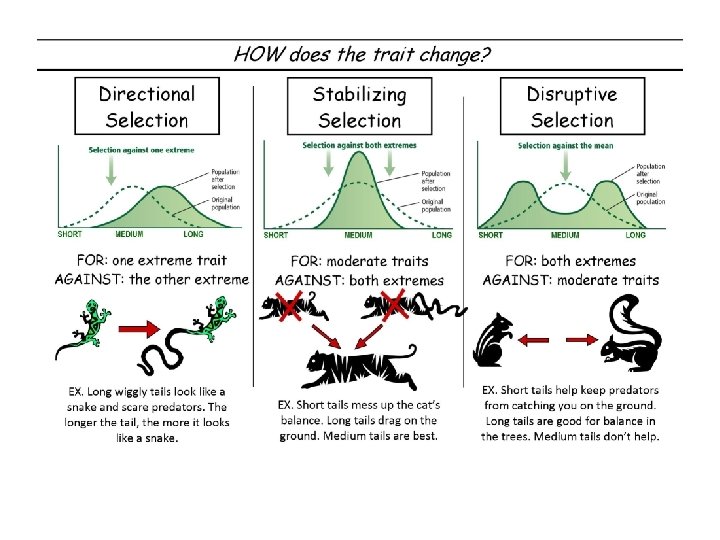
Change can be gradual over time The theory of evolution by natural selection is based upon slow gradual change within a species over time. Change within a species is termed micro-evolution.

Change can be punctuated over time Another model has been proposed for macro-evolution. The “Punctuated model” proposes that species persist unchanged for long periods of time that is then punctuated by short intervals of rapid evolutionary speciation. Somewhat supported by the fossil record.
- Slides: 76