
The evaluation of rainfall influence on CSO characteristics


- Slides: 17
The evaluation of rainfall influence on CSO characteristics: the Berlin case study S. Sandoval*, A. Torres*, E. Pawlowsky-Reusing **, M. Riechel*** and N. Caradot*** * ** *** Pontificia Universidad Javeriana, Bogotá, Colombia Berliner Wasserbetriebe, Berlin, Germany Kompetenzzentrum Wasser Berlin, Germany
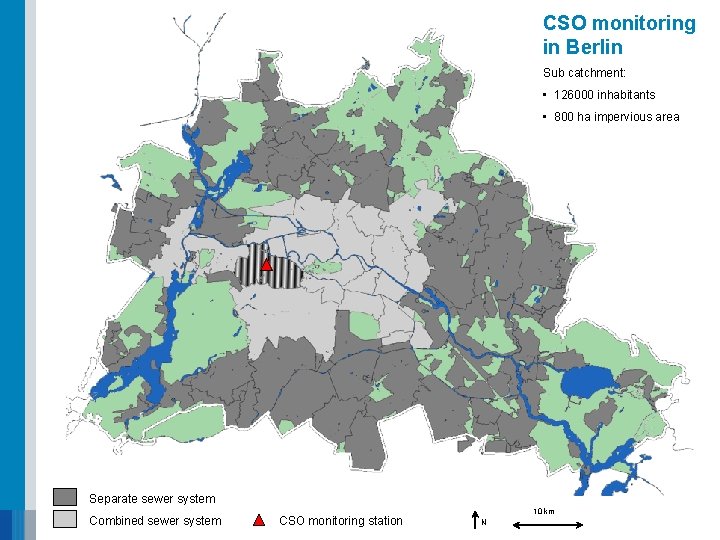
CSO monitoring in Berlin Sub catchment: • 126000 inhabitants • 800 ha impervious area Separate sewer system Combined sewer system CSO monitoring station 10 km N
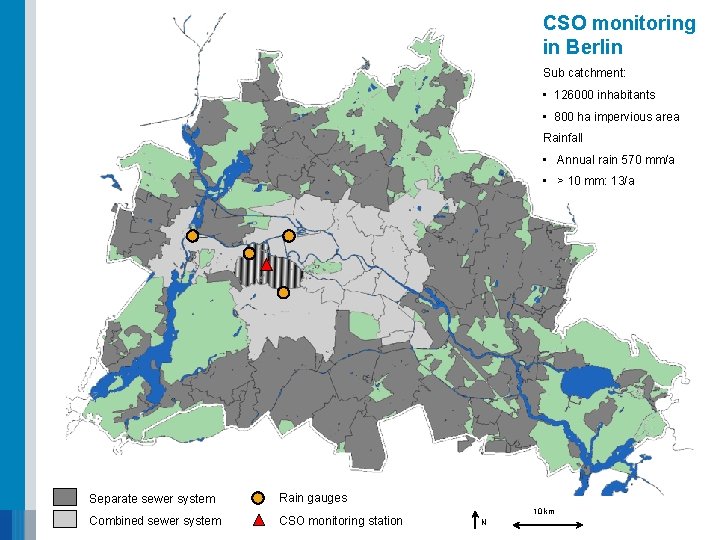
CSO monitoring in Berlin Sub catchment: • 126000 inhabitants • 800 ha impervious area Rainfall • Annual rain 570 mm/a • > 10 mm: 13/a Separate sewer system Rain gauges Combined sewer system CSO monitoring station 10 km N
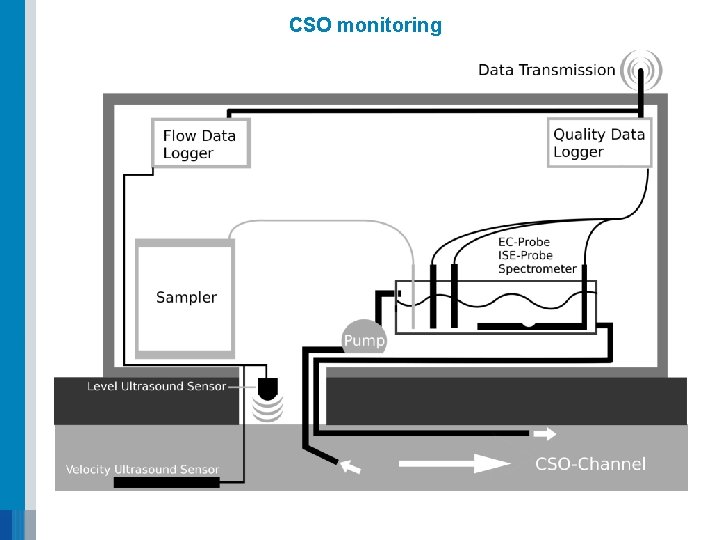
CSO monitoring
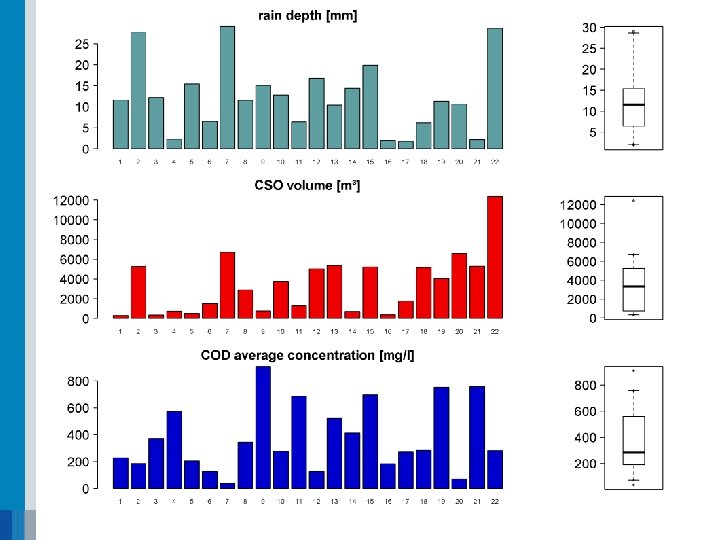
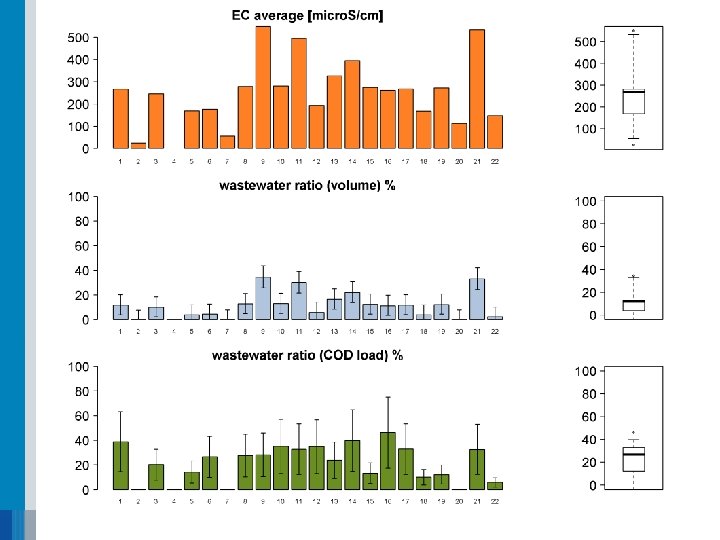
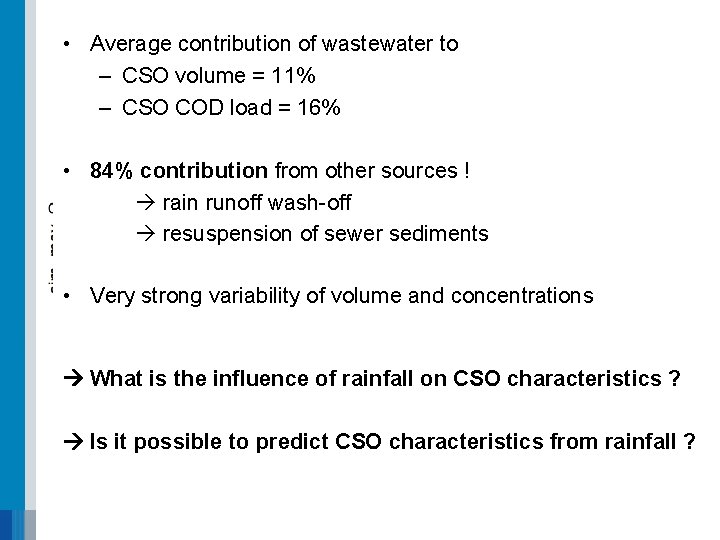
• Average contribution of wastewater to – CSO volume = 11% – CSO COD load = 16% • 84% contribution from other sources ! rain runoff wash-off resuspension of sewer sediments • Very strong variability of volume and concentrations What is the influence of rainfall on CSO characteristics ? Is it possible to predict CSO characteristics from rainfall ?
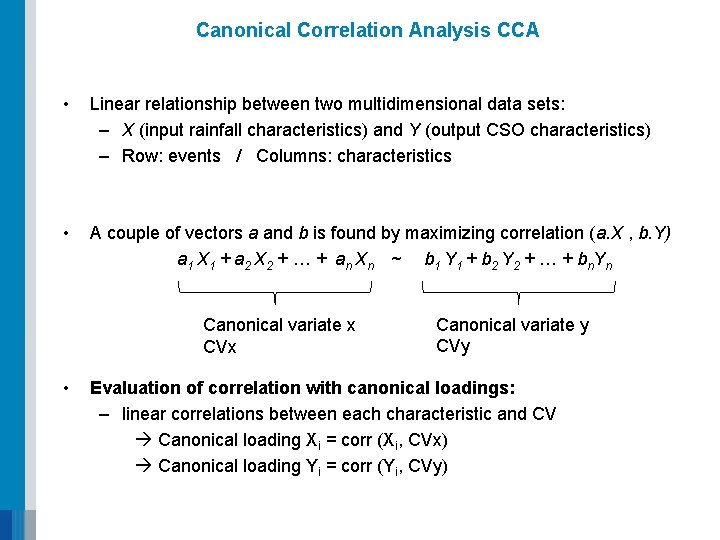
Canonical Correlation Analysis CCA • Linear relationship between two multidimensional data sets: – X (input rainfall characteristics) and Y (output CSO characteristics) – Row: events / Columns: characteristics • A couple of vectors a and b is found by maximizing correlation (a. X , b. Y) a 1 X 1 + a 2 X 2 + … + an Xn ~ b 1 Y 1 + b 2 Y 2 + … + bn. Yn Canonical variate x CVx • Canonical variate y CVy Evaluation of correlation with canonical loadings: – linear correlations between each characteristic and CV Canonical loading Xi = corr (Xi, CVx) Canonical loading Yi = corr (Yi, CVy)
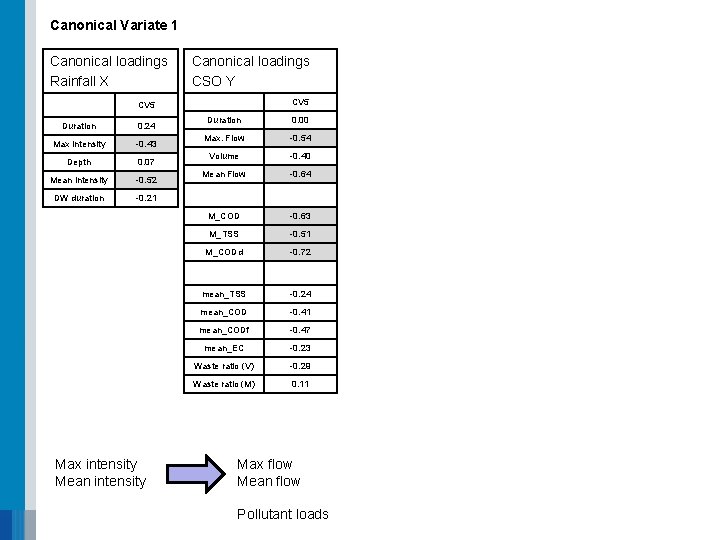
Canonical Variate 1 Canonical loadings Rainfall X CV 5 Duration 0. 24 Max intensity -0. 43 Depth 0. 07 Mean intensity -0. 52 DW duration -0. 21 Max intensity Mean intensity Canonical Variate 2 Canonical loadings CSO Y CV 5 Duration 0. 00 Max. Flow -0. 54 Volume -0. 40 Mean Flow -0. 64 Canonical loadings Rainfall X CV 6 Duration 0. 58 Max intensity 0. 35 Depth 0. 84 Mean intensity -0. 17 DW duration 0. 22 Canonical loadings CSO Y CV 6 Duration 0. 64 Max. Flow 0. 39 Volume 0. 72 Mean Flow 0. 09 M_COD -0. 63 M_COD 0. 12 M_TSS -0. 51 M_TSS 0. 23 M_CODd -0. 72 M_CODd 0. 13 mean_TSS -0. 24 mean_TSS -0. 55 mean_COD -0. 41 mean_COD -0. 57 mean_CODf -0. 47 mean_CODf -0. 62 mean_EC -0. 23 mean_EC -0. 71 Waste ratio (V) -0. 29 Waste ratio (V) -0. 71 Waste ratio (M) 0. 11 Waste ratio (M) -0. 60 Max flow Mean flow Pollutant loads Duration Depth Duration Volume Mean concentrations
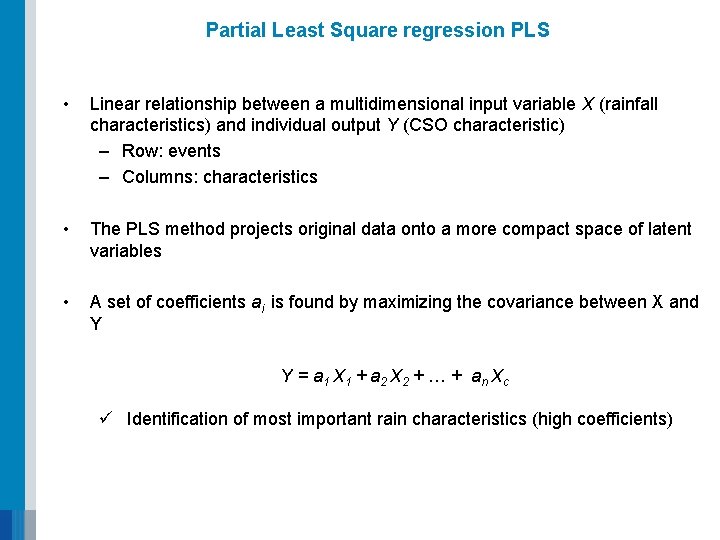
Partial Least Square regression PLS • Linear relationship between a multidimensional input variable X (rainfall characteristics) and individual output Y (CSO characteristic) – Row: events – Columns: characteristics • The PLS method projects original data onto a more compact space of latent variables • A set of coefficients ai is found by maximizing the covariance between X and Y Y = a 1 X 1 + a 2 X 2 + … + an Xc ü Identification of most important rain characteristics (high coefficients)
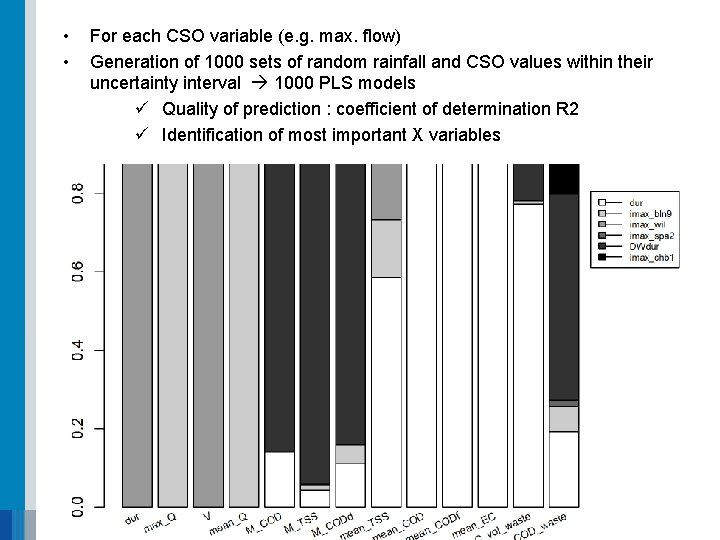
• • For each CSO variable (e. g. max. flow) Generation of 1000 sets of random rainfall and CSO values within their uncertainty interval 1000 PLS models ü Quality of prediction : coefficient of determination R 2 ü Identification of most important X variables
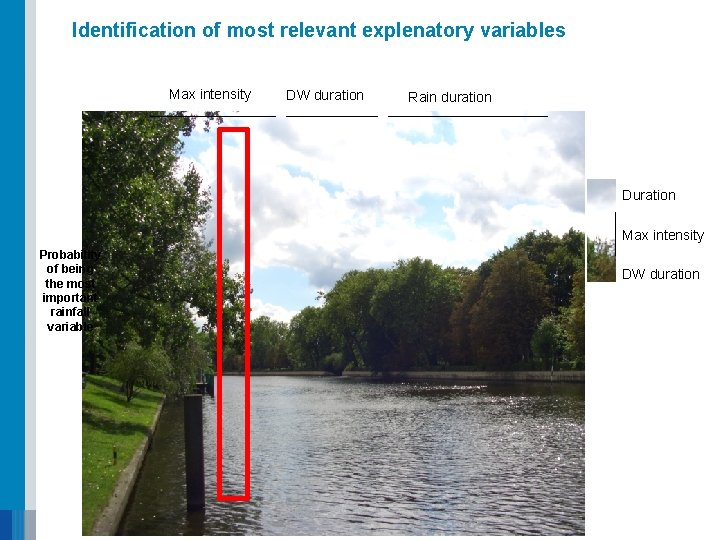
Identification of most relevant explenatory variables Max intensity DW duration Rain duration Duration Max intensity Probability of being the most important rainfall variable DW duration
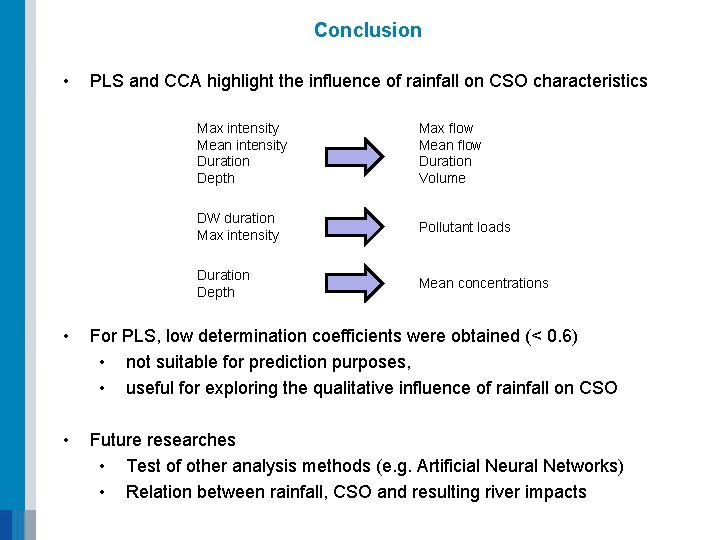
Conclusion • PLS and CCA highlight the influence of rainfall on CSO characteristics Max intensity Mean intensity Duration Depth Max flow Mean flow Duration Volume DW duration Max intensity Pollutant loads Duration Depth Mean concentrations • For PLS, low determination coefficients were obtained (< 0. 6) • not suitable for prediction purposes, • useful for exploring the qualitative influence of rainfall on CSO • Future researches • Test of other analysis methods (e. g. Artificial Neural Networks) • Relation between rainfall, CSO and resulting river impacts
Thank you for your attention ! More information : nicolas. caradot@kompetenz-wasser. de
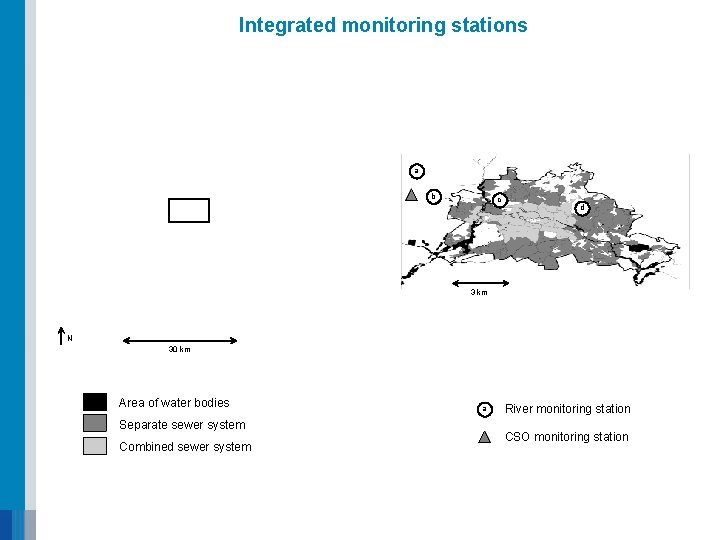
Integrated monitoring stations a b c d 3 km N 30 km Area of water bodies Separate sewer system Combined sewer system a River monitoring station CSO monitoring station