
The EUs Agricultural Policy Trees Robijns 12 June
The EU‘s Agricultural Policy Trees Robijns 12 June 2018
Overview of the presentation Part I • Agriculture in the EU Part II • Zoom: agriculture & environment Part III • The CAP of today Part IV • A history of reforms Part V • The 2013 Reform in more detail Part VI • Where do we go next? 2
PART I: AGRICULTURE IN THE EU 3
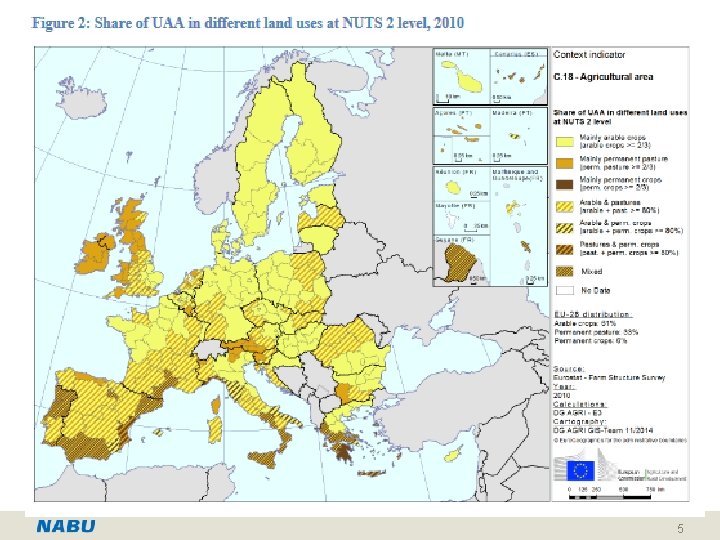
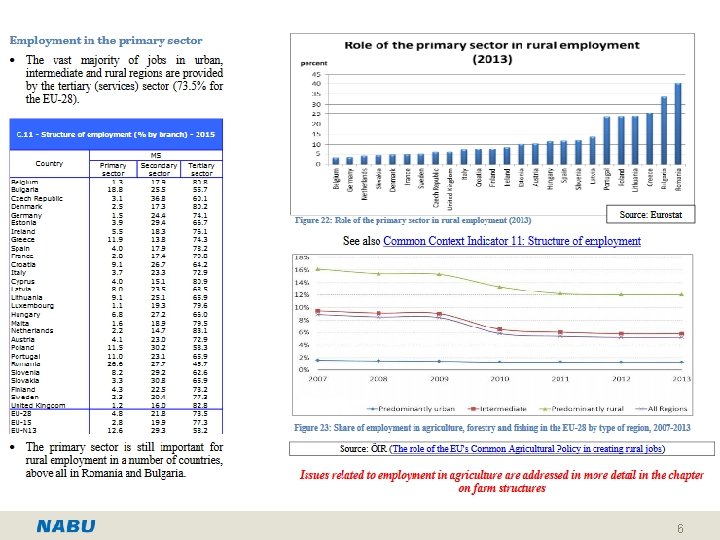
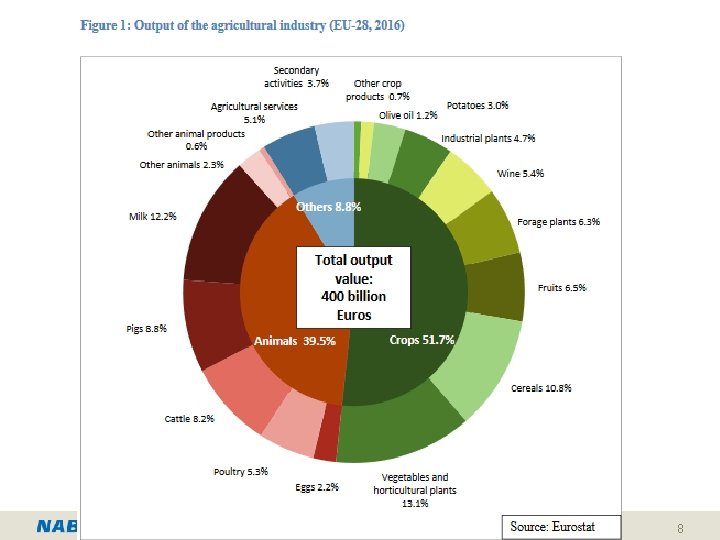
Agriculture in the EU The Role of Agriculture • 47 % of EU’s land area, 12 million farmers • 7 % of all jobs (+ food sector) generating 6 % of GDP • EU leading exporter of agricultural products Trends • 1990 -2010: number of farmers halved • Productivity increased significantly (intensification & specialisation) • Average farm size growing (15 ha), but still primarily on small family holdings 4
5
6
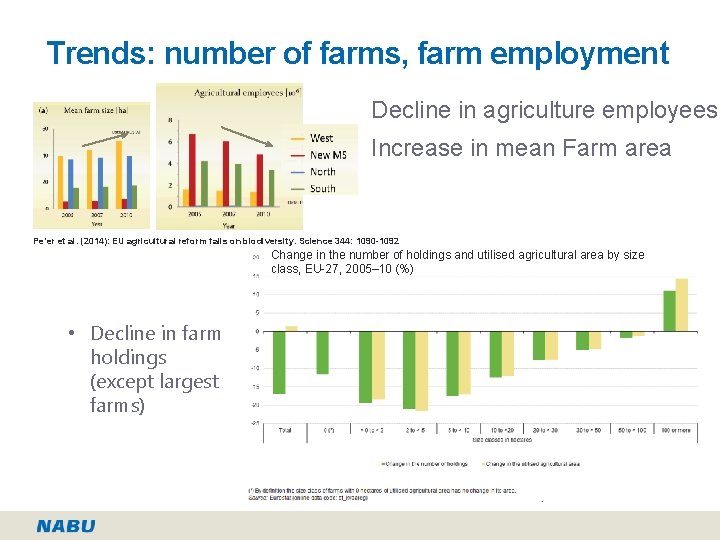
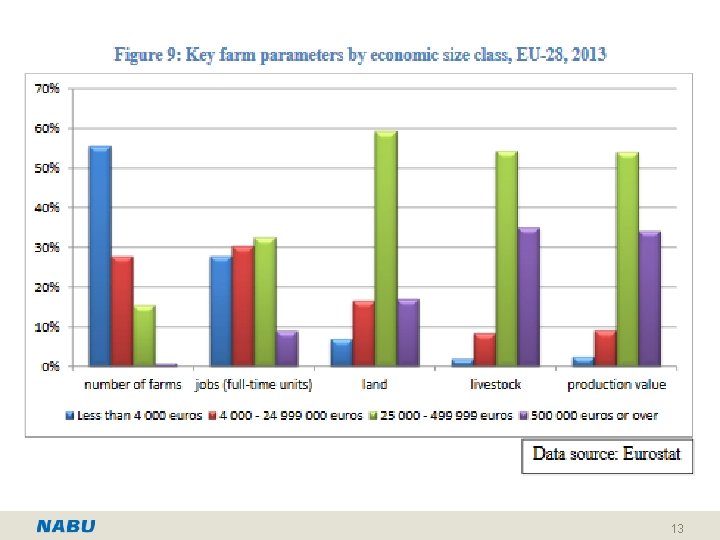
Trends: number of farms, farm employment Decline in agriculture employees Increase in mean Farm area Pe’er et al. (2014): EU agricultural reform fails on biodiversity. Science 344: 1090 -1092 Change in the number of holdings and utilised agricultural area by size class, EU-27, 2005– 10 (%) • Decline in farm holdings (except largest farms)
8
9
10
11
12
13
14
PART II: ZOOM: AGRICULTURE AND ENVIRONMENT (NATURE) 15
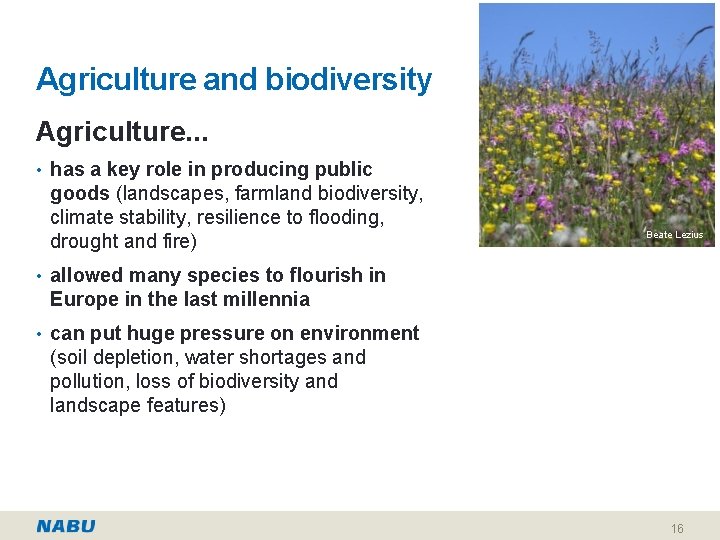
Agriculture and biodiversity Agriculture. . . • has a key role in producing public goods (landscapes, farmland biodiversity, climate stability, resilience to flooding, drought and fire) Beate Lezius • allowed many species to flourish in Europe in the last millennia • can put huge pressure on environment (soil depletion, water shortages and pollution, loss of biodiversity and landscape features) 16
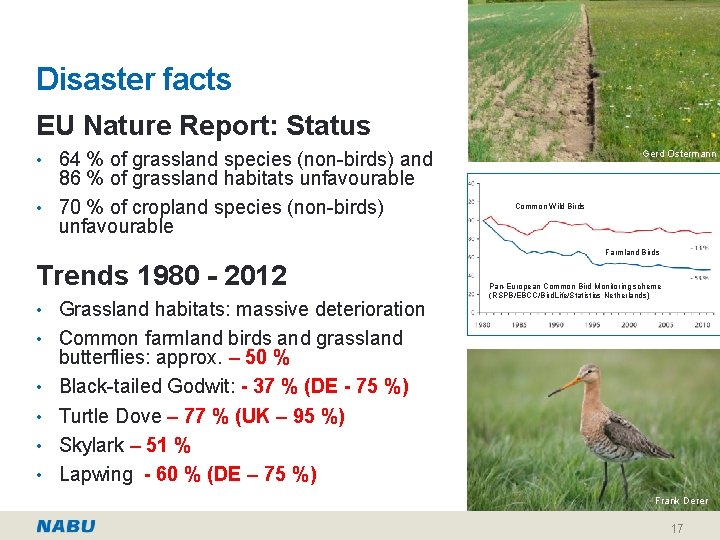
Disaster facts EU Nature Report: Status • 64 % of grassland species (non-birds) and 86 % of grassland habitats unfavourable • 70 % of cropland species (non-birds) unfavourable Beate Lezius Gerd Ostermann Common Wild Birds Farmland Birds Trends 1980 - 2012 • Grassland habitats: massive deterioration • Common farmland birds and grassland • • Pan-European Common Bird Monitoring scheme (RSPB/EBCC/Bird. Life/Statistics Netherlands) Skylark 2008 -2012; Pan-European Common Bird Monitoring scheme (RSPB/EBCC/Bird. Life/Statistics Netherlands) butterflies: approx. – 50 % Black-tailed Godwit: - 37 % (DE - 75 %) Turtle Dove – 77 % (UK – 95 %) Skylark – 51 % Lapwing - 60 % (DE – 75 %) Frank Derer 17
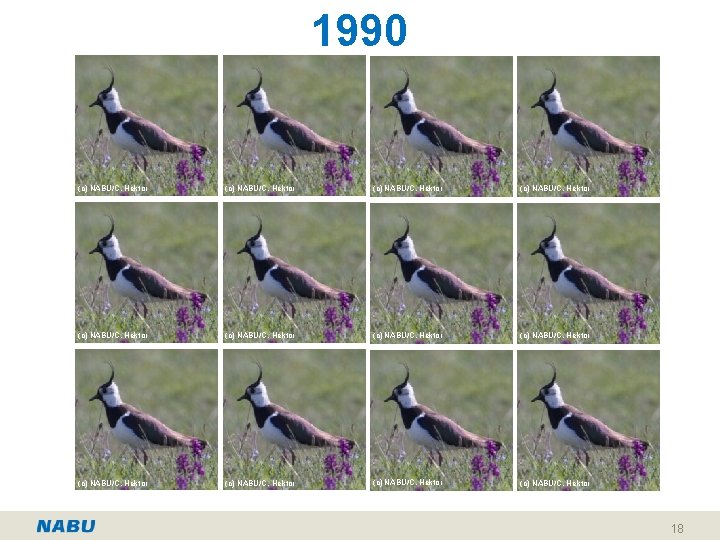
1990 (c) NABU/C. Hektor (c) NABU/C. Hektor 18
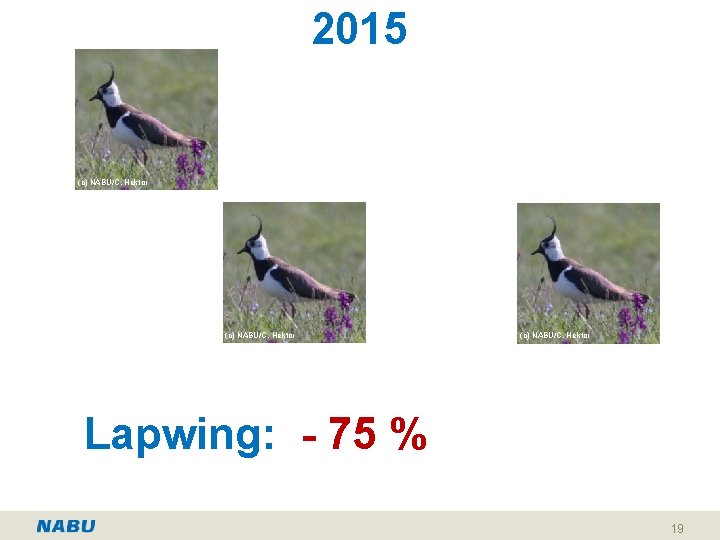
2015 (c) NABU/C. Hektor Lapwing: - 75 % 19
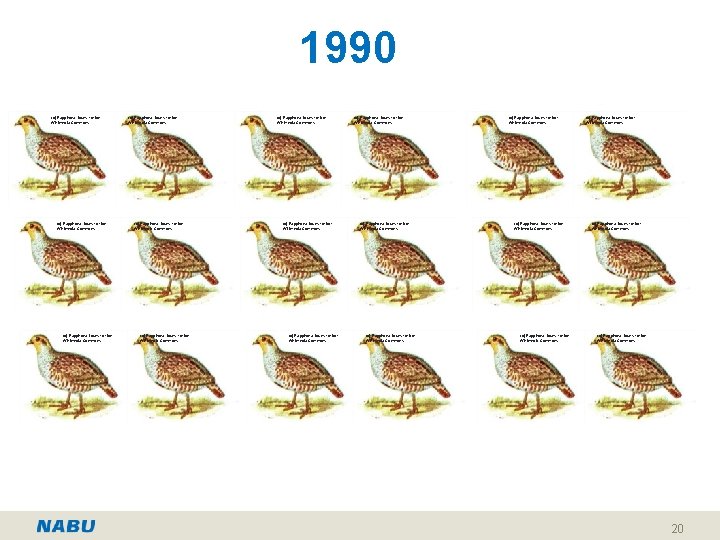
1990 (c) Rapphöna, Iduns kokbok Wikimedia Commons (c) Rapphöna, Iduns kokbok Wikimedia Commons (c) NABU/C. Hektor (c) Rapphöna, Iduns kokbok Wikimedia Commons (c) Rapphöna, Iduns kokbok Wikimedia Commons (c) Rapphöna, Iduns kokbok Wikimedia Commons 20
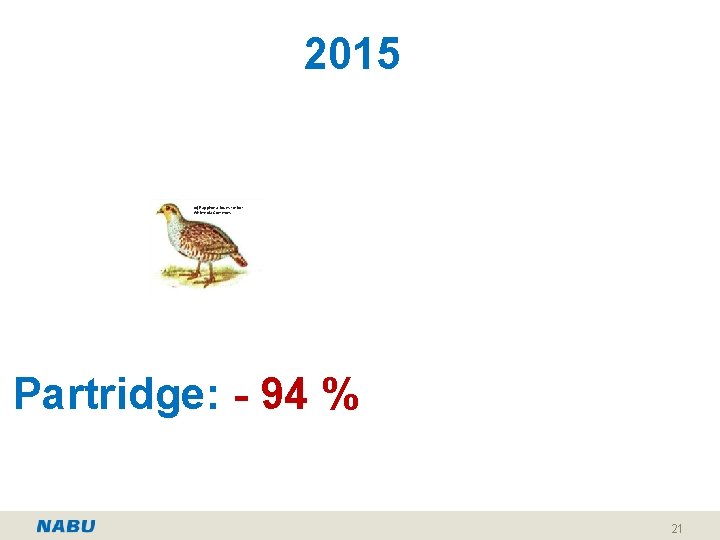
2015 (c) NABU/C. Hektor (c) Rapphöna, Iduns kokbok Wikimedia Commons Partridge: - 94 % 21
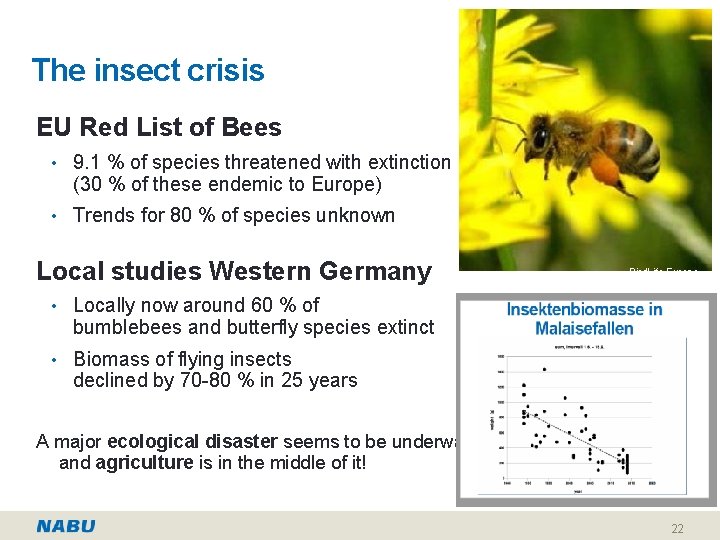
The insect crisis EU Red List of Bees • 9. 1 % of species threatened with extinction Frank Derer (30 % of these endemic to Europe) • Trends for 80 % of species unknown Local studies Western Germany Thorsten Krüger Bird. Life Europe • Locally now around 60 % of bumblebees and butterfly species extinct • Biomass of flying insects declined by 70 -80 % in 25 years A major ecological disaster seems to be underway, and agriculture is in the middle of it! 22
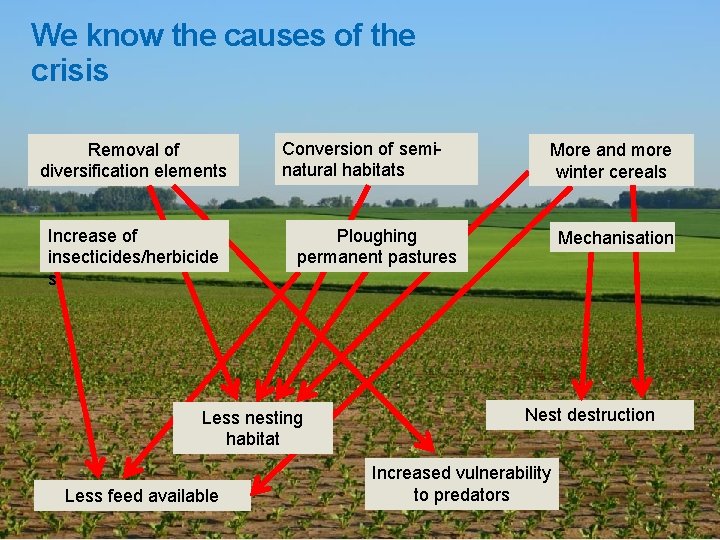
We know the causes of the crisis Removal of diversification elements Increase of insecticides/herbicide s Conversion of seminatural habitats Ploughing permanent pastures Less nesting habitat Less feed available More and more winter cereals Mechanisation Nest destruction Increased vulnerability to predators
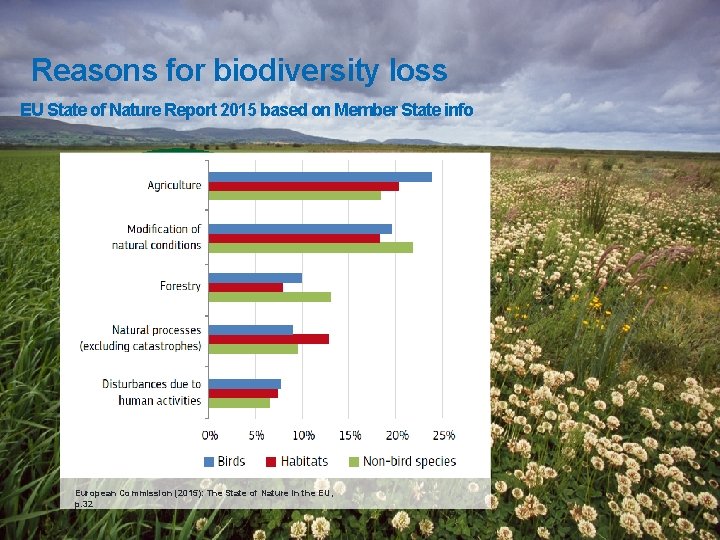
Reasons for biodiversity loss EU State of Nature Report 2015 based on Member State info European Commission (2015): The State of Nature in the EU, p. 32
PART III: THE CAP OF TODAY 25
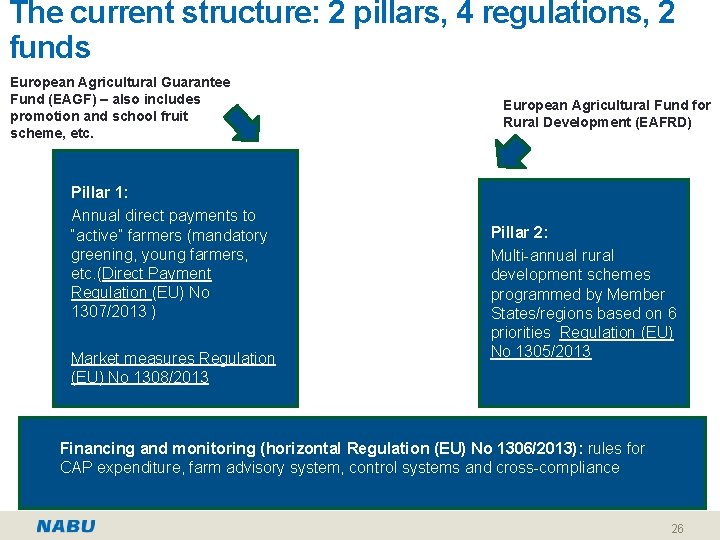
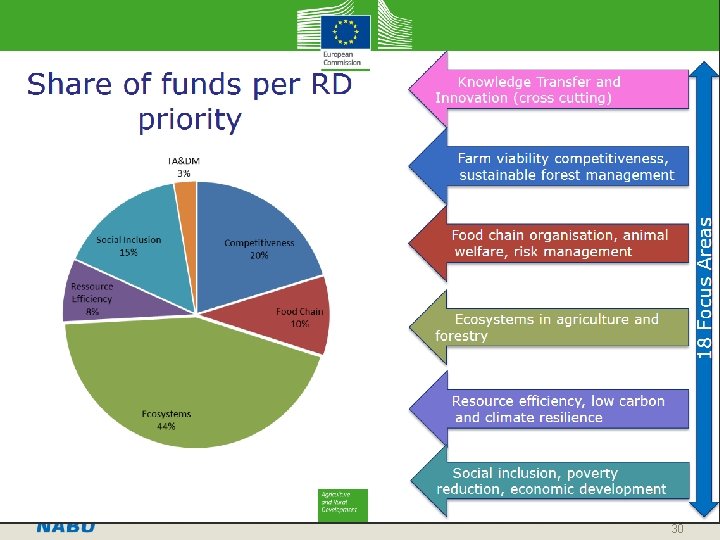
The current structure: 2 pillars, 4 regulations, 2 funds European Agricultural Guarantee Fund (EAGF) – also includes promotion and school fruit scheme, etc. Pillar 1: Annual direct payments to “active” farmers (mandatory greening, young farmers, etc. (Direct Payment Regulation (EU) No 1307/2013 ) • Market measures Regulation (EU) No 1308/2013 European Agricultural Fund for Rural Development (EAFRD) Pillar 2: Multi-annual rural development schemes programmed by Member States/regions based on 6 priorities Regulation (EU) No 1305/2013 Financing and monitoring (horizontal Regulation (EU) No 1306/2013): rules for CAP expenditure, farm advisory system, control systems and cross-compliance 26
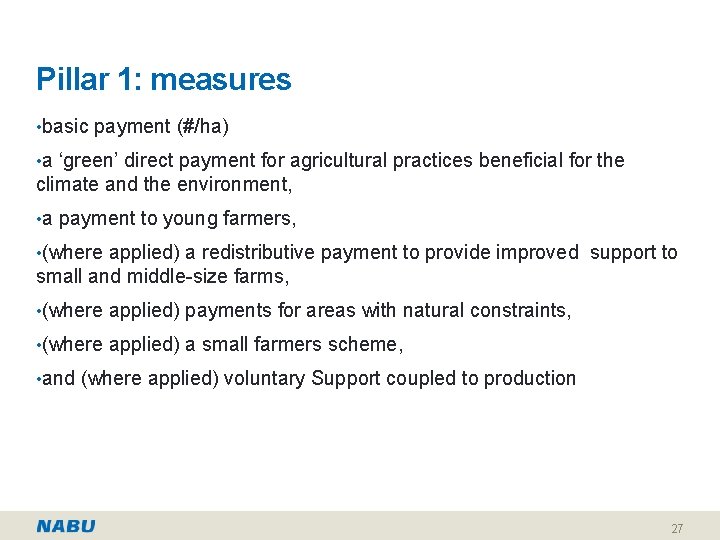
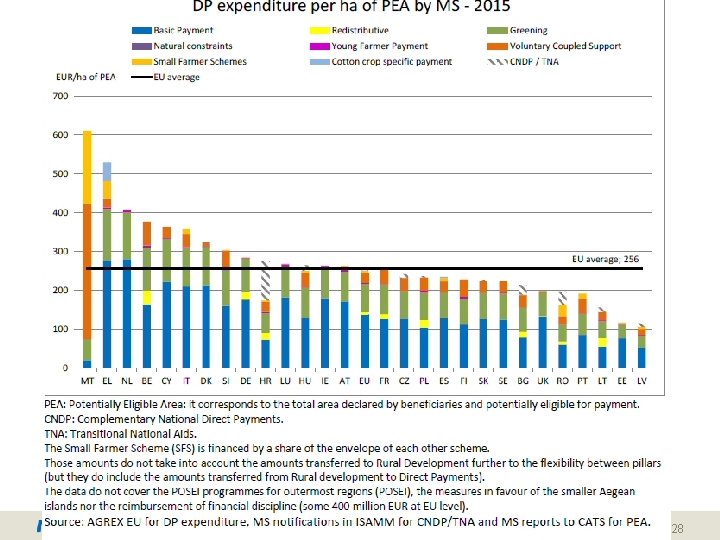
Pillar 1: measures • basic payment (#/ha) • a ‘green’ direct payment for agricultural practices beneficial for the climate and the environment, • a payment to young farmers, • (where applied) a redistributive payment to provide improved support to small and middle-size farms, • (where applied) payments for areas with natural constraints, • (where applied) a small farmers scheme, • and (where applied) voluntary Support coupled to production 27
28
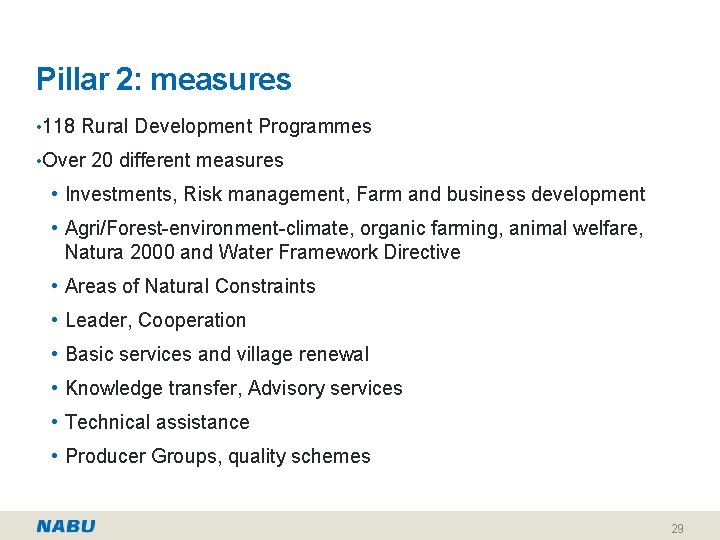
Pillar 2: measures • 118 Rural Development Programmes • Over 20 different measures • Investments, Risk management, Farm and business development • Agri/Forest-environment-climate, organic farming, animal welfare, Natura 2000 and Water Framework Directive • Areas of Natural Constraints • Leader, Cooperation • Basic services and village renewal • Knowledge transfer, Advisory services • Technical assistance • Producer Groups, quality schemes 29
30
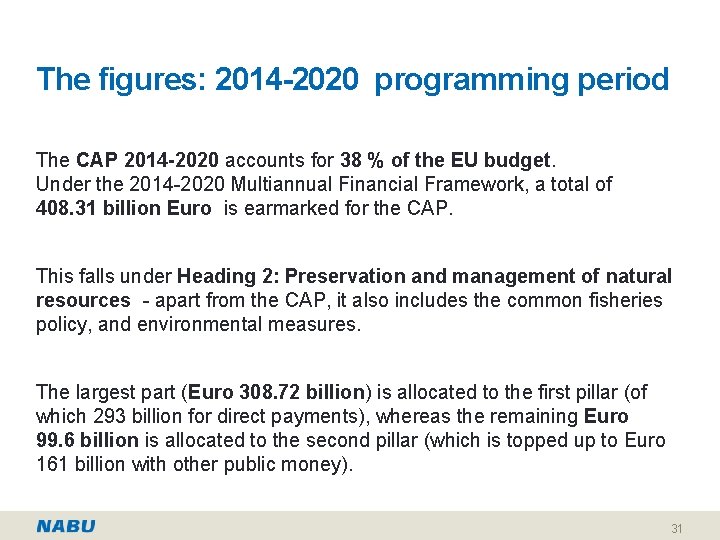
The figures: 2014 -2020 programming period The CAP 2014 -2020 accounts for 38 % of the EU budget. Under the 2014 -2020 Multiannual Financial Framework, a total of 408. 31 billion Euro is earmarked for the CAP. This falls under Heading 2: Preservation and management of natural resources - apart from the CAP, it also includes the common fisheries policy, and environmental measures. The largest part (Euro 308. 72 billion) is allocated to the first pillar (of which 293 billion for direct payments), whereas the remaining Euro 99. 6 billion is allocated to the second pillar (which is topped up to Euro 161 billion with other public money). 31
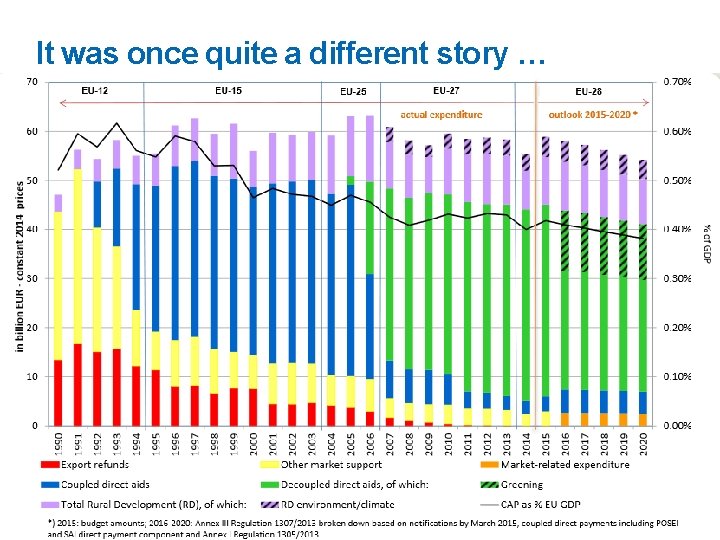
It was once quite a different story … 32
PART IV: A HISTORY OF REFORMS 33
The CAP: its origin • Western European countries coming out of the war • Six countries create the EEC (forerunner of the EU) in 1957 • agriculture included as part of the common market • Handing over real power to the community level • CAP objectives enshrined in the Treaty of Rome (art 39) a. To increase agricultural productivity by promoting technical progress and by ensuring the rational development of agricultural Production and the optimum utilization of the factors of production, in particular labor; b. thus to ensure a fair standard of living for the agricultural community in particular by increasing the individual earnings of persons engaged in agriculture; c. to stabilize markets; d. to ensure the availability of supplies; e. to ensure that supplies reach consumers at reasonable prices. 34
The CAP: its creation (1962) Principles a. Free intra-community trade; b. Community preference; c. common financing The start of: • common market organisations for 6 agri products, • competition rules, • a schedule to assist intra-community trade for dairy products, beef and veal was introduced, • establishment of the European Agricultural Guidance and Guarantee Fund 35
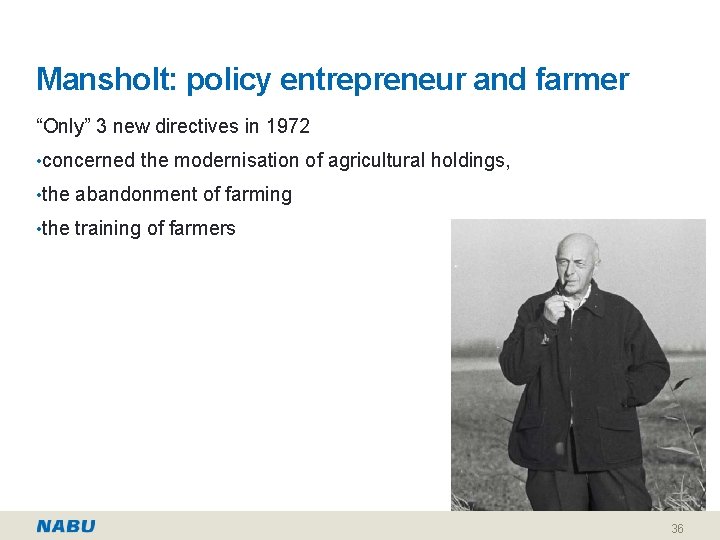
Mansholt: policy entrepreneur and farmer “Only” 3 new directives in 1972 • concerned the modernisation of agricultural holdings, • the abandonment of farming • the training of farmers 36
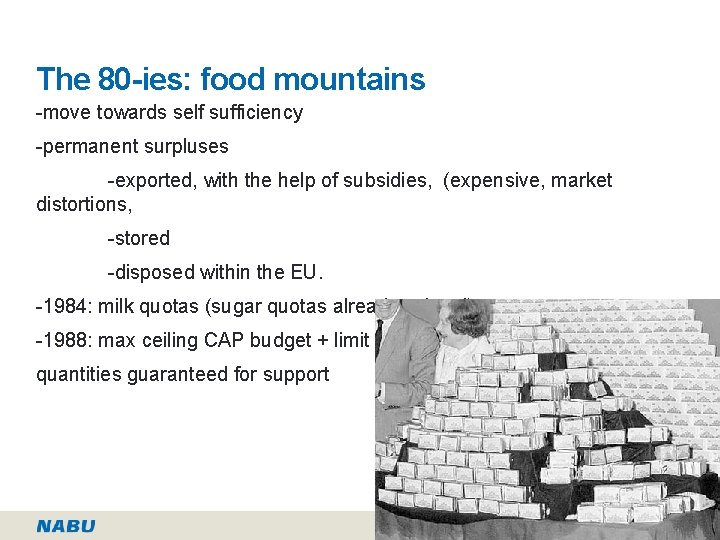
The 80 -ies: food mountains -move towards self sufficiency -permanent surpluses -exported, with the help of subsidies, (expensive, market distortions, -stored -disposed within the EU. -1984: milk quotas (sugar quotas already existed) -1988: max ceiling CAP budget + limit quantities guaranteed for support 37
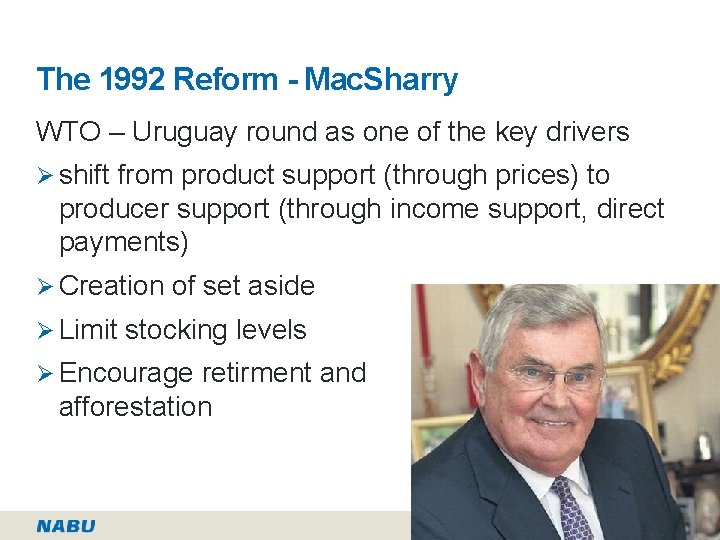
The 1992 Reform - Mac. Sharry WTO – Uruguay round as one of the key drivers Ø shift from product support (through prices) to producer support (through income support, direct payments) Ø Creation of set aside Ø Limit stocking levels Ø Encourage retirment and afforestation 38
Agenda 2000 -established economic, social, and environmental goals within the objectives of the CAP -small further reduction in market distortions -start of the rural development policy >> Already under the leadership of Franz Fischler 39
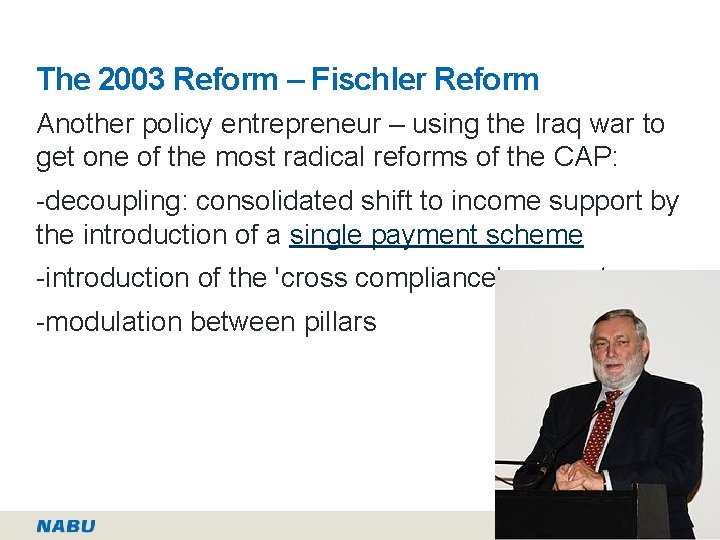
The 2003 Reform – Fischler Reform Another policy entrepreneur – using the Iraq war to get one of the most radical reforms of the CAP: -decoupling: consolidated shift to income support by the introduction of a single payment scheme -introduction of the 'cross compliance' concept -modulation between pillars 40

The 2013 Reform: The Ciolos reform § public money for public goods § introduction of greening § producer support § small farmers 41
PART V: THE LAST REFORM IN MORE DETAIL 42
The premise of last CAP reform The debate for 2014 -2020 • Real pressure on the EU budget – Budget and Agri debate at same time • Public money for public goods • Context: EU Biodiversity Strategy - Target 3: “Maximise areas under agriculture across grasslands, arable land permanent crops that are covered by biodiversity-related measures under the CAP” • first time Co-Decision with 28 Member States • Food security as a major driver of the public debate 43
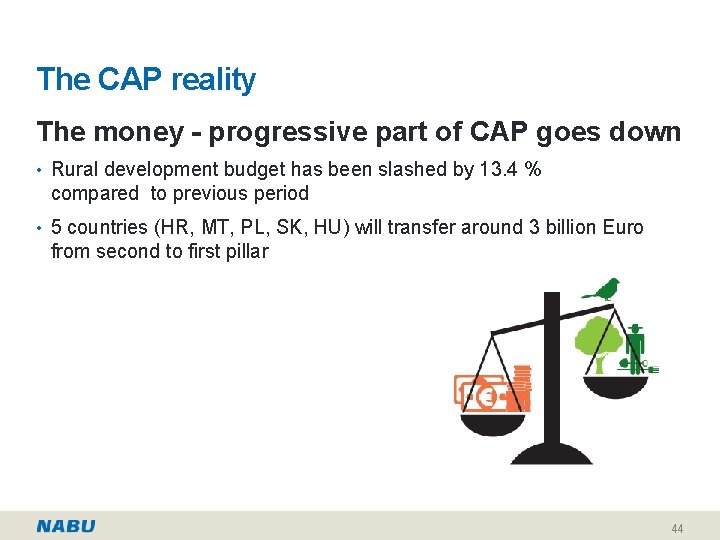
The CAP reality The money - progressive part of CAP goes down • Rural development budget has been slashed by 13. 4 % compared to previous period • 5 countries (HR, MT, PL, SK, HU) will transfer around 3 billion Euro from second to first pillar 44
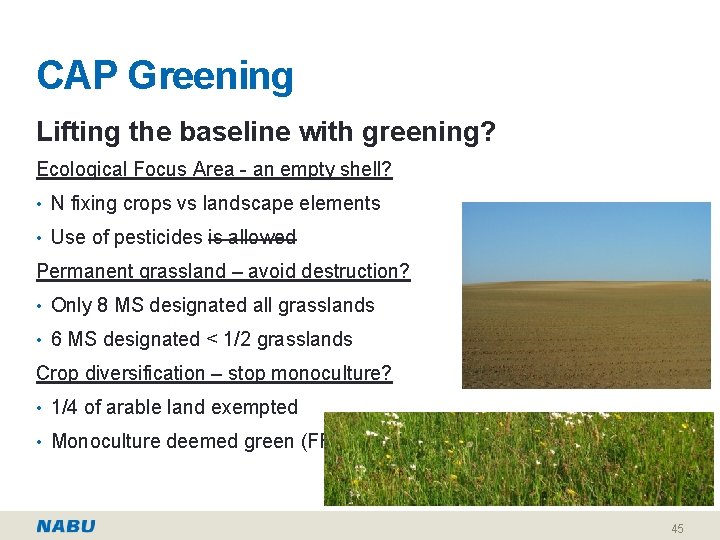
CAP Greening Lifting the baseline with greening? Ecological Focus Area - an empty shell? • N fixing crops vs landscape elements • Use of pesticides is allowed Permanent grassland – avoid destruction? • Only 8 MS designated all grasslands • 6 MS designated < 1/2 grasslands Crop diversification – stop monoculture? • 1/4 of arable land exempted • Monoculture deemed green (FR) Nagy 45
Rural Development Good intentions & numbers • MS were asked to maintain the 2007 -2013 level of efforts + spend 30% on environment & climate measures • MS were asked to increase targeting in AEM (ECA) • Agri-environment: 16. 8 % of total public expenditure • Total agricultural land under contracts supporting biodiversity and/or landscapes: 19 % 46
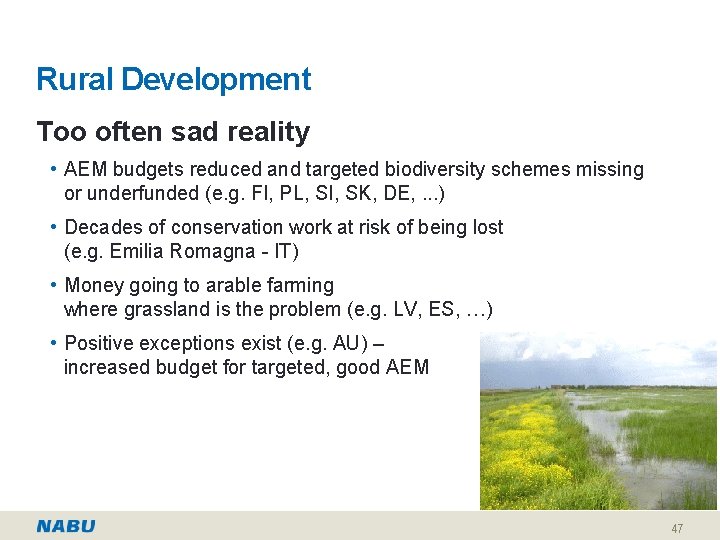
Rural Development Too often sad reality • AEM budgets reduced and targeted biodiversity schemes missing or underfunded (e. g. FI, PL, SI, SK, DE, . . . ) • Decades of conservation work at risk of being lost (e. g. Emilia Romagna - IT) • Money going to arable farming where grassland is the problem (e. g. LV, ES, …) • Positive exceptions exist (e. g. AU) – increased budget for targeted, good AEM 47
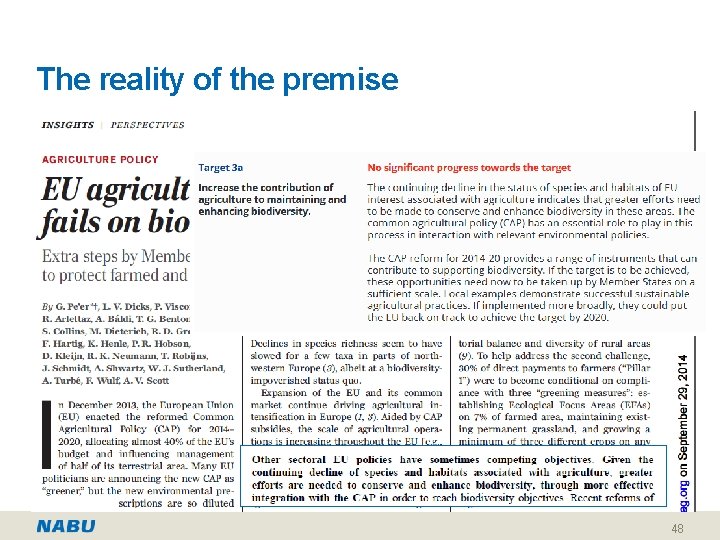
The reality of the premise 48
‘Green(wash)ing’ Direct Payments • MS choose least ambitious options • Weakening of CC • Reverse modulation • Move from ‘dark green’

PART VI: WHERE DO WE GO NEXT? 50
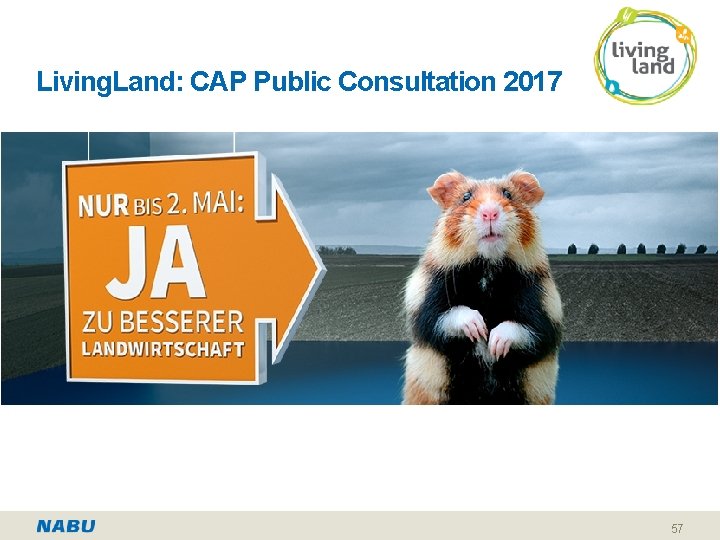
The CAP reform post 2020 Where do we stand • Commission’s impact assessment: February 2017 • Commission’s public consultation: May 2017 • Commission’s Communication: November 2017 • Commission’s Communication on MFF: May 2018 • Commission’s legislative proposals on the CAP: June 2018 • EP: Group positioning, Report on MFF ongoing • Council: debate started under Maltese Presidency 2017 • Stakeholders: positioning ongoing • Brexit: UK scheduled to leave EU: 29 March 2019 • Election EP: May 2019 and appointment new Commission 51
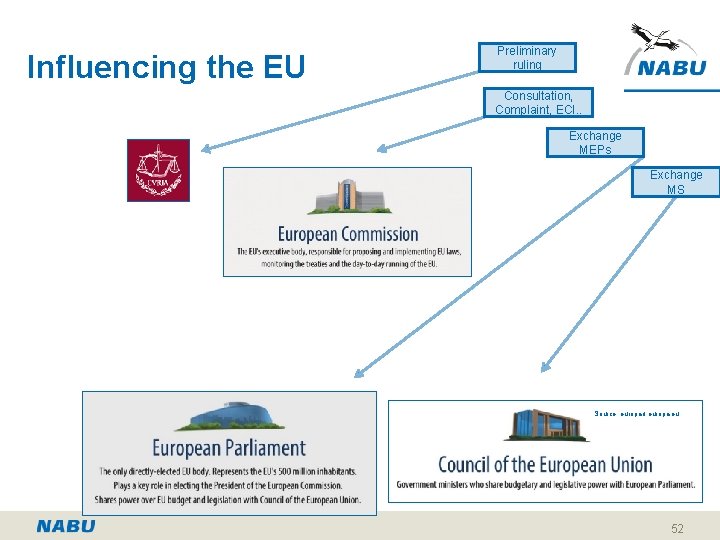
Influencing the EU Preliminary ruling Consultation, Complaint, ECI. . Exchange MEPs Exchange MS Source: europarl. europa. eu 52
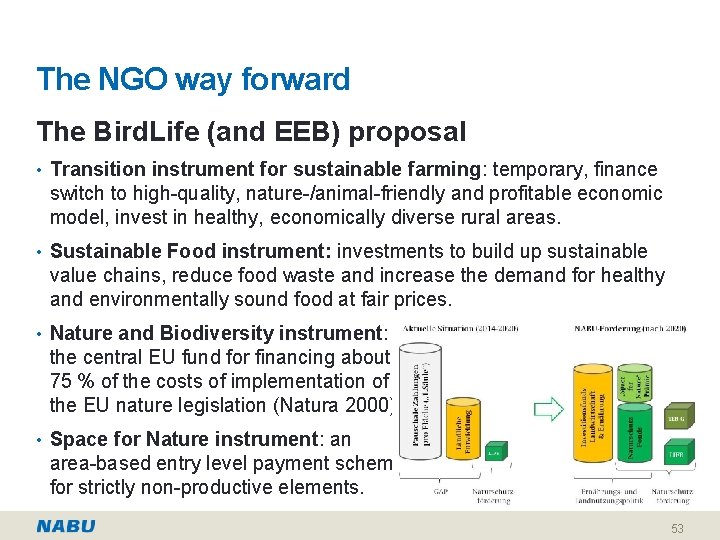
The NGO way forward The Bird. Life (and EEB) proposal • Transition instrument for sustainable farming: temporary, finance switch to high-quality, nature-/animal-friendly and profitable economic model, invest in healthy, economically diverse rural areas. • Sustainable Food instrument: investments to build up sustainable value chains, reduce food waste and increase the demand for healthy and environmentally sound food at fair prices. • Nature and Biodiversity instrument: the central EU fund for financing about 75 % of the costs of implementation of the EU nature legislation (Natura 2000). • Space for Nature instrument: an area-based entry level payment scheme for strictly non-productive elements. 53
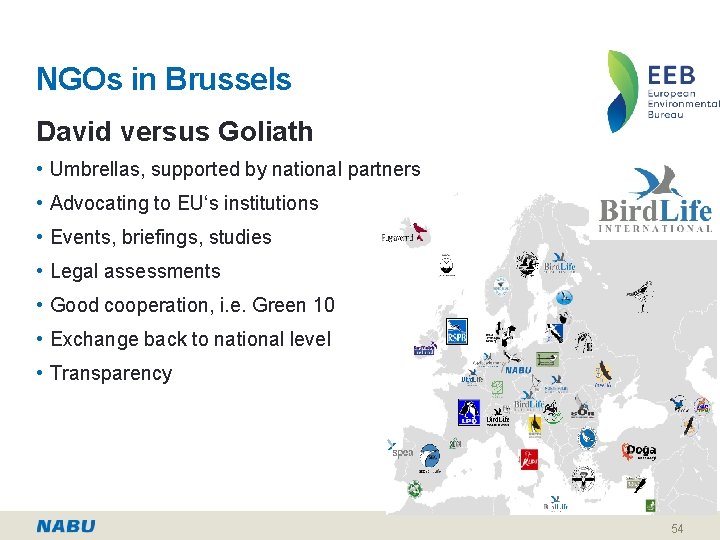
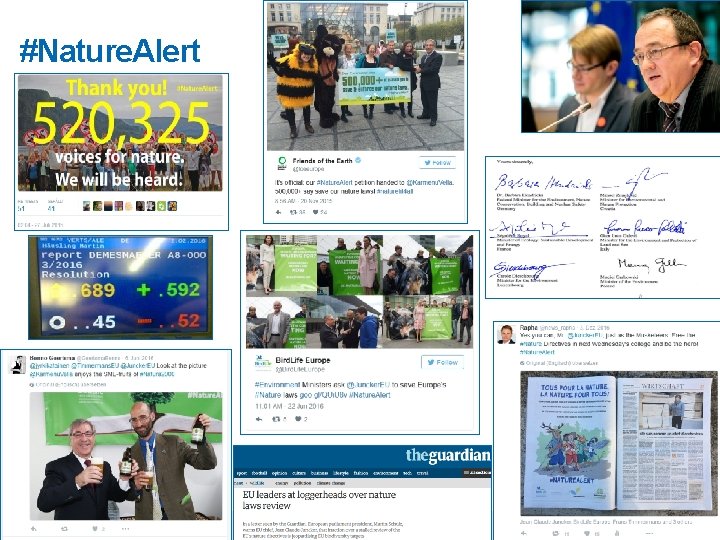
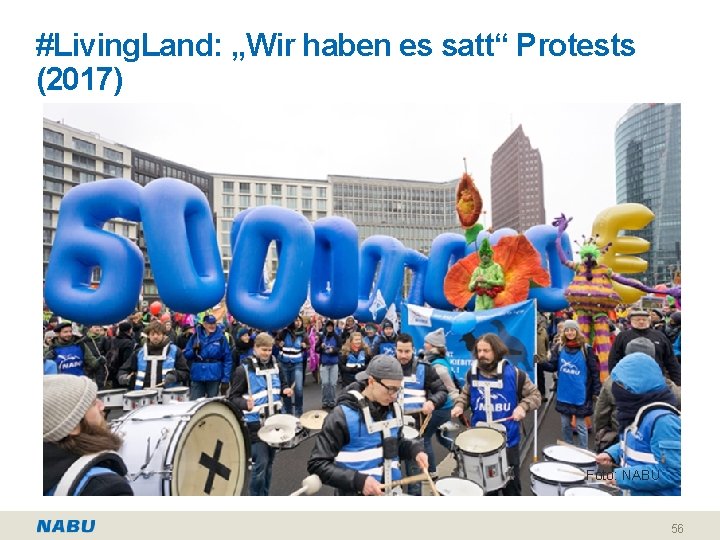
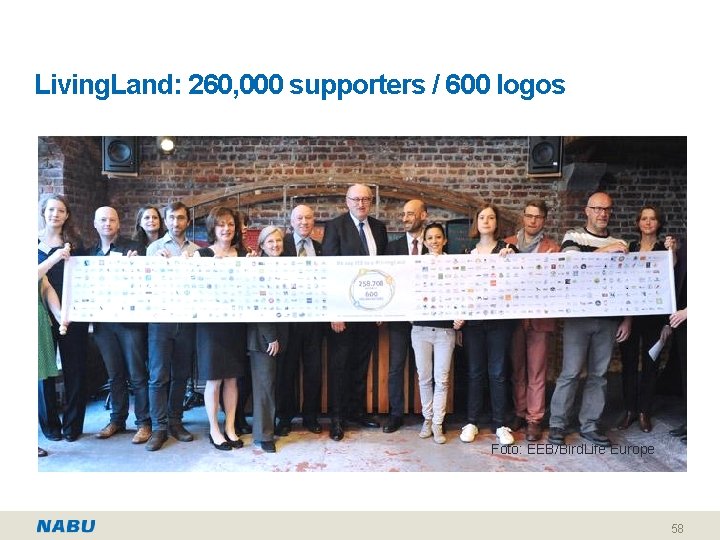
NGOs in Brussels David versus Goliath • Umbrellas, supported by national partners • Advocating to EU‘s institutions • Events, briefings, studies • Legal assessments • Good cooperation, i. e. Green 10 • Exchange back to national level • Transparency 54
#Nature. Alert 55
#Living. Land: „Wir haben es satt“ Protests (2017) Foto: NABU 56
Living. Land: CAP Public Consultation 2017 57
Living. Land: 260, 000 supporters / 600 logos Foto: EEB/Bird. Life Europe 58
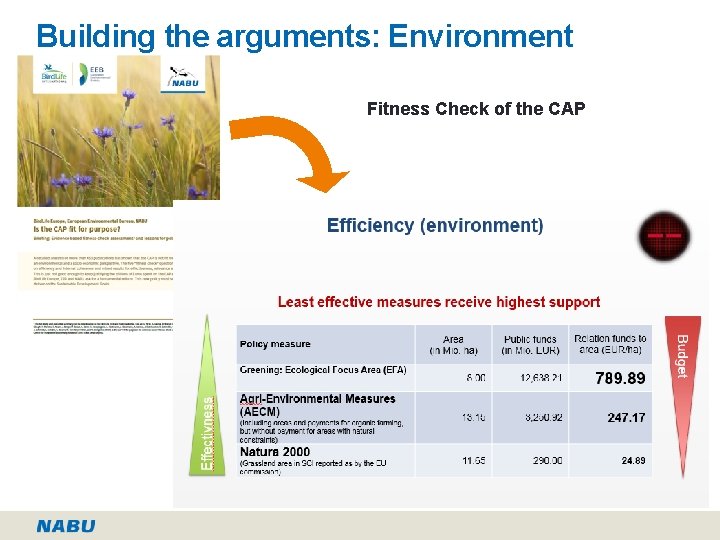
Building the arguments: Environment Fitness Check of the CAP
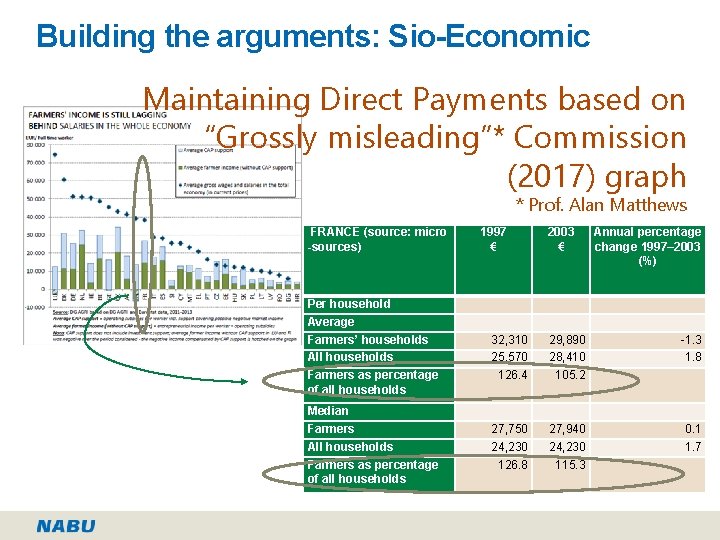
Building the arguments: Sio-Economic Maintaining Direct Payments based on “Grossly misleading”* Commission (2017) graph * Prof. Alan Matthews FRANCE (source: micro -sources) Per household Average Farmers’ households All households Farmers as percentage of all households Median Farmers All households Farmers as percentage of all households 1997 € 2003 € Annual percentage change 1997– 2003 (%) 32, 310 25, 570 126. 4 29, 890 28, 410 105. 2 -1. 3 1. 8 27, 750 24, 230 126. 8 27, 940 24, 230 115. 3 0. 1 1. 7
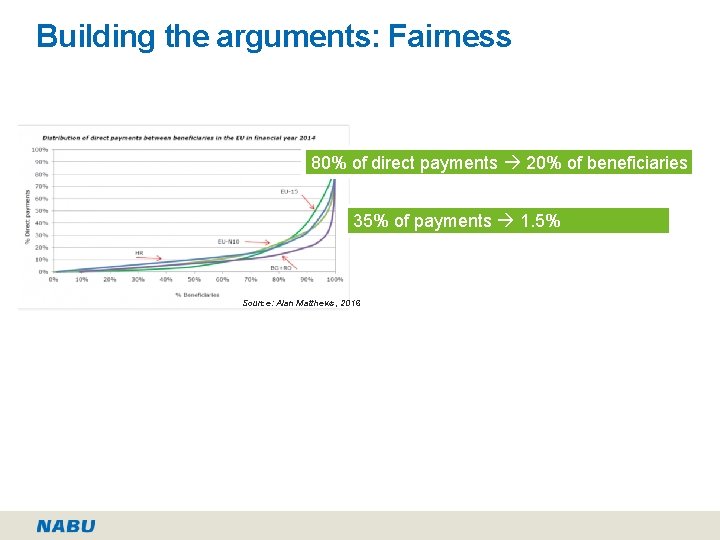
Building the arguments: Fairness 80% of direct payments 20% of beneficiaries 35% of payments 1. 5% beneficiaries Source: Alan Matthews, 2016
The post 2020 CAP ‘A Smarter, Modern and Sustainable CAP’? Key idea: • More flexibility for Member States • Results driven • EU level set objectives But, inconsistencies: • In denial of environmental problems of farmland • Maintenance of Direct Payments and current structure
Why also this CAP reform will remain an interesting discussion to follow! • Brexit • Sustainable Development Goals and Paris Agreement • European Elections • Larger Public interest • Back to the past market wise? What do you think is the future for food and farming? The future of Europe? The future of the CAP?
Thank you for your attention! Trees Robijns Agriculture and Bioenergy policy officer NABU Charitéstraße 3 10117 Berlin trees. robijns@nabu. de www. NABU. de 64
- Slides: 64