
The European Union Geographics and Demographics Dr Barry
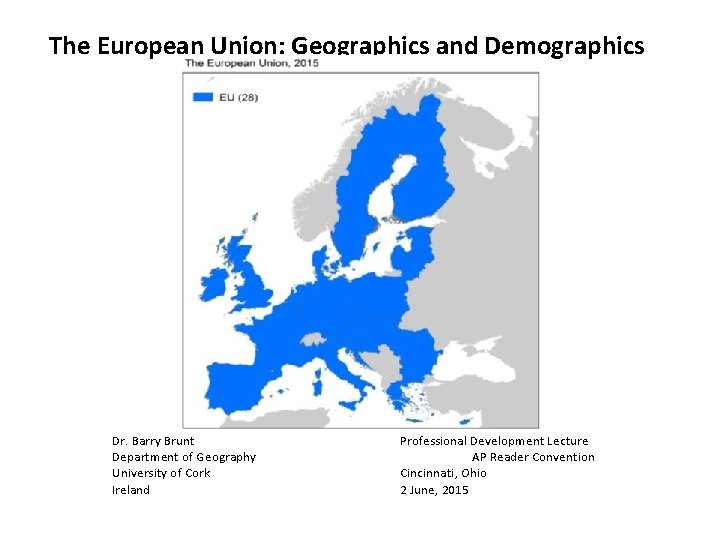
The European Union: Geographics and Demographics Dr. Barry Brunt Department of Geography University of Cork Ireland Professional Development Lecture AP Reader Convention Cincinnati, Ohio 2 June, 2015
The European Union: The Logic of Geography? • In 1950, Robert Schuman declared that European unity has: “always been prescribed by geography (but) prevented by history. ” Prescriptions of geography; - diversity, complementarity, transferability • Prevention of history: - Intense nationalism (protectionism, particularism, ethnocentrism) • Post WW 2: role of history changed - Complements geographic forces and logic of unity
• In new bi-polar world (USA and USSR) - Europe emerges as a transition region - Divided internally by an ‘iron curtain’ • CEE – new formal/functional identities imposed by USSR • W. Europe aligns with USA - To protect/promote free market democracies - Recognises economic benefits of US development model - Co-ordinates not compartmentalises economic space
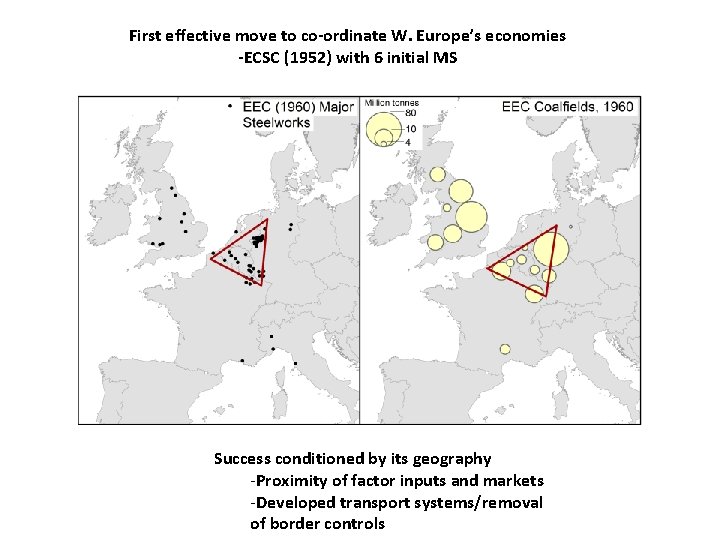
First effective move to co-ordinate W. Europe’s economies -ECSC (1952) with 6 initial MS Success conditioned by its geography -Proximity of factor inputs and markets -Developed transport systems/removal of border controls
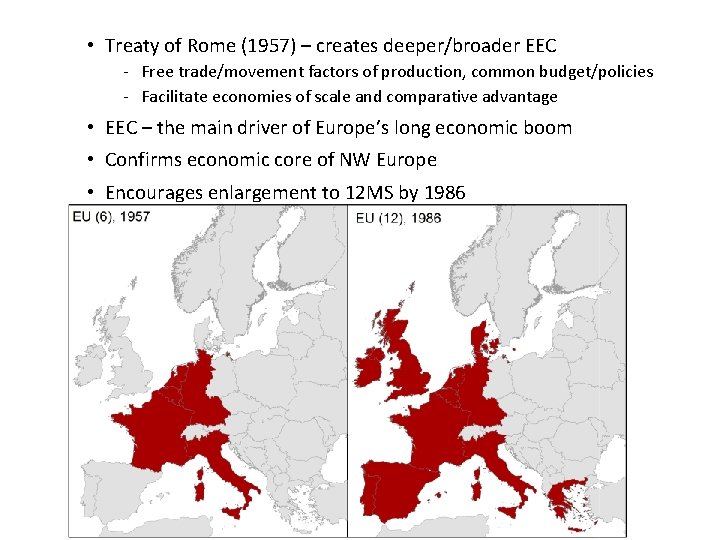
• Treaty of Rome (1957) – creates deeper/broader EEC - Free trade/movement factors of production, common budget/policies - Facilitate economies of scale and comparative advantage • EEC – the main driver of Europe’s long economic boom • Confirms economic core of NW Europe • Encourages enlargement to 12 MS by 1986
• Despite success – major challenges by mid-1980 s e. g. recession, nationalism, Euroschlerosis, globalisation • To address problems: – reconfirm primary economic principles • SEA (1987) and SEM (1993) - Centred on ‘four freedoms’ - Promotion of stronger/new policies (CRP, voting, euro) • Co-ordinated in TEU (Maastricht), 1993 • Comprehensive treaty embracing deeper/wider Union
• TEU – paves way for enlargement into CEE - via Copenhagen Criteria, 1993 • • 2004 ‘Big Bang’ (+10 NMS); 2013 EU (28) Larger EU but increased socio-economic gradients Increases dependency between core and new peripheries Aggravated by 2008 recession
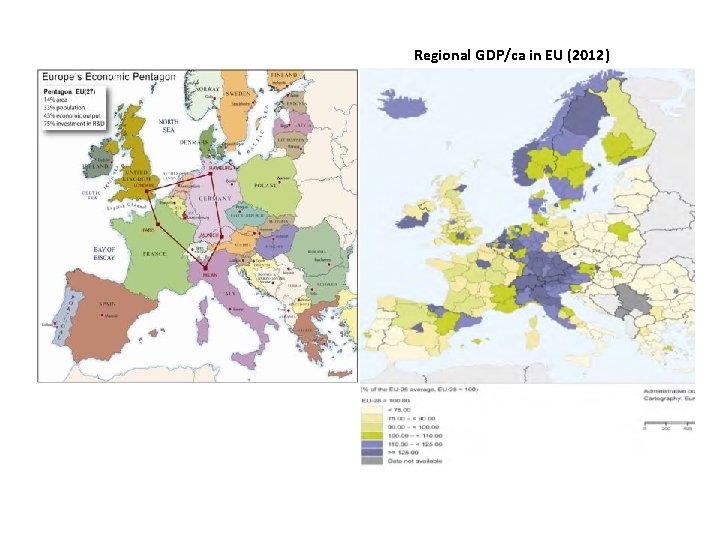
Regional GDP/ca in EU (2012)
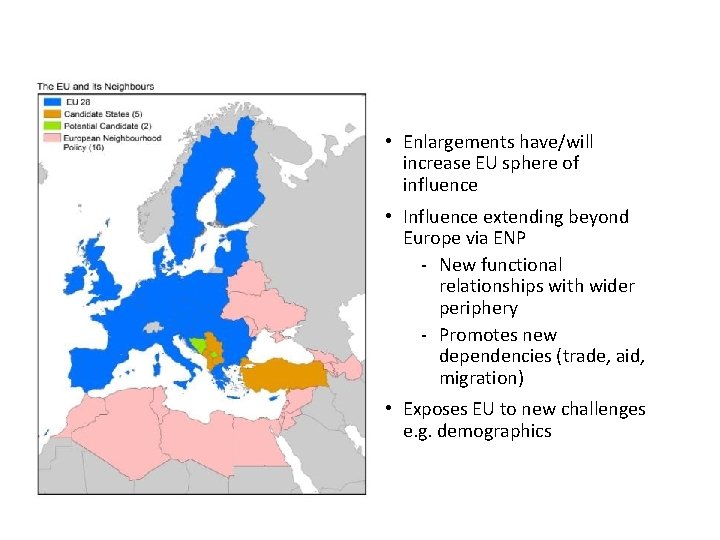
• Enlargements have/will increase EU sphere of influence • Influence extending beyond Europe via ENP - New functional relationships with wider periphery - Promotes new dependencies (trade, aid, migration) • Exposes EU to new challenges e. g. demographics
EU Demographics: A Crisis? • “Demography is one of the main driving forces of change in Europe” (Champion, 1998, p. 241) • EU: “bracing itself for profound changes in its population structures. ” (European Commission, 2007) • EU identified Demographic Change as one of four key challenges in Europe 2020
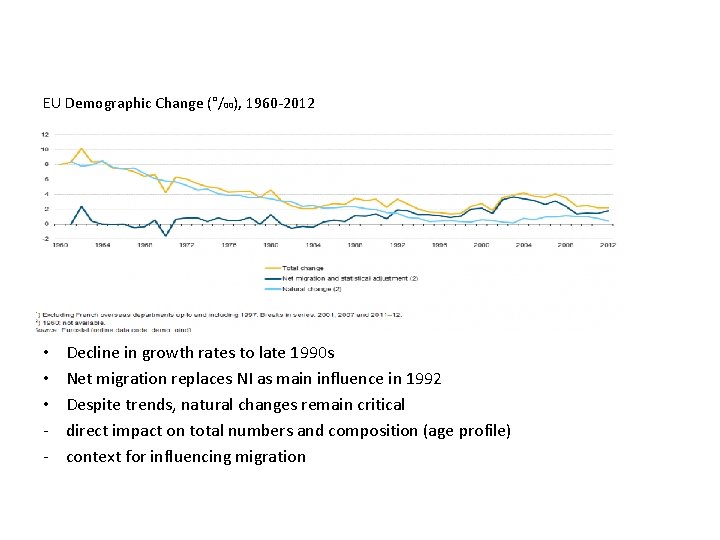
EU Demographic Change (°/00), 1960 -2012 • • • - Decline in growth rates to late 1990 s Net migration replaces NI as main influence in 1992 Despite trends, natural changes remain critical direct impact on total numbers and composition (age profile) context for influencing migration
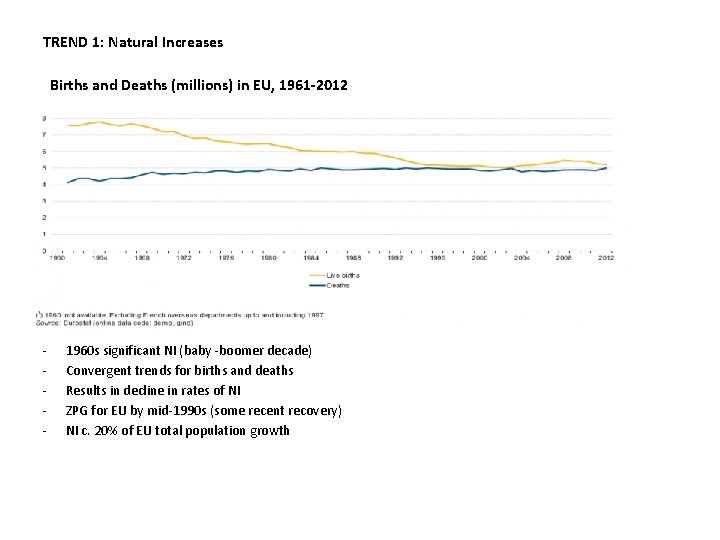
TREND 1: Natural Increases Births and Deaths (millions) in EU, 1961 -2012 - 1960 s significant NI (baby -boomer decade) Convergent trends for births and deaths Results in decline in rates of NI ZPG for EU by mid-1990 s (some recent recovery) NI c. 20% of EU total population growth
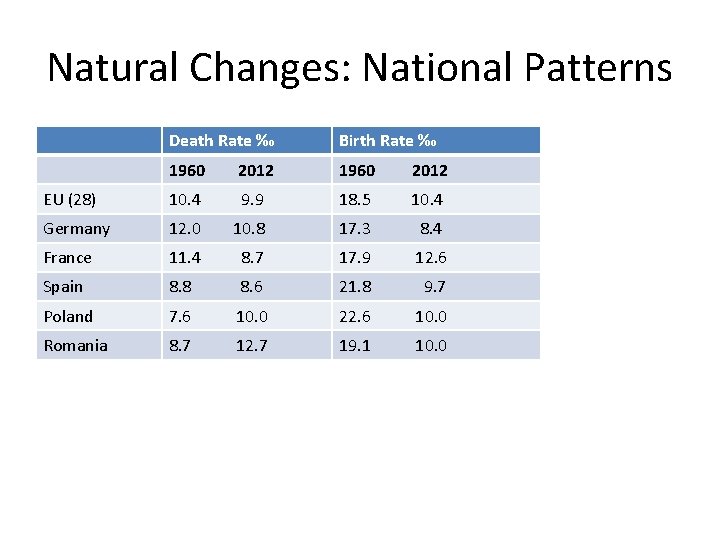
Natural Changes: National Patterns Death Rate ‰ Birth Rate ‰ 1960 2012 EU (28) 10. 4 9. 9 18. 5 10. 4 Germany 12. 0 10. 8 17. 3 8. 4 France 11. 4 8. 7 17. 9 12. 6 Spain 8. 8 8. 6 21. 8 9. 7 Poland 7. 6 10. 0 22. 6 10. 0 Romania 8. 7 12. 7 19. 1 10. 0
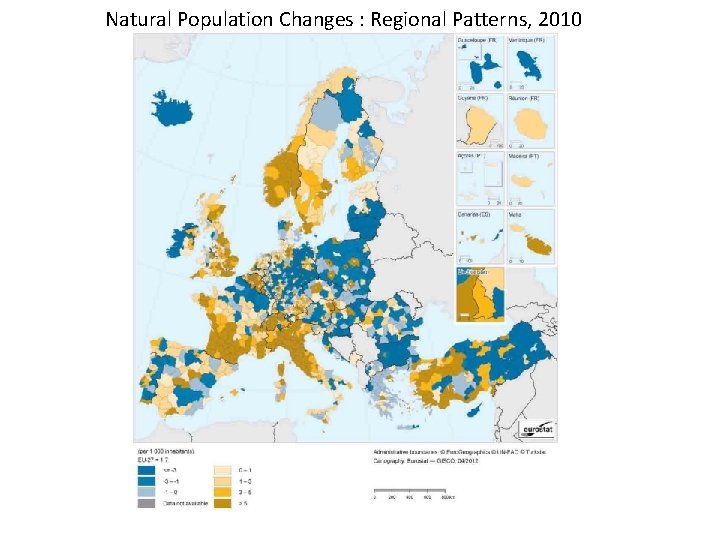
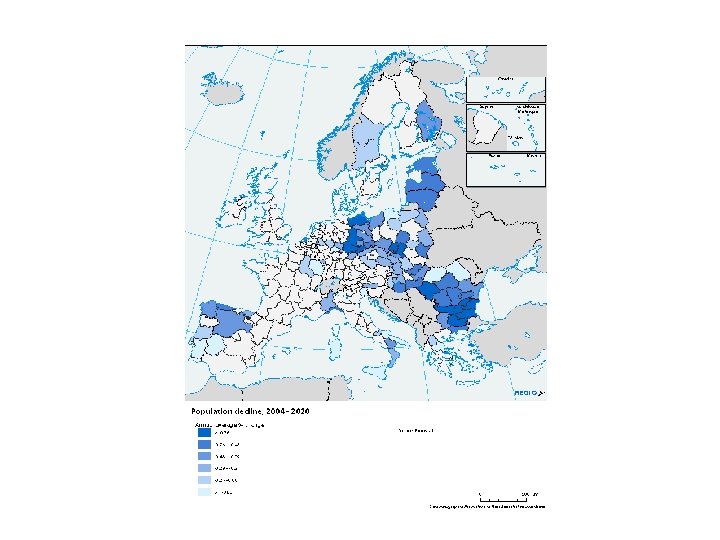
Natural Population Changes : Regional Patterns, 2010
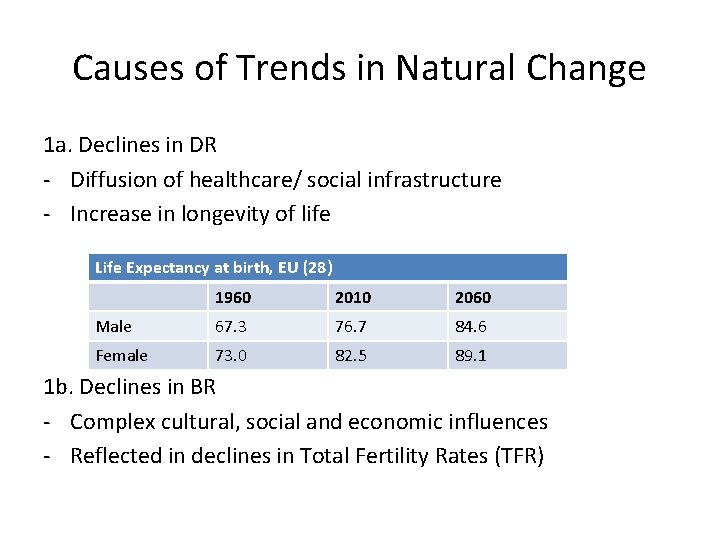
Causes of Trends in Natural Change 1 a. Declines in DR - Diffusion of healthcare/ social infrastructure - Increase in longevity of life Life Expectancy at birth, EU (28) 1960 2010 2060 Male 67. 3 76. 7 84. 6 Female 73. 0 82. 5 89. 1 1 b. Declines in BR - Complex cultural, social and economic influences - Reflected in declines in Total Fertility Rates (TFR)
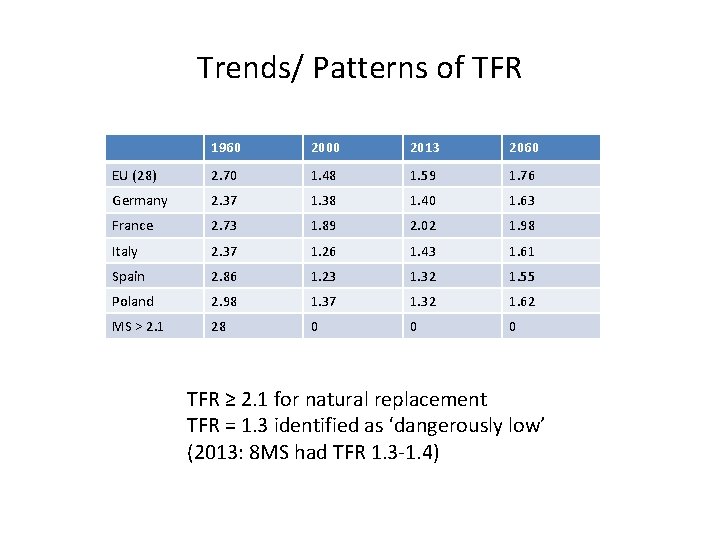
Trends/ Patterns of TFR 1960 2000 2013 2060 EU (28) 2. 70 1. 48 1. 59 1. 76 Germany 2. 37 1. 38 1. 40 1. 63 France 2. 73 1. 89 2. 02 1. 98 Italy 2. 37 1. 26 1. 43 1. 61 Spain 2. 86 1. 23 1. 32 1. 55 Poland 2. 98 1. 37 1. 32 1. 62 MS > 2. 1 28 0 0 0 TFR ≥ 2. 1 for natural replacement TFR = 1. 3 identified as ‘dangerously low’ (2013: 8 MS had TFR 1. 3 -1. 4)
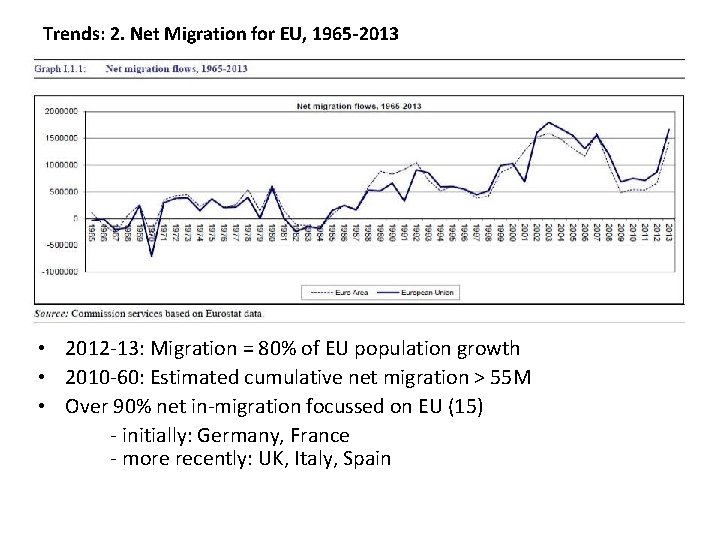
Trends: 2. Net Migration for EU, 1965 -2013 • 2012 -13: Migration = 80% of EU population growth • 2010 -60: Estimated cumulative net migration > 55 M • Over 90% net in-migration focussed on EU (15) - initially: Germany, France - more recently: UK, Italy, Spain
Causes of Change: Net Migration Within Europe • Freedom of movement within enlarging European Union • Schengen Agreement confirms a ‘borderless Europe’ (26 MS) • Collapse of USSR released large volume of migrants from CEE External to EU • Initially a liberal approach – “we need migrant workers. ” (pull) • Increase in severity/ frequency of wars, famines, disease in surrounding global regions (push) • Extension of EU spheres of influence e. g. ENP
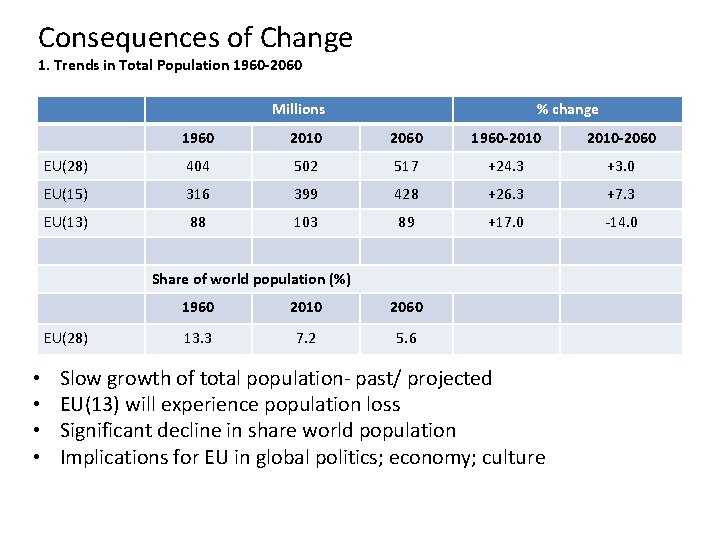
Consequences of Change 1. Trends in Total Population 1960 -2060 Millions % change 1960 2010 2060 1960 -2010 -2060 EU(28) 404 502 517 +24. 3 +3. 0 EU(15) 316 399 428 +26. 3 +7. 3 EU(13) 88 103 89 +17. 0 -14. 0 Share of world population (%) EU(28) • • 1960 2010 2060 13. 3 7. 2 5. 6 Slow growth of total population- past/ projected EU(13) will experience population loss Significant decline in share world population Implications for EU in global politics; economy; culture
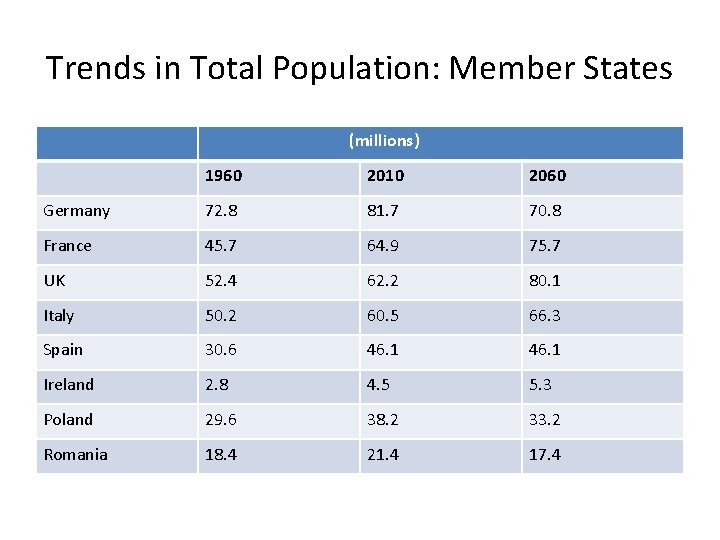
Trends in Total Population: Member States (millions) 1960 2010 2060 Germany 72. 8 81. 7 70. 8 France 45. 7 64. 9 75. 7 UK 52. 4 62. 2 80. 1 Italy 50. 2 60. 5 66. 3 Spain 30. 6 46. 1 Ireland 2. 8 4. 5 5. 3 Poland 29. 6 38. 2 33. 2 Romania 18. 4 21. 4 17. 4
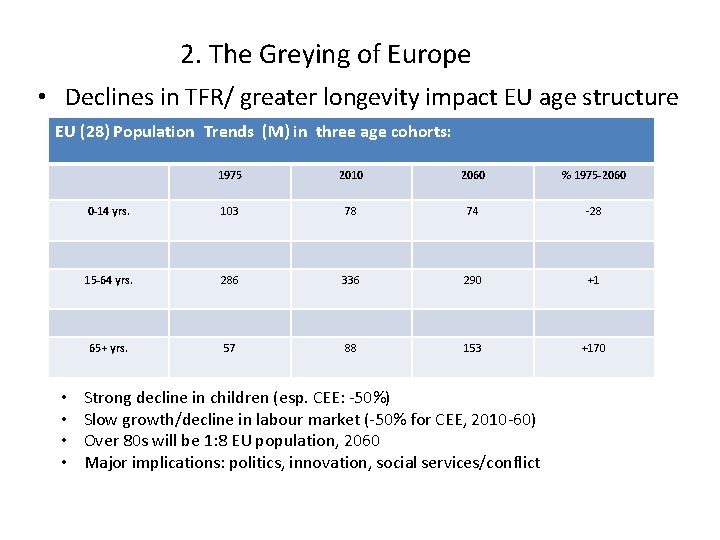
2. The Greying of Europe • Declines in TFR/ greater longevity impact EU age structure EU (28) Population Trends (M) in three age cohorts: • • 1975 2010 2060 % 1975 -2060 0 -14 yrs. 103 78 74 -28 15 -64 yrs. 286 336 290 +1 65+ yrs. 57 88 153 +170 Strong decline in children (esp. CEE: -50%) Slow growth/decline in labour market (-50% for CEE, 2010 -60) Over 80 s will be 1: 8 EU population, 2060 Major implications: politics, innovation, social services/conflict
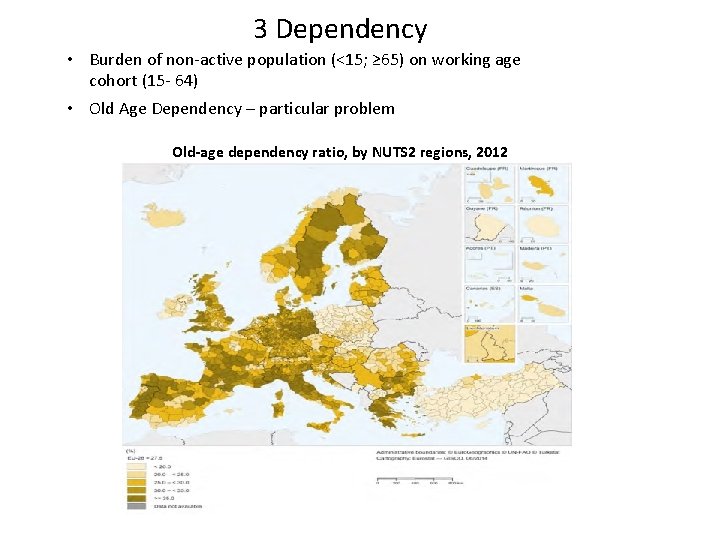
3 Dependency • Burden of non-active population (<15; ≥ 65) on working age cohort (15 - 64) • Old Age Dependency – particular problem Old-age dependency ratio, by NUTS 2 regions, 2012
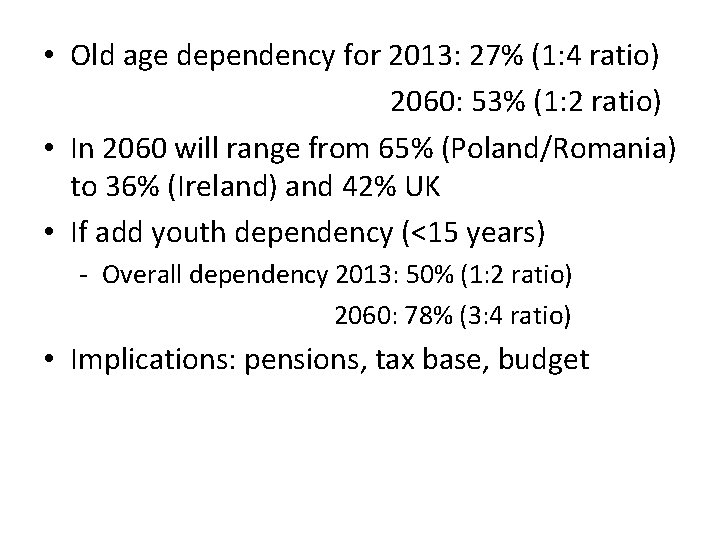
• Old age dependency for 2013: 27% (1: 4 ratio) 2060: 53% (1: 2 ratio) • In 2060 will range from 65% (Poland/Romania) to 36% (Ireland) and 42% UK • If add youth dependency (<15 years) - Overall dependency 2013: 50% (1: 2 ratio) 2060: 78% (3: 4 ratio) • Implications: pensions, tax base, budget
4. Changing Roles of Migration • Europe – from global emigrant nursery to host region • Reflected in changing scale, composition, geography, attitudes i) Scale Increasing numbers c. 80% EU pop. growth now due net migration c. 33 M migrants in EU (6. 5% total pop. ) 2012 -60 estimate +55 M migrants (10. 5% total pop. ) without migration: EU pop. would be much smaller
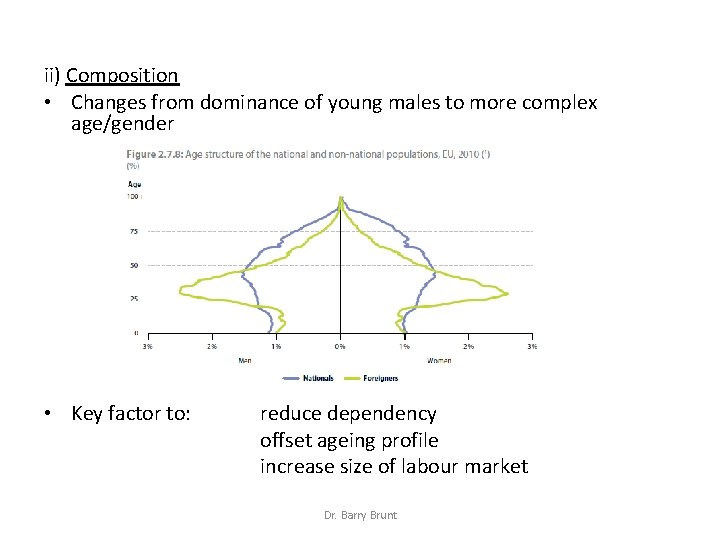
ii) Composition • Changes from dominance of young males to more complex age/gender • Key factor to: reduce dependency offset ageing profile increase size of labour market Dr. Barry Brunt
• Type of migrant also changes - from low-skilled workers to complex range • Skilled international migrants • Legal worker migrants – fill niche markets (1. 7 M, 2013) • Tighter restrictions (recession) on immigration - major growth in asylum seekers c. 9 M (1987 -2013); 0. 45 M (2013) - and illegals Dr. Barry Brunt
iii) Geography of Immigration • To 1980 s, dominant sources: Med. Europe and former colonies • Since 1990 – more complex geography of sources/hosts 1. New east to west flows - collapse of USSR - from new eastern periphery to NW core Dr. Barry Brunt
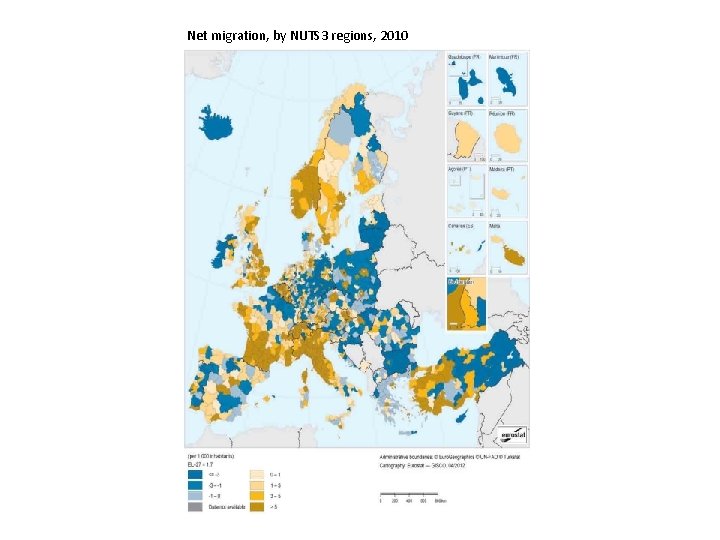
Net migration, by NUTS 3 regions, 2010
2. Redefining traditional south-north flows • Med. MS emerge as new host region - Low TFRs, buoyant economies pre 2008, lax controls (pull factors) - 1998 -2008: 60% EU immigration to Spain, Italy Greece Dr. Barry Brunt
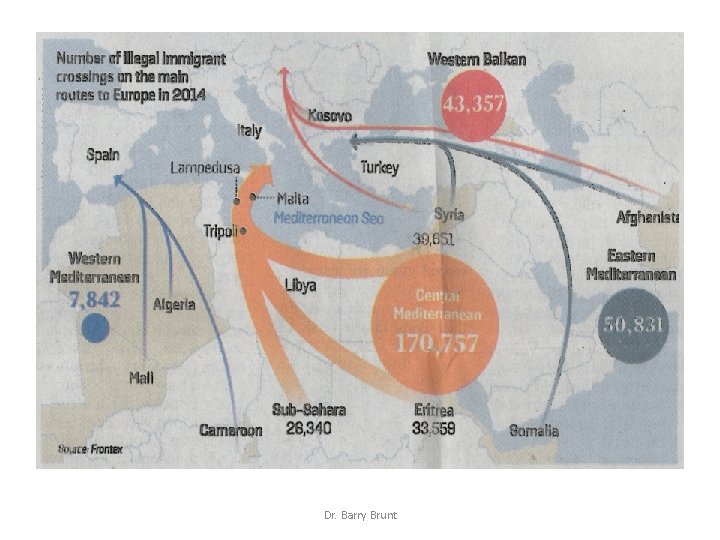
• Sources extend south/south-east of Med. Sea - ‘new’ periphery: N. Africa, SSA, Middle East (Balkans) - War, poverty, overpopulation, env. disasters (push factors) • World’s strongest economic/demographic gradient lies across Med. Sea - Europe’s ‘Rio-Grande’ Dr. Barry Brunt
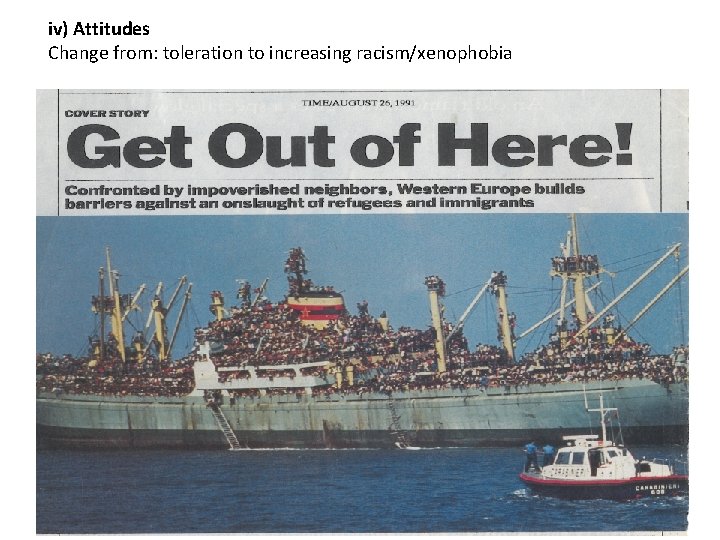
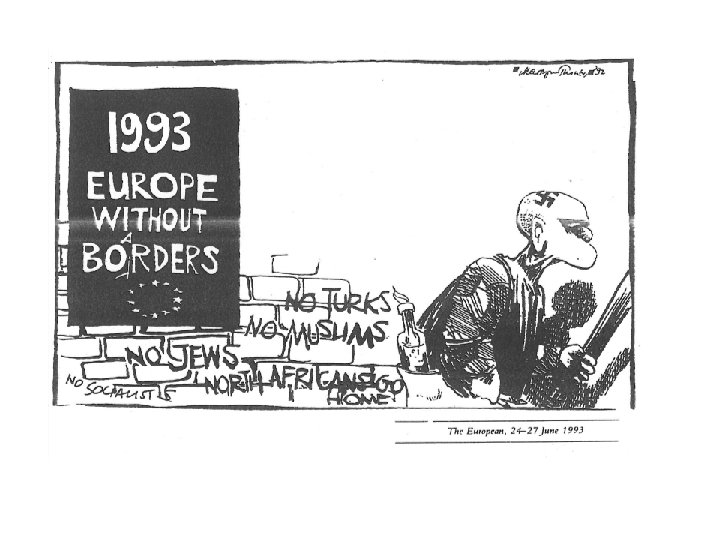
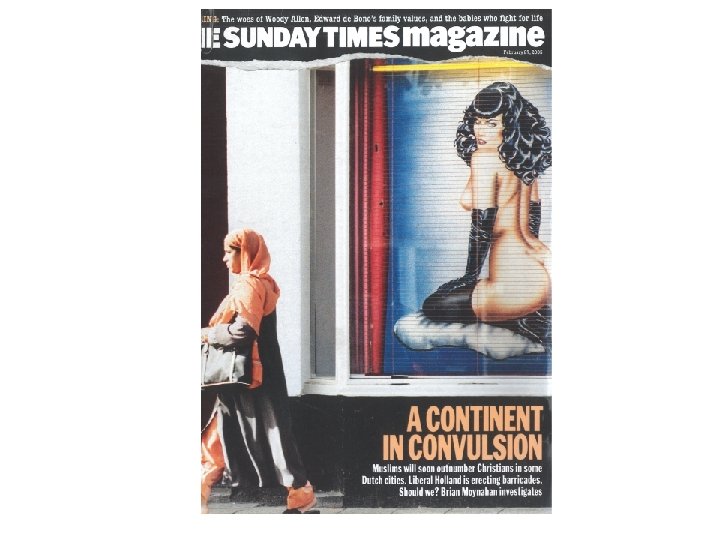
iv) Attitudes Change from: toleration to increasing racism/xenophobia
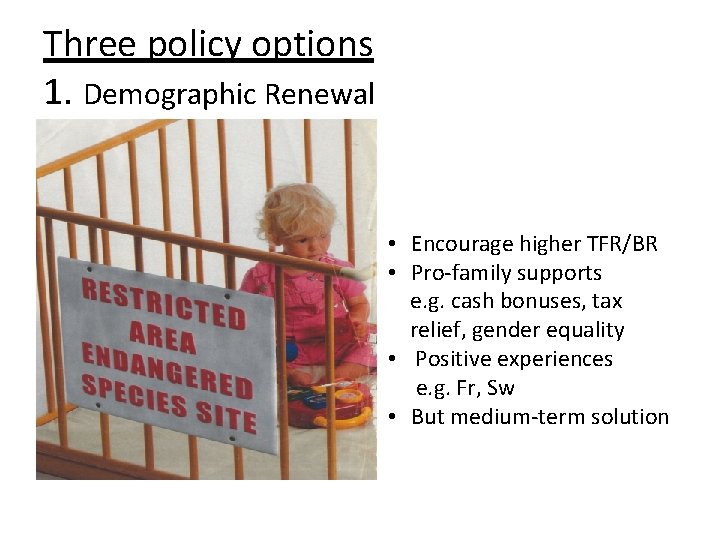
Three policy options 1. Demographic Renewal • Encourage higher TFR/BR • Pro-family supports e. g. cash bonuses, tax relief, gender equality • Positive experiences e. g. Fr, Sw • But medium-term solution
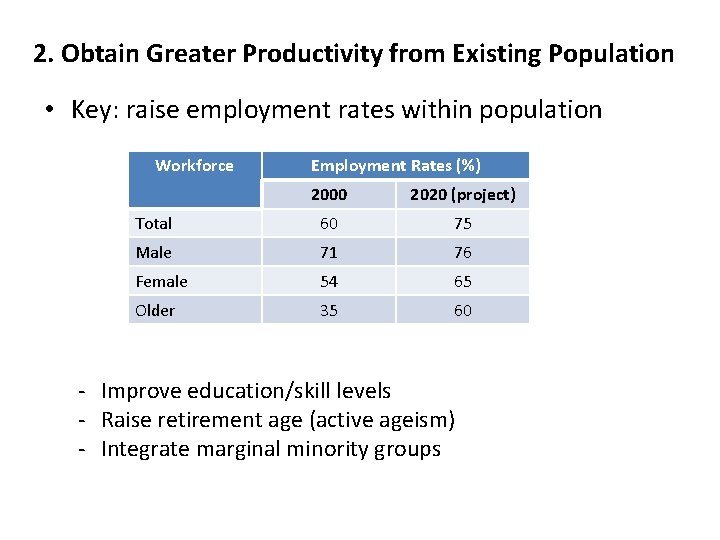
2. Obtain Greater Productivity from Existing Population • Key: raise employment rates within population Workforce Employment Rates (%) 2000 2020 (project) Total 60 75 Male 71 76 Female 54 65 Older 35 60 - Improve education/skill levels - Raise retirement age (active ageism) - Integrate marginal minority groups
3. Migration • Currently: the ‘big issue’ for EU • Reconcile if migration is a solution or problem • EU policy makers see immigration as a benefit e. g. 70% of increased workforce (2002 -12) due to immigrants (flexible, enterprising) • Advocate targeting not ‘open door’ - young, skilled immigrants - more effective integration

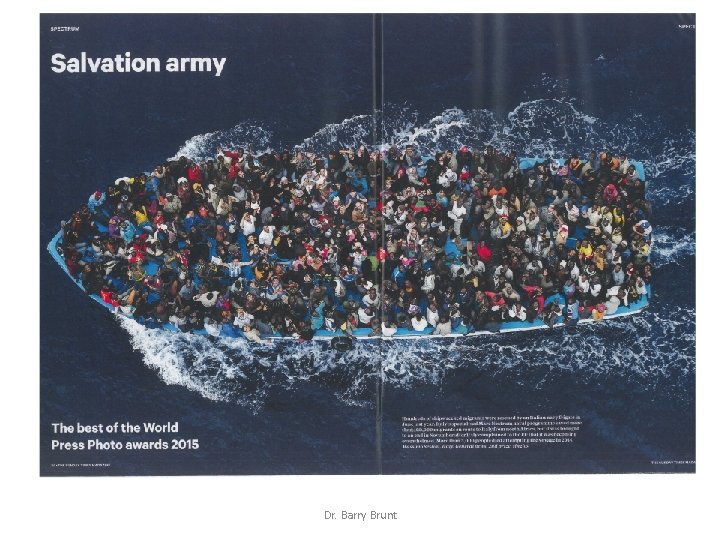
• Recession (2008) emphasised need for stronger policy • Frontex (2004) EU body to co-ordinate border controls • Difficult task - 8, 000 km land border - 80, 000 sea border 28 MS with different attitudes • Problems highlighted by surge of illegals crossing Med. Sea Dr. Barry Brunt
Dr. Barry Brunt
Dr. Barry Brunt
• Italy: ‘a new frontline state’ - Shortest sea route from Libya (Lampedusa c. 190 miles) • Traffickers’ objective: reach international waters - To be rescued by Italian Navy (Mare Nostrum) • Dublin Convention (1997) - Country in which asylum seeker first arrives has responsibility to process Dr. Barry Brunt
• 2015: EU strengthens Operation Triton - Response to increased traffic and drownings - Jan-Apr 2015 c. 2, 000 drownings (2014: 3200; 2000 -date > 25, 000) • € 130 M for patrol/search and rescue - But MS generally refuse to accept quotas of landed illegals e. g. UK • Considering – military action against traffickers - improved aid to source countries • Difficult to resolve: complex geographies and functional relationships of EU Dr. Barry Brunt
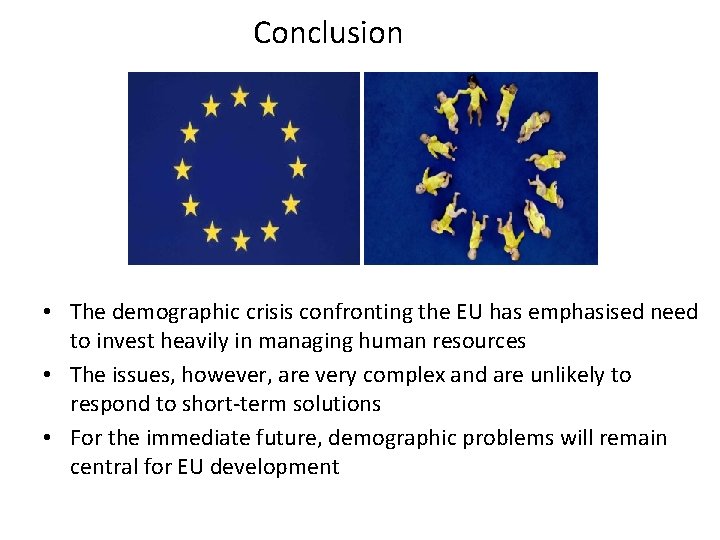
Conclusion • The demographic crisis confronting the EU has emphasised need to invest heavily in managing human resources • The issues, however, are very complex and are unlikely to respond to short-term solutions • For the immediate future, demographic problems will remain central for EU development
- Slides: 44