The Epidemiology of Injury and Science of Injury


 Overdoses in WV, 2001 -2015, (with Recent")


 • • An estimated 1. 7 million people sustain a")
 of all")


- Slides: 33
The Epidemiology of Injury and Science of Injury Prevention Robert M. Bossarte, Ph. D Director, Injury Control Research Center Associate Professor, Behavioral Medicine and Psychiatry
Injury Control Research Center • One of ten academic centers of excellence funded by the Centers for Disease Control and Prevention. • ICRC’s mission includes research, education and outreach. • Driven by a community-partnered model emphasizing translation of findings from sponsored research projects and successful implementation of evidence-based programs.
Objectives • • Definitions Burden of Injury in the U. S. Suicide Opioid Overdose Intimate Partner Violence Falls Traumatic Brain Injury Motor Vehicle Crash Supported by Grant Number: 1 R 49 CE 002109 from the Centers for Disease Control and Prevention, National Center for Injury Prevention and Control, to the West Virginia University Injury Control Research Center. The contents are solely the responsibility of the authors and do not necessarily represent the official views of the Centers for Disease Control and Prevention.
Core Epidemiologic Functions
Injury • We define injury as, “acts resulting from external factors resulting in morbidity or mortality”. • Traditionally, WVU’s Injury Control Research Center has focused on seven different forms of injury: suicide, overdose/poisoning, intimate partner violence, falls, occupational injury, motor vehicle accidents and traumatic brain injury. • Transition to a focus on drug abuse/overdose prevention, suicide and childhood abuse/neglect.
Leading Causes of Death in the U. S.
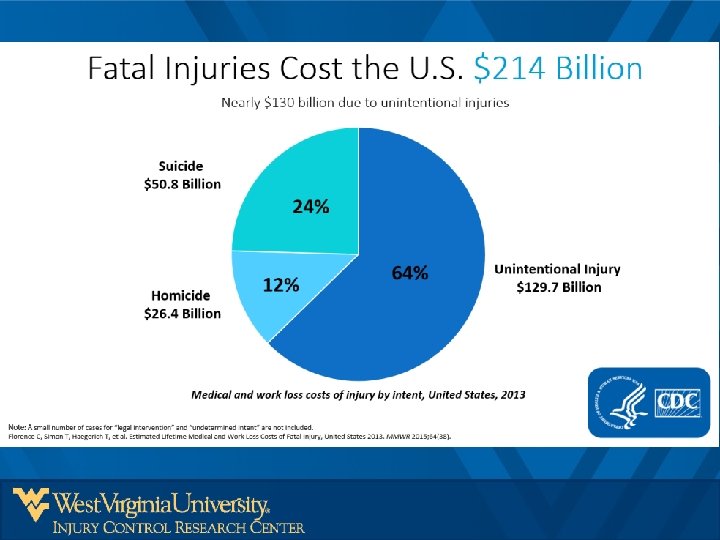
Unintentional Injury
Violence-Related
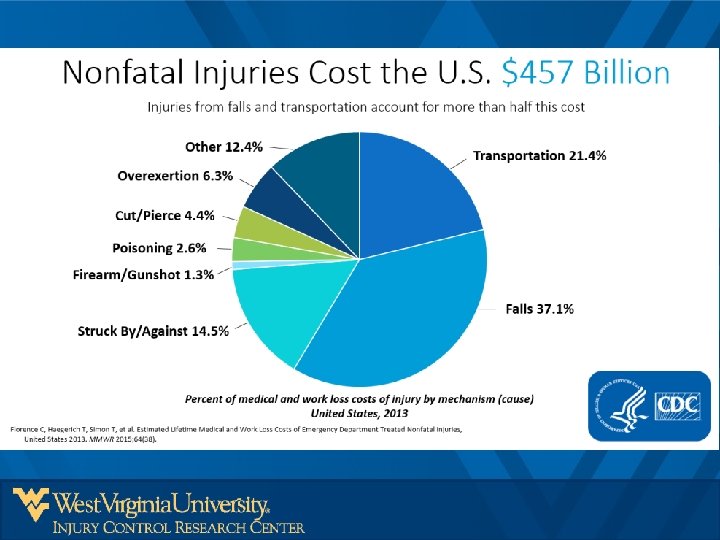
Non-Fatal Injury
Injuries Cost the US $671 billion in 2013 – pie chart showing over two-thirds of injury costs were due to nonfatal injuries
Suicide in the U. S. • Suicide is the tenth leading cause of death for all ages in the United States. • There were 44, 965 suicides in 2016 in the United States—a rate of 13. 42 per 100, 000 is equal to 121 suicides each day or one every 12 minutes. • In West Virginia there were 362 suicides in 2016 – a rate of 19. 8 per 100, 000. • Estimates suggest $51 billion in combined medical and work cost losses associated with suicide. Source: Centers for Disease Control and Prevention.
Suicide by Mechanism, U. S. - 2016 0% 0% 1% 1% 0% 2% 2% Firearm Suffocation 16% Poisoning Fall Cut/pierce 50% Other Spec. , classifiable Drowning Fire/burn Transportation- Related Other Spec. , NEC 27% Unspecified Struck by or Against
Nonfatal Suicidal Thoughts and Behavior • Among adults aged ≥ 18 years in the United States during 2013: – An estimated 9. 3 million adults (3. 9% of the adult U. S. population) reported having suicidal thoughts in the past year. – The percentage of adults having serious thoughts about suicide was highest among adults aged 18 to 25 (7. 4%), followed by adults aged 26 to 49 (4. 0%), then by adults aged 50 or older (2. 7%). – An estimated 2. 7 million people (1. 1% ) made a plan about how they would attempt suicide in the past year. – The percentage of adults who made a suicide plan in the past year was higher among adults aged 18 to 25 (2. 5%) than among adults aged 26 to 49 (1. 35%) and those aged 50 or older (0. 6%). – An estimated 1. 3 million adults aged 18 or older (0. 6%) attempted suicide in the past year. Among these adults who attempted suicide, 1. 1 million also reported making suicide plans (0. 2 million did not make suicide plans). Source: Substance Abuse and Mental Health Services Administration, Results from the 2013 National Survey on Drug Use and Health: Mental Health Findings, NSDUH Series H-49, HHS Publication No. (SMA) 14 -4887. Rockville, MD: Substance Abuse and Mental Health Services, 2014.
Overdose/Poisoning • The United States is in the midst of a drug overdose epidemic. More people died from drug overdoses in 2014 than in any other year on record. Deaths from drug overdose are up among both men and women, all races, and adults of nearly all ages. • More than three out of five drug overdose deaths involve an opioid. • Overdose deaths from opioids, including prescription opioids and heroin, have nearly quadrupled since 1999. • Overdoses involving opioids killed more than 28, 000 people in 2014. Over half of those deaths were from prescription opioids. Source: Centers for Disease Control and Prevention.
Overdose in the U. S. , 2000 -2014
Unintentional Drug-Related Poisoning Death Rates in the US, 2014 10. 7 7. 3 14. 8 5. 0 7. 6 9. 4 12. 4 5. 7 13. 8 15. 4 15. 0 5. 3 11. 0 8. 9 9. 2 14. 1 19. 6 6. 9 15. 1 12. 3 16. 9 24. 3 13. 7 14. 6 22. 8 32. 2 22. 6 15. 2 8. 9 9. 3 11. 3 17. 1 12. 5 10. 4 8. 0 9. 5 13. 4 10. 2 14. 3 Source: CDC’s WISQARS Age-adjusted rate per 100, 000 population 2. 0 – 7. 7 11. 1 7. 7 NH - 22. 5 VT - 10. 1 MA - 17. 7 RI - 21. 5 CT - 15. 8 NJ - 13. 1 DE - 17. 3 MD - 3. 8 DC - 11. 7 7. 8 – 11. 0 11. 1 – 15. 0 15. 1 – 24. 3 > 24. 3
Overall Overdoses, Opiate-related Overdoses, and Opiate-related (Non-Heroin) Overdoses in WV, 2001 -2015, (with Recent Heroin (2012 -2015) and Fentanyl (2014 -2015) Involvement Surges Included) 800 686 700 656 568 600 521 474 500 286 188 147 181 100 214 2001 17 7 2002 535 558 472 399 496 405 393 390 361 358 383 405 339 298 264 157 46 36 548 464 209 138 9 0 274 243 212 200 312 498 587 431 369 367 300 479 412 406 400 490 576 628 54 39 5 10 14 11 2003 2004 2005 2006 Overdoses - All Substances All Opiate-Related** 60 57 22 2007 49 38 38 2009 Heroin-Related** 44 51 67 32 34 41 2010 2011 Fentanyl-Related 2012 40 2013 165 193 168 55 2014 2015 Opiate- (Non-Heroin) Related
Changes in Heroin Use, U. S.
Intimate Partner Violence • An estimated 31. 5% of adult women have been victims of intimate partner violence in their lifetimes and an estimated 4. 0% have been victims of intimate partner violence in the past 12 months. • An estimated 22. 3% of women experienced at least one act of severe physical violence by an intimate partner during their lifetimes. Source: Prevalence and Characteristics of Sexual Violence, Stalking, and Intimate Partner Violence Victimization — National Intimate Partner and Sexual Violence Survey, United States, 2011.
Age of First Victimization among Females by Age Group Source: Prevalence and Characteristics of Sexual Violence, Stalking, and Intimate Partner Violence Victimization — National Intimate Partner and Sexual Violence Survey, United States, 2011.
Age of First Victimization among Males by Age Group Source: Prevalence and Characteristics of Sexual Violence, Stalking, and Intimate Partner Violence Victimization — National Intimate Partner and Sexual Violence Survey, United States, 2011.
Falls • One out of five falls causes a serious injury such as broken bones or a head injury. • Each year, 2. 8 million older people are treated in emergency departments for fall injuries. • Over 800, 000 patients a year are hospitalized because of a fall injury, most often because of a head injury or hip fracture. • Each year at least 300, 000 older people are hospitalized for hip fractures. • More than 95% of hip fractures are caused by falling, usually by falling sideways. • Falls are the most common cause of traumatic brain injuries (TBI). • Falling once doubles your chances of another fall.
Increase in the Rate of Fall-Related Mortality Source: Centers for Disease Control and Prevention.
Fall-Related Mortality in West Virginia by Year -- 1999 - 2014 Source: Wonder Detailed Mortality Files
Fall-Related Mortality Among Older Adults in West Virginia by Year -- 1999 - 2014 Source: Wonder Detailed Mortality Files
Motor Vehicle Crash • About 90 people die each day in the US from crashes— resulting in the highest death rate among comparison countries. • US crash deaths fell 31% compared to an average 56% in 19 other high—income countries from 2000 -2013. • Over 18, 000 lives could be saved each year if US crash deaths equaled the average rate of 19 other high—income countries Source: Centers for Disease Control and Prevention.
Crash Statistics • There were more than 37, 000 crash deaths in the US in 2015. These deaths cost more than $380 million in direct medical costs. • Major risk factors for crash deaths in the US: – Not using seat belts, car seats, and booster seats contributed to over 9, 500 crash deaths. – Drunk driving contributed to more than 10, 000 crash deaths. • Speeding contributed to nearly one-third of all crash deaths. Source: Centers for Disease Control and Prevention.
Traumatic Brain Injury (TBI) • • An estimated 1. 7 million people sustain a TBI annually. • Of them: – 52, 000 die. – 275, 000 are hospitalized. – 1. 365 million, nearly 80%, are treated and released from an emergency department. Source: Centers for Disease Control and Prevention.
TBI • TBI is a contributing factor to a third (30. 5%) of all injury-related deaths in the United States. • About 75% of TBIs that occur each year are concussions or other forms of mild traumatic brain injury (MTBI). • Direct medical costs and indirect costs of TBI, such as lost productivity, totaled an estimated $60 billion in the United States in 2000. • In every age group, TBI rates are higher for males than for females. • Males aged 0 to 4 years have the highest rates of TBIrelated emergency department visits, hospitalizations, and deaths combined Source: Centers for Disease Control and Prevention.
Existing Research Efforts • WVU’s ICRC supports research across the spectrum of injury-related outcomes. Larger initiatives include: – Overdose prevention through naloxone distribution and collaboration on harm-reduction programs. – Identifying predictors of marital violence - in collaboration with the Word Mental Health Survey Initiative. – Prediction of suicide risk – in collaboration with the Department of Veterans Affairs and Uniform Services University of Health Sciences. – Fall prevention among older adults. – Characteristics and prediction of opioid overdose – in collaboration with the Department of Veterans Affairs. – Development and implementation of community toolkits to support stigma reduction associated with opioid misuse.
Contact Information 304 -293 -6682 rbossarte@hsc. wvu. edu