The Energy Integration in Southern Africa JeanPierre Favennec


 – January 1996 – July 2010 150 $/b 140 130")
 Reference Scenario Natural carbone sequestration 50")


 Coal Natural gas Oil Source : BP")


")

 § Decentralised electricity not adressed § Importance")

 § Euratom (European Atomic Energy Community) q Success : ü ü ü")
 § European Coal and Steel Community q Success : ü Long term")


- Slides: 27
The Energy Integration in Southern Africa Jean-Pierre Favennec IFP Professor – Consultant Johannesburg – December 2, 2010
Summary § Energy in the world § Energy in Africa § Energy in Southern Africa
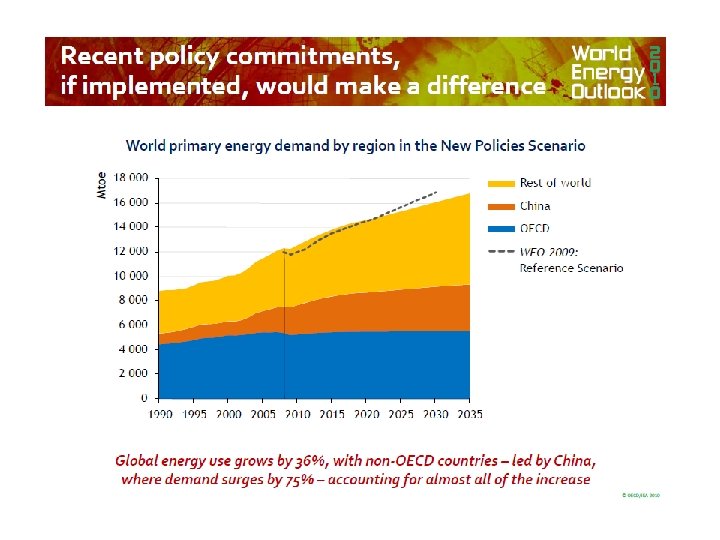
Energy in the World Recent changes : - Reduction of CO 2 emissions - Limitations of oil production - New gas situation - Coal - Renewables
Dated Brent price ($/b) – January 1996 – July 2010 150 $/b 140 130 Weekly averages 120 Annual averages 110 100 97. 6 90 80 65. 1 70 72. 5 60 50 54. 5 40 30 20. 7 10 28. 8 28. 4 19. 1 20 0 61. 1 17. 7 24. 5 38. 1 24. 9 12. 7 96 97 Source : Platt’s S 404*17 – July 2010 98 99 00 01 02 03 04 05 06 07 08 09 10
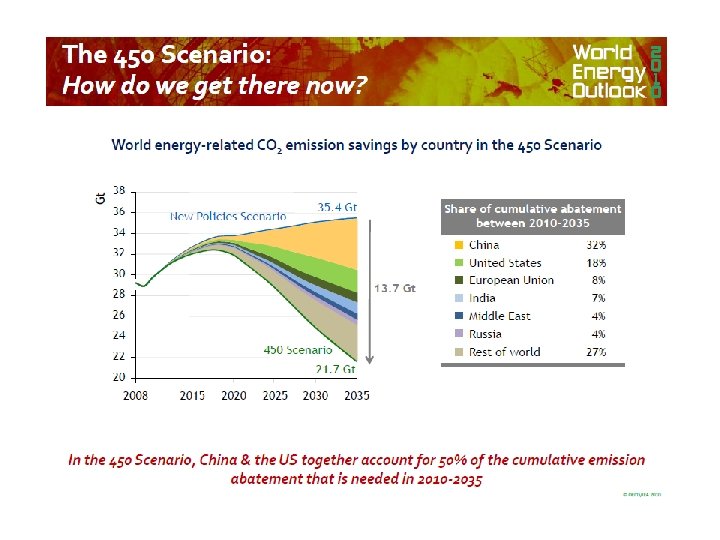
CO 2 emissions 60 Emissions (Gt CO 2) Reference Scenario Natural carbone sequestration 50 Captured carbon Fuel switch 40 Wind, Solar, nuclear Biofuels 30 Energy efficiency 20 Scenario with reduction of emissions 10 0 1970 1990 Source : Commission Européenne 2010 2030 2050 2070 2090
Energy in Africa
World electricity generation 2006 § World total = 18 921 TWh North America 1658 3531 CIS 5134 Europe 682 World electricity production by source (TWh) Coal 7756 Natural Gas 3807 Nuclear 2792 Hydro 3035 Oil 1096 Renewable 435 Source : AIE EL 101*1 – April 2009 588 959 Middle East 1786 2904 Asia OECD China Africa 1679 South and central America Asia non OECD
Energy consumption in Africa Mtoe Electricity (primary) Coal Natural gas Oil Source : BP Statistical Review AF 004 – October 2009
The energy divides § Divide between Africa and the rest of the world (15% of world population for 3% of world energy consumption) § Divide between North Africa-South Africa and the rest of Africa § Divide between urban and rural areas: Urban areas look like energy spots North and South Africa: two specific areas 41% 12% 7% 3% 37% Region energy consumption proportion Energy barriers
Hydroelectricity in Africa Potential
Energy Integration in Southern Africa Existing situation Needs in electricity The Integrated Resource Plan What about renewables? Integration : benefits and existing pools
Southern Africa’s power Industry and Interconnections § An existing electrical integration mostly between Mozambique and South Africa W Wind Power T Thermal Power Plant H Hydro Power Plant N Nuclear Power Plant H W T TT Main power transmission line Remarque : 1 circle = 3 power plants at least except nuclear power plant for which 1 circle = 1 power plant NT Source : African Energy H T TT H
Southern African Power Pool § South Africa represents 81% of SAPP in 2010 and will remain at 77% of SAPP in 2025
The Integrated Resource Plan : Context and Description § Obligation after National Energy Act of 2008 § Long term electricity capacity plan to develop a sustainable electricity investment strategy for generation capacity and transmission infrastructure for South Africa over the next 25 years. q q Demand-side management (DSM) Pricing Capacity provided by all generators (Eskom and independant power producers) Environment
The Integrated Resource Plan : Hypothesis § GDP growth on average 4, 6 % per year over the next 20 years q q It requires from 30 439 MW to 52 724 MW of new capacity depending on scenarios for 454 357 GWh produced in 2030. It assumes at least 3420 MW of demand side management programmes
5 models studied to establish the balanced revised scenario § § A base case which minimise directs costs 3 emissions limits based scenarios q q q § EM 1. 0 : imposes an annual emission limit of 275 MT EM 2. 0 : imposes an emission limit of 275 MT of carbon dioxide by 2025 but allows emissions to go to higher levels prior to 2025 EM 3. 0 : imposes a tighter emission limit of 220 MT of carbon dioxide from 2020 A Carbon Tax based scenario (CT 0. 0) : imposes carbon taxes escalated to 2010 Rands an contained in the LTMS documents Sources : DOE § 2 others model were studied : a regional developement model and an enhanced DSM model
The Integrated Resource Plan Low Cost Scenario Balanced Scenario Low Carbon Scenario Funding (BUS$) 78 85 (+10%) 125 (+60%) Carbon emissions (MT) 380 275 (-30%) 220 (-40%) 3 scenarios Generation mix by 2030 Capacity development (MW)
The Integrated Resource Plan : Challenges § A huge amount of renewables capacity q q q Wind : 4 500 MW in the Balanced scenario up to 2019 Solar : 400 MW Wind + Solar : 7 200 MW between 2019 and 2030 § Questions raised : q q Is it possible to build such capacities : resources, technical problems Problem of cost and economic rentability? Ability for quick construction and maintenance? Problem of grid stability?
The Integrated Resource Plan : Challenges (2) § Decentralised electricity not adressed § Importance of transmission lines
Integration benefits § Benefits : foster the development of the economy. § Keys actions : q Develop infrastructures § Most important partners : q q q Mozambique. There is already an important hydro production (Caora Bassa) and new capacities will be built. Mozambique is also supplying natural gas to RSA (Sasol) Zambia (hydro potential) Zimbabwe § Limited cooperation : q q RDC. RSA is interested in electricity of Inga. But the Chinese presence (exchange of raw materials against investments) makes difficult this cooperation. Angola § Key issue : transmission
Euratom (1957) § Euratom (European Atomic Energy Community) q Success : ü ü ü q Legal framework, safety standard uniformisation Progressive enlargement of the cooperation Broad development on innovative technology Decrease in energy dependance Efficient information centralisation about nuclear stocks and flows, and investment Fight against nuclear proliferation Lacks : Some legislative contents (about normalisation for example) ü Decision process ü
ECSC (1951) § European Coal and Steel Community q Success : ü Long term vision and comon process • • ü Autonomous legal framework • q Peace, stability, prosperity, solidarity Efficient response during crisis Uniform social protection and labour law Lacks : Emergence of great enterprises ü Difficulty for struggling on price non-accordance and for assuring transparancy ü No equalization in salary ü
Benefits of integration § In West Africa cost of kwh supposed to be reduced by 50 % if good interconnections between the different countries of WAPP (West African Power Pool)
Thank you for your attention!