The effect of Land Use Cover Change model


- Slides: 30

The effect of Land Use Cover Change model resolution on scale of aggregation AAG Meeting _ March 2006 Amélie Davis & Dr. Bryan Pijanowski

Outline ► Agricultural expansion scenarios for East African countries based on Land Transformation Model (LTM) results and UN Population estimates ► Urbanization scenarios based on Multi- Criteria Evaluation (MCE) and UN Population estimates ► Scaling issues and aggregation errors AAG MEETING Chicago, Illinois March 8, 2006

LTM for Agricultural Expansion • Land use change forecast model using neural networks • Forecast Agricultural expansion based on future UN population estimates • Drivers: _ _ _ AAG MEETING Chicago, Illinois March 8, 2006

Diagram of Steps Figure out which drivers to include Figure out the number or urban cells per country Include Urban expansion (use different method) Mask out water bodies, parks and agriculture Calculate ratio people per Ag Cells in landscape Use ratio to extrapolate pop urban to 2050 by 5 year increments Project Agricultural use using LTM neural network outputs AAG MEETING Chicago, Illinois Run LTM on East Africa to forecast agricultural expansion pick best PCM March 8, 2006

Agriculture Forecast: 2005 (left) 2030 (right) AAG MEETING Chicago, Illinois March 8, 2006

Results for East Africa • 2005 to 2030 in 5 year increments • Notice that Uganda “runs out” of agricultural space by 2020 AAG MEETING Chicago, Illinois March 8, 2006

Urbanization Simulation Use Multi-Criterion Evaluation • Based on 1983 book by Voogd & 1991 paper by Carver et al. • Also part of IDRISI software • Similar to LTM in the use of drivers • Uses expert judgment to weigh input drivers • Simplementation in GIS AAG MEETING Chicago, Illinois March 8, 2006

6 drivers for Urbanization Distance to urban Focal sum of urban close Distance to roads a roads b AAG MEETING Chicago, Illinois Focal sum of urban far roads c March 8, 2006

Steps for MCE • Standardization of drivers from zero to one with larger number being more likely to urbanize. Ex: dist to road: max - # / min-max • Pair wise comparison of each driver to establish their weights. Ex: distance to urban is extremely more important when compared to distance to roads Based on ‘expert’ judgment AAG MEETING Chicago, Illinois March 8, 2006

Weighing of Drivers • Approximate weight calculation • Implement them in raster calculator Ex: multiply your drivers by their weights. Make sure you exclude the cells which cannot urbanize (already urban, parks, lakes, ocean) Problem city boundaries are too smooth. Resemble edges of focal sum drivers Multiply those 2 drivers by a random map AAG MEETING Chicago, Illinois March 8, 2006

2005 2001 2030 AAG MEETING Chicago, Illinois March 8, 2006 2050

East Africa Urbanization • MCE map • Red/orange = greatest likelihood of urbanization • Problems with Ethiopia and Mozambique not enough information in drivers AAG MEETING Chicago, Illinois March 8, 2006

Urban in 2000 AAG MEETING Chicago, Illinois March 8, 2006

Urban Forecast for 2005 AAG MEETING Chicago, Illinois March 8, 2006

Urban Forecast for 2010 AAG MEETING Chicago, Illinois March 8, 2006

Urban Forecast for 2015 AAG MEETING Chicago, Illinois March 8, 2006

Urban Forecast for 2020 AAG MEETING Chicago, Illinois March 8, 2006

Urban Forecast for 2025 AAG MEETING Chicago, Illinois March 8, 2006

Urban Forecast for 2030 AAG MEETING Chicago, Illinois March 8, 2006

Urban Forecast for 2035 AAG MEETING Chicago, Illinois March 8, 2006

Urban Forecast for 2040 AAG MEETING Chicago, Illinois March 8, 2006

Urban Forecast for 2045 AAG MEETING Chicago, Illinois March 8, 2006

Urban Forecast for 2050 AAG MEETING Chicago, Illinois March 8, 2006

Same MCE but for Nairobi at 1 km spatial resolution AAG MEETING Chicago, Illinois March 8, 2006

1 km MCE Results 2005 2025 • Original urban in red • Urbanization in green AAG MEETING Chicago, Illinois 2050 March 8, 2006

Modeling Implications • Visually maximum ‘smooth’ transitioning of urbanization at 1 km seems to be 5 years • Patterns of urbanization with same method but different spatial resolution are different Which model do you use? Should weights be reevaluated for different spatial resolutions? 1 km resolution AAG MEETING Chicago, Illinois 90 m resolution resampled at March 8, 2006 1 km

Scaling Issues • Different Patterns • Different information passed on to climate model AAG MEETING Chicago, Illinois March 8, 2006

Conclusions and Next Steps • Merge Urbanization with Agricultural expansion maps • Study the interaction of different fractional covers of urban at varying spatial resolutions of the LULCC change map with disparate spatial resolution climate grid which scale will be best suited to couple both models? • How will shape and patterns within the landscape influence this coupling? AAG MEETING Chicago, Illinois March 8, 2006

AAG MEETING Chicago, Illinois March 8, 2006

AAG MEETING Chicago, Illinois March 8, 2006
 Change of land use hmda
 Hirschburg test
 Cover uncover test vs alternating cover test
 Krimsky and modified krimsky test
 Bid-rent theory ap human geography
 Sinclair model of agriculture
 Von thunens model
 Hoyt model
 Urban land use model
 Location
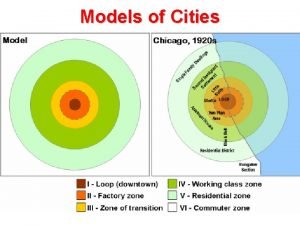
 Ernest burgess theory
 Six assumptions of von thunen model
 Lesson 1 urbanization
 Glcf data and products
 What are landforms
 Identifying landforms
 Effects of land pollution on human health
 How do destructive forces change the land's surface
 Cetacean
 Land use and growth management
 Land use planning '' lecture notes
 Usgs land use classification
 Types of land use
 Mixed land use ap human geography definition
 Irrevocable rights to some limited use of another's land
 What contribution did mexicans make to cattle ranching?
 Characteristics of land use in urban areas
 Land economics lecture notes
 Flood hazard area land use management guidelines
 Vdot entrance permit
 Land use planning '' lecture notes
