The Economics of Local Government With special reference


 • NSW regulations of council")

. Section 96 to read: –")
: – An assessment of")


 some useful financial recommendations, but: •")


- Slides: 40
The Economics of Local Government With special reference to recent reports by: The NSW Treasury Corporation and The Independent Local Government Review Panel Peter Abelson Applied Economics P/L Mayor, Mosman Council July 2013
Core issues 1. Are local councils efficient? i. e. Do local councils provide the services that their communities want at least cost? 2. Are local councils financially sustainable? Note: term “financial sustainability” needs definition Primarily an income / equity issue Sometimes an operational issue (incompetent governance) 1. What policies would make councils more efficient and financially sustainable?
Approach to presentation • An overview of major economic and governance issues • With more detailed discussion of: – NSW Treasury Corporation’s report (TCorp, 2013) “Financial Sustainability of the NSW Local Government Sector”. – The Independent Local Government Review Panel’s report (ILGRP, 2013) “Future Directions for NSW Local Government” with focus on recommendations for structural change, not on operational recommendations.
Systemic economic issues • Most services are non-market, unpriced services. This creates problems: – Free services create excess demands – Few metrics of consumer demand / benefits • Monopoly supplier – Customers cannot change their supplier – No clear measure of efficient costs of production – Size of supplier (jurisdiction) may not be optimal for efficiency (optimality could be larger or smaller) • Externality impacts – Exclusionary zoning raises housing costs locally and generally • Inadequate fiscal base of some local councils – Principally an income (equity) problem – And a population density problem.
Data problems • Inclusion of capital grants and expenditures in operating budgets. Not straightforward. – Ideally extract capital grants and capex (as per TCorp). – But if net operating balance > 0, net public worth increases even if operating revenue includes capital grant (council would not be going backwards). • Inconsistent valuations of – Assets – Depreciation (which greatly affects operating result) – Infrastructure backlogs.
Example: valuation and depreciation of roads • Greenfield v brownfield scenario – Brownfield base has more services under the road and has higher valuation based on replacement cost and higher depreciation • Useful live of roads: council assumptions vary from under 100 years to up to 300+ years.
Road asset depreciation: 2010 -11 Financial Accounts Council Annual dep’n $m $’ 000 per km 2 $ per capita Canada Bay 5. 2 266. 9 69. 9 Hurstville 4. 1 180. 1 51. 3 Lane Cove 2. 3 216. 8 70. 0 Marrickville 6. 1 367. 0 77. 4 Mosman 4. 8 557. 1 168. 5 Parramatta 11. 2 182. 0 66. 7 Randwick 8. 3 228. 0 62. 9 Warringah 3. 5 23. 3 24. 1 Waverley 7. 0 760. 3 102. 4
Stormwater assets • Data in accounts determined largely from sampling. • Traditionally pipes depreciated based on replacing whole asset inc. complete excavation, disposal & construction of new pipes. • Current practice in many areas is to reline pipes rather than replace. Relining significantly reduces cost. • In 2012/13 Mosman revised valuation on an extensive condition assessment, updated inventory and method. – Increased equity value of stormwater pipes by $33. 6 m and reduced depreciation by $310, 000 per annum.
Estimating infrastructure backlog • Estimated cost of achieving adequate infrastructure is developed in house. Methods arbitrary and vary by council. • Result is not audited. It is allocated to Special Schedule 7. This is not part of operating accounts or balance sheet. • Game playing – traditional incentive to overestimate backlog. • In 2010 -11 external contractor considered most of estimated Mosman roads were satisfactory but a backlog of $17. 3 m. • Now staff have refined data, consulted eminent 5 -person Community Asset Management Committee (inc. Max Walsh and Bob Leece) and estimated revised backlog of $3. 0 m, which was agreed by Council’s independent Audit Committee.
Policy context • NSW government rate pegging (with exceptions) • NSW regulations of council operations – Intensive regulations cover roles of councillors & officers, council meetings, codes of conduct etc. • Taskforce Review of the Local Government Act • Independent Local Government Review Panel (and Tcorp report) — Focus today • NSW Government (DOPI, 2013), “A New Planning System for NSW” • Australian Government proposed change to Constitution.
Local Government Act and council operations • 1993 Act: local councils based on the corporate model – An elected board and a chief executive officer responsible for operations. • Distinction between policy and operations. Is this valid? – – An expenditure review committee Designing surveys Merit assessments of development applications (meeting objectives) And doggy bags! • Elected councillors (not officers) are accountable to voters for quality of service provided by a monopoly supplier. There is need for co-operation not separation. • Taskforce Review of the Act has not addressed these governance issues or the heavy-handed regulations noted above.
Constitutional change • Financial recognition (not full democratic recognition). Section 96 to read: – “The Parliament may grant financial assistance to any State or to any local government body formed by a law of a state on such terms and conditions as Parliament sees fit. ” • Arguments for: – Current grants direct to local councils are, or may be, unconstitutional (High Court decision in Pape v Commissioner of Taxation) – Some councils need the financial support – Cuts out cost of state intermediation – Increases recognition of local government. • Arguments against: the change is not necessary because: – Direct grants have not yet been proved unconstitutional – Commonwealth can direct funds through the states at no cost of intermediation – Role of Commonwealth is further enlarged.
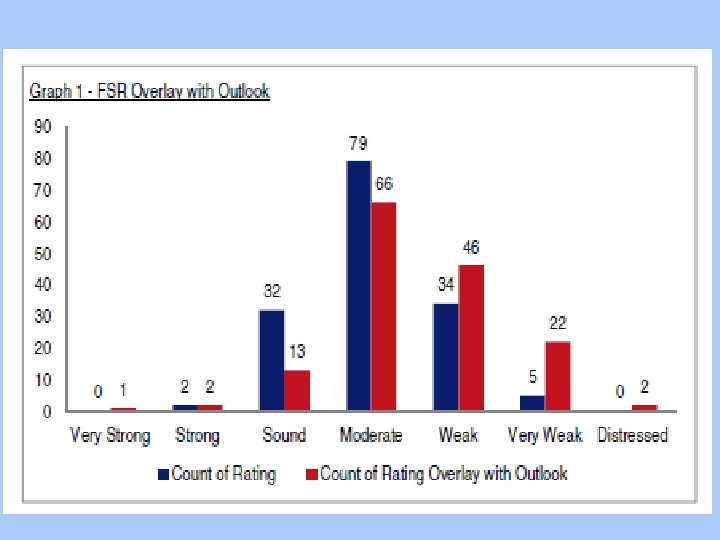
TCorp analysis of financial sustainability • Financial sustainability rating (FSR): – An assessment of Council’s “current long term rating” (sic!) is made on 7 point scale: Very Strong, sound, moderate, weak, very weak, distressed. – “A Moderate rating indicates that a Council has an adequate capacity to meet its financial obligations in the short to medium term (being the next five years)”. • FSR is based on recently observed (past) financial ratios (see below) • TCorp also provided an Outlook rating over the next 3 years (designated positive, neutral or negative) • Note confusion between short, medium and long term financial outlook. • Past financial ratios tell us little about long-run financial sustainability.
The real drivers of long-run sustainability • • • Another TCorp definition: “A local government will be financially sustainable over the long term when it is able to generate sufficient funds to provide the levels of service and infrastructure agreed with its community”. Yes, indeed. Fundamental drivers of viability: population density, household income and economic base. Productivity Commission (2008) Assessing Local Government Revenue Raising Capacity – “The fiscal capacity of a council is best measured as the aggregate after-tax income of the community. ” (Also may include value of business conducted locally). – NB: contrary to Commonwealth Grants Commission, economic capacity is NOT a function of the value of the taxation base. Of course, extreme financial incompetence can drive rich councils to bankruptcy. But these are exceptional cases. Councils are a monopoly with taxation powers. Tcorp: designated several densely populated, affluent councils with strong economic bases as moderate or weak FSR (not strong or sound) – Moderate: North Sydney, Woollahra, Waverly and Willoughby (!) – Weak: Mosman (!) Mosman had operating deficit of $2. 0 million per annum (with high depreciation and low interest payments on debt). – Deficit = $155 per household with median household income = $128, 000 – Not financially sustainable? ? ?
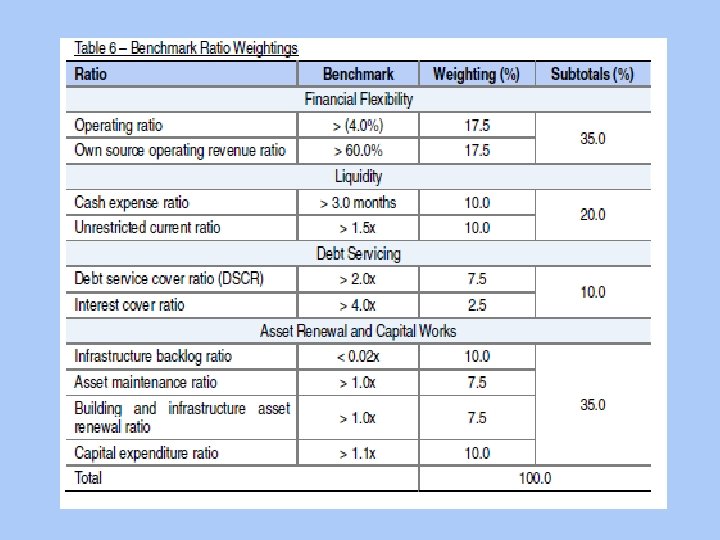
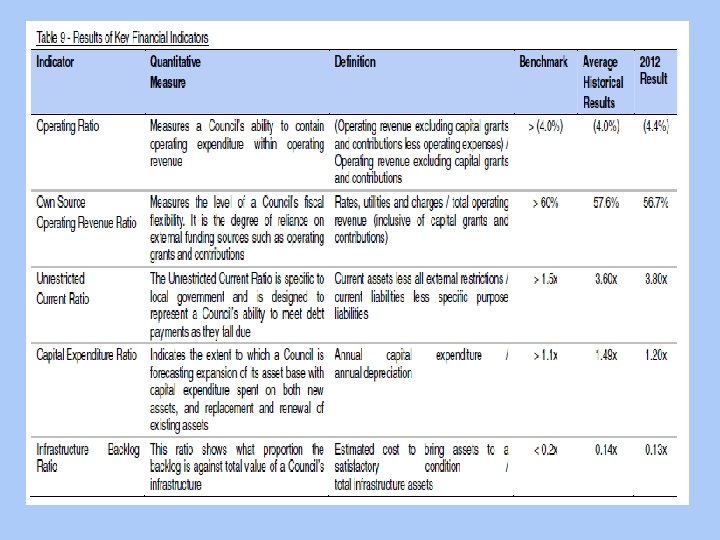
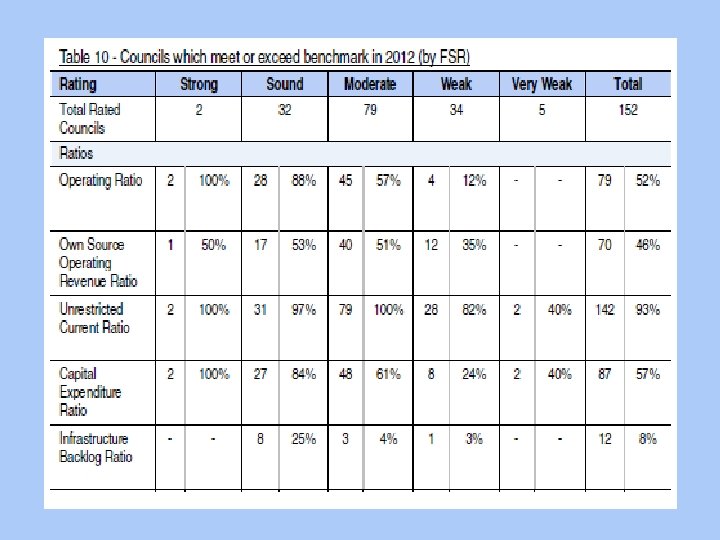
T-Corp financial ratios and financial sustainability • Next 5 slides show: – The 10 financial ratios used by TCorp, the benchmarks and the “weightings” – Definitions and results for 6 key indicators – TCorp FSR distribution – TCorp Outlook assessment – Combination of FSR and Outlook rating
Outlook method and outcomes
Issues with Tcorp FSR methodology • Method for deriving FSR conclusions is not stated or publicly available. • Based on information from TCorp, TCorp scored all 152 councils on the 10 ratios based on each of last four years and added the scores. • The scoring is not pass/fail based on the benchmarks and not nor linear (e. g. a high cash ratio does nor score any more than an adequate one). • The scoring system is not transparent (councils are not told how they scored on each item). It is not clear if ratings are purely mathematical or partly judgemental. • Importantly the mathematics of both the scoring system for each financial ratio and the weightings are arbitrary. – E. g. debt ratios have half weigh of liquidity ratios (why not double? ) and note that they are not included in Table 10.
More issues with Tcorp methodology • TCorp findings on FSR are based on past data (backward looking). • The data on depreciation and infrastructure backlog are poor, inconsistent and not audited. • TCorp Outlook results are based on TCorps’s “views” derived from looking at councils’ forward financial models over next 3 years. No explanations provided. • The overall FSR / Outlook finding is a composite finding also not explained. • TCorp (credit rating) measures do not predict a council’s long (or medium) term financial sustainability. This depends primarily on household income, the economic base, taxation power and population density. • For comparison, see methodology used by US firm, Capital Intelligence, Local Government Ratings based on: – Institutional and Legal Framework, Operating Environment (local economic conditions), Governance and Management, Budgetary Performance and Financial Flexibility, Debt Liquidity and Contingent Liabilities and Extraordinary Support.
Tcorp report: conclusions • Makes (pp. 8 -9) some useful financial recommendations, but: • To assess FSR, it relies on arbitrary scoring and weighting of financial ratios based on past and often poor data. • Meaning of financial sustainability is not clear. Findings may be interpreted as: if councils continue to run substantial operating deficits and to under-invest substantially in infrastructure, they will not be sustainable in the long run. But these critical hypothetical conditions are not spelled out. • No mention of rate pegging at least in Executive Summary. If operating deficits are so important, why has government adopted strict rate pegging with few exceptions for the last 30 years? • The report does not discuss the fundamental drivers of long term financial sustainability. It has limited value as predictor of real long term financial viability.
The ILGRP: introductory perspectives • Three person panel of administrators – no elected experience. • November 2012 report, Better, Stronger Local Government preamble – “Local Government must change. ” – We cannot make NSW Number One “without a local government system that is also Number One” – “Local government seems to have been stuck in a rut” • April 2013 report, Future Directions for NSW Local Government – TCorp review is the ONLY evidence cited in ILGRP’s Future Directions report. – “The TCorp analysis indicates that nearly half of all councils could be rated “weak”, “Very Weak” or “Distressed” in three years from now”. – The recently released TCorp report “paints a disturbing picture of a local government system facing major financial problems with apparently little awareness of just how serious the situation has become”.
ILGRP: proposed structural changes • In Sydney, reduce number of Councils from 42 to “around 15”, increasing average persons per council from 105, 000 to 300, 000 (and increasing) • Introduce option of local boards to service local communities in large urban areas • Create major new cities of 600, 000 to 800, 000 in Parramatta and Liverpool! • Establish a network of 20 new multi-purpose County Councils to undertake regional level functions outside Sydney • Encourage voluntary amalgamations of smaller rural councils • Establish incentives (bribes) for mergers • Appoint a Local Government Development Board for up to 4 years to drive a program of “reform”.
ILGRP: major regional reasons for proposed structural changes in Sydney 1. 2. ILGRP argues poor metro governance means there is a need: - for strategic planning capacity - to support implementation of the Metropolitan Strategy - for capacity to deliver major infrastructure and improvement projects - to underpin Sydney’s status as a global city - for an effective partner to State and Federal agencies It is difficult to deal with 42 councils 3. Need to develop major centres (Parramatta and Liverpool) 4. More equitable pattern of local government - Inequity: some councils are much larger than others - A need to overcome the large East-West divide.
ILGRP: major local reasons for proposed structural changes in Sydney General needs: • Capacity to cope with complex challenges (core issue) • To cope with new functions and projects • More knowledge, creativity and innovation • More credibility in dealing with state and federal governments. Economic needs • More robust resource base (not enough revenue for 152 councils) • To address financial issues / duplication of effort • To employ more skilled staff (not enough skilled staff for 152 councils)
Comments on regional efficiency issues 1. Claims are general, not specific. Operational implications are not clear. 2. Major regional issues are state responsibilities, not local council – Housing and transport are most cited regional issues – A second Sydney airport? – Will amalgamated councils resolve / advance these issues? 3. Proposed ILGPR amalgamations create large local areas, not regions. – DOPI planning sub-regions are quite different from ILGPR areas. 4. There alternative regional organisations and methods – Four large regional organisations of councils already exist – Many other levels and forms of inter-council cooperation also exist (e. g. waste disposal, libraries, road maintenance contracts) – Amalgamation of councils not needed to develop regional capacity.
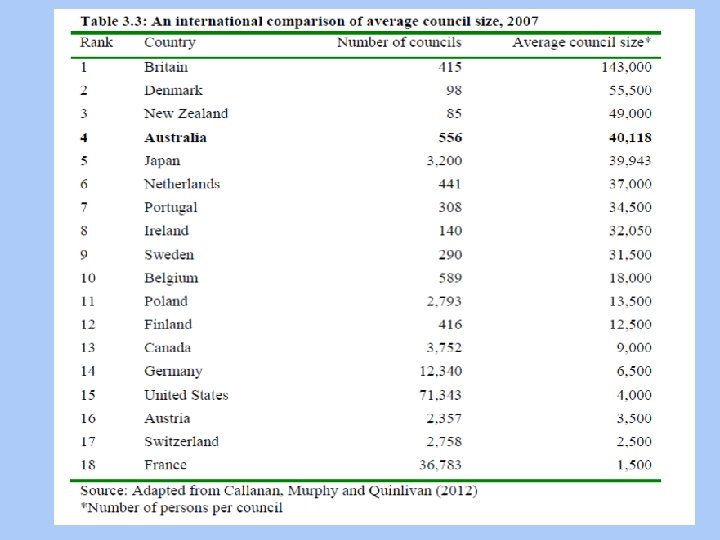
The size of local councils: Economic Principles • Cost analysis – Potential technical economics of scale or scope. – On the other hand many costs of larger organisations: • Behavioural diseconomies of scale • Greater public awareness of costs in small bureaucracies • More councils/suppliers, more innovation – Plus options • For regional and inter-council cooperation • Out-sourcing to private sector • Services – Communities should be able to choose level of public services they want – Decentralisation theorem: communities with different demographics and preferences should have differentiated services – Local Boards with no financial base will have no autonomy or power and be seen as useless fig leafs. • Conclusions from economic principles – Small areas are likely to provide preferred services at no increase in cost.
Amalgamation: Evidence on costs • ILGRP provides NO evidence on cost savings of amalgamation. And ignores the costs of effecting amalgamations. • Many studies have shown that amalgamations do not reduce costs – NSW Local Government (Allan) Inquiry, 2006, found no evidence in Australia or overseas that size of local councils bore any relationship to its unit costs – Australia: Dollery, Grant and Kortt (2012) Councils in Cooperation, Sydney Federation Press. Many factors affect costs especially low population density as distinct from low population. – United States: Martin and Schiff, 2011, ‘City Country consolidation: promise versus performance’, State and Local Government Review, – Canada, Reece: 2004, ‘Same Governance: Different Day. . . ’ Review of Policy Research – Europe: Dollery and Robotti, (eds) 2008, Theory and Practice of Local Government Reform, Edward Elgar. • Percy Allan (Urban Ideas, September 2012). No correlation between Fiscal Star ratings for financial sustainability and size of local councils. • Discount biased predator council claims (see below).
Amalgamation: evidence on services • Services are harder to measure than costs • Martin and Schiff (2011, ibid. ) little evidence of improved services in US consolidations • Abelson, 1982, “Some benefits of small local government areas”, Publius. Found interactions with elected representatives halve as population per elected representative doubles. • Recent Mosman survey: the number of volunteers per head of population is many times higher in small local council areas than in large one (between 2 and 10 times higher) • Referenda – four referenda in Mosman average over 80% of voters against amalgamation on basis of poorer services.
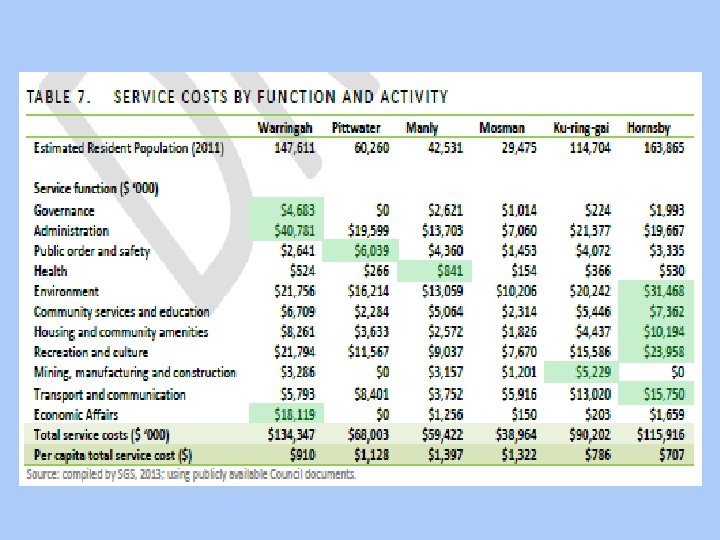
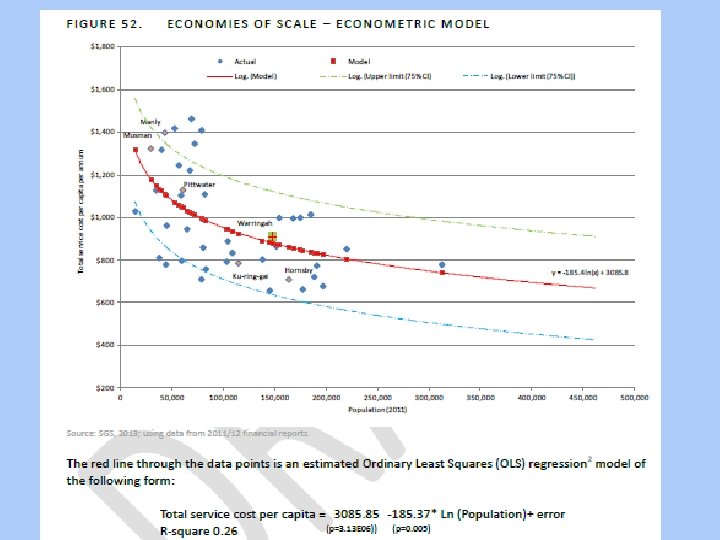
Example of misleading analysis • SGS Economics and Planning, June 2013, Local Government Structural Change – Options Analysis, Warringah Council. • Examines “cost” per capita in a small sample of councils, shows that “cost” per capita is lower in the larger ones and concludes that if councils were amalgamated into larger unit there would be substantial cost savings.
Issues with Warringah analysis • Costs here are total cost = expenditure. • Expenditure = Q × UC = quantity of services × unit costs • Total cost may vary with Q or UC. • Does Warringah: – – – run a regional art gallery - NO, run a free bus service around the municipality - NO, clean its major beaches twice a week throughout the year - NO, Sweep car parks twice a week – NO, provide meals twice a week at Council to 60 -70 senior citizens – NO • SGS analysis is flawed because it treats expenditure as unit cost rather than total cost and ignores large differences in service levels. (It is also based on dubious accounting data). • Similar comments apply to the SGS February 2013 report for Randwick.
Equity issues • ILGRP claims there is major inequality of service between large and small councils. Households in large councils have inferior services and this is unfair. • To remedy this inequality, small councils should be amalgamated! This is a very odd conclusion. • Amalgamating some small rural councils may make the whole area more financially sustainable and benefit both merged communities. • But, generally the core issue of inequality between councils reflects inequality of income, not lack of size. • Amalgamating two or more weak metropolitan councils achieves nothing. And this will do nothing to reduce the East-West divide. • Financially weaker councils need financial support, not generally amalgamation.
Dealing with the real issues: incremental reform • There is of course a need for improvements – Moving towards leaner contract-based councils with more competitive out-sourced services – Improved inter-council and regional co-operation with shared services – Improved data /accounting systems: improved / consistent definitions of asset values, backlog and depreciation – Improving council accountability to voters (not reducing it) – Public meetings on annual budgets – Rebalancing budgets from recurrent to capital expenditure – Better integration of elected councillors with officers on key operational matters (with checks and balances) – Reducing red tape regulations.
Conclusions on ILGRP • ILGRP review is full of rhetoric about the “challenges of change”. • Key concept, increased “strategic capacity”, is opaque. • Many regional recommendations are generic and lack detail. • ILGRP claims to be evidence based, but only evidence cited for “need for change” is TCorp report, which deals with short-term financial issues, not with long term sustainability. • ILGRP provides no evidence that amalgamations will produce better services or lower cost. • The actual evidence suggests the opposite poorer services at higher cost.
Final Comments • Is local government inefficient? Yes, often. • Is local government financially unsustainable? In some cases but not generally. • There is a need to identify and deal with the real issues. This has not been done. • At local council level, core problems are lack of markets and monopoly, not scale. I have provided several suggestions for dealing with these issues. • At regional level, better state government planning is needed along with consultations with regional groupings of councils. • • And some councils with low population and / or low income need support. • But don’t destroy local communities and local democracy. Amalgamating three or four small monopolies into one large monopoly reduces the quality of services but does not reduce costs or deal with the real problems of local government. In 1748, Montesquieu wrote: “In a small republic, the public good is more strongly felt, better known and closer to each citizen”. This is as true today in 2013 as it was in 1748.