The Economics of Commodity Money and Bitcoin Lawrence

 Lawrence H. White George Mason University")
The Economics of Commodity Money (and Bitcoin) Lawrence H. White George Mason University
: \"a gold standard means that the")
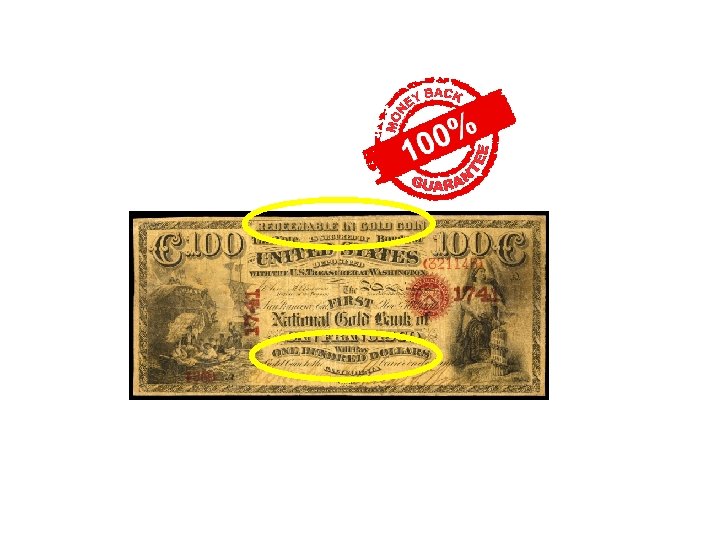
What is a “gold standard”? Anna Schwartz (1986): "a gold standard means that the central bank is prepared to buy and sell gold at a fixed price" • • • US before 1913? California 1860 -79? “fixed price”? • A more generic definition?

A “gold standard” generically means • Gold is the medium of account – If “$” is UOA, then $1 = R oz. Au • Gold is the medium of redemption • Contrast to fiat standard or cryptocurrency standard

Varieties of gold standards • What form for redemption medium? – gold coin standard – gold bullion standard – gold exchange standard • Who issues gold-redeemable money? – competing commercial banks – legislated monopoly issuer • Rules for reserve-holding? – discretionary, by contract – imposed ratio

Determining the price level, P If gold oz. is UOA: P = oz. Au / basket of goods If $ is UOA: P = $ / basket of goods P = ($R / oz. Au)(S oz. Au / basket of goods) where ($R / oz. Au) is inverse of the gold definition of $ (S oz. Au / basket of goods) is inverse of the purchasing power of gold (ppg), i. e. 1/ppg ►ppg determined by world supply and demand for gold

Stocks and flows stock: oz. flow: oz. per yr.

Gold stocks and flows, 2006 New mine production 2239 t / stock 158000 t = 1. 4% 1 tonne = 32, 151 troy oz. , so total stock 158, 000 tonnes = 5. 08 b oz. Value of est. 2010 world stock @ $1198. 7/oz. = $6. 74 trillion Source: World Gold Council http: //www. gold. org/assets/file/marketknowledge/Gold. Mkt. Knowledge. Supp. Dem. pdf

Gold stocks and flows, 2008 -12

2010 flows

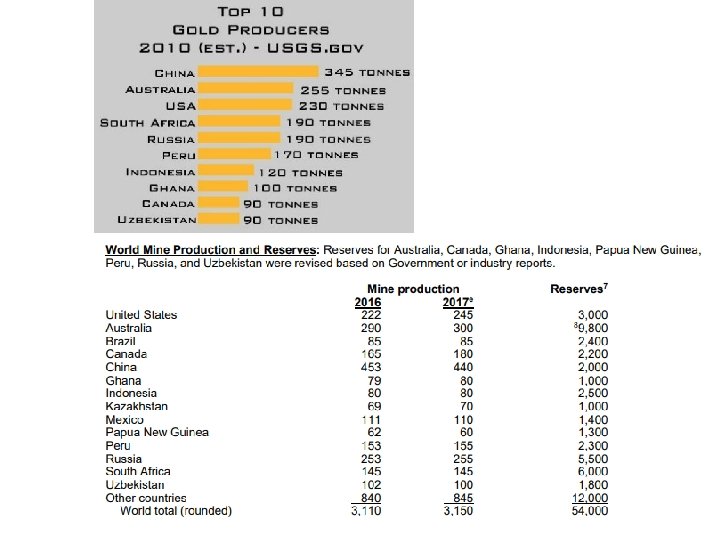
Gold mine production by top 5 countries, 1960 -2012

The track record of pre-WW 1 gold standards by contrast to post-WW 2 fiat standards • 1. lower mean inflation (and expected inflation) – lower deadweight costs from tax on money-holding • 2. lower price level uncertainty at medium to long horizons – lower yield premia and thicker markets for 20 - to 50 -year bonds • 3. lower resource costs of monetary gold mining (!) – More mining activity @ higher real price of gold since shutting gold window 1971 – Real price ↑ b/c demand ↑ for private hedging >> demand by central banks • 4. greater global trade with global currency area – lower cross-border transaction costs, lower devaluation risk • • 5. greater fiscal discipline 6. no worse on volatility of real output or unemployment

Lower inflation under gold standards • United States, slope shows inflation rate U S 3. 2% 0. 006% Source: Selgin, Lastrapes, White (2012)
 5.")
United Kingdom Composite Price Index, 1750 -2003 (Jan. 1974 = 100, logarithmic scale) 5. 4% -0. 005% UK off gold std. 1797 -1821, 1914 -24, 1931 - present Source: O’Donoghue, Goulding, and Allen (2004); shading added.
 Rolnick and Weber 1995 FRB Minn Commodity 1. 0 Fiat")
Average inflation rates hyperinflation) Rolnick and Weber 1995 FRB Minn Commodity 1. 0 Fiat (ex. 13 Note: Every country sampled had higher inflation under fiat money.

Lower price level uncertainty under gold std. US Price level uncertainty: 6 -year rolling std. deviation of the quarterly price level Conditional variance of price-level forecast errors from ARMA(1, 1)–GARCH(1, 1) model. Pre-Fed Post-WWII Source: Selgin, Lastrapes, White (2012)

LR-stable purchasing power under a gold standard is not accidental • Local prices of traded goods tied to world prices by arbitrage, PSFM • World monetary gold demand: grows slowly with real output – Historical annual growth avg. c. 3% • World monetary gold stock: grows slowly with mine output – Historical annual gold output avg. c. 3% of above-ground stock – not coincidentally – Net of absorption by industry, jewelry • Stabilizing dynamics: Market forces return the purchasing power of gold to its nearly flat trend after a shock to stock monetary supply or demand (illustrated below) • Shocks to flow supply or flow industrial demand can permanently alter ppg by altering MC of monetary gold – But swings in gold M growth rates historically were smaller than swings in fiat M growth rates

Gold flow supply and demand • As with any commodity – higher real price (ppg) brings greater quantity supplied • exploit sources with higher extraction / refining cost – higher real price (ppg) reduces flow quantity consumed • substitution into other metals for industrial use g. S ppg g. D oz. Au / yr. g gold flow supply and demand

Monetary gold stock supply and demand • Monetary gold demand is rectangular hyperbola • Additions to the world’s stock of monetary gold can come – immediately: from conversion of nonmonetary stocks • melt down gold candlesticks, bracelets • movement along stock supply curve Gs ppg GMS – over time: from gold mining GMD • shifts Gs curve right oz. Au world as a whole
 in stationary equilibrium – flow market and monetary")
Stock‑flow analytics • Start (and end) in stationary equilibrium – flow market and monetary stock market clearing at same ppg • assumes negligible cost of minting, melting – ppg and stock of gold both constant over time • none of the demand or supply curves shifting • later case: non-stationary equilibrium growth g. S GMS ppg GMD g. D flows g oz. Au / yr. Gm monetary stocks oz. Au

Stock‑flow analytics, cont. • Stationary equilibrium implies – Mints only replace wear-and-tear • If zero wear-and tear on monetary gold, mints must be idle -- as they usually were historically • Otherwise the stock of monetary gold would be increasing – New flow production equals “consumption” • If zero consumptive uses of gold, mines must be idle for stationary eq. • Otherwise mining shifts the monetary stock supply curve right • “Consumption” doesn’t destroy gold atoms, but fixes gold in uses (tooth fillings, circuit boards) with prohibitive cost of conversion to coins

Monetary gold stock SS & DD in the SR MARKET FOR MONEY BALANCES ppg (1/P) GMS GMD GM • • oz. Au Suppose upward demand shock (e. g. Germany adopts gold std. 1873) Gold stock supply non-vertical: as ppg rises, some jewelry, etc. , is melted and coined – World Gold Council: “Since 1995, recycled gold – that is primarily jewelry sold by consumers for cash – accounts for around a third of total supply, ” i. e. flow quantity supplied

Gold flows and monetary stock supply in the LR /1 GOLD MINING INDUSTRY MARKET FOR MONEY BALANCES ppg g. M g. S ppg g. D g. M • • • GMS GMD oz. Au / yr. GM oz. Au Rise in ppg increases mine output, reduces non-monetary uptake. Difference (g. M) flows into the mints Accumulation of coins pushes GMS to the right over time

Gold flows and monetary stock supply in the LR /2 GOLD MINING INDUSTRY MARKET FOR MONEY BALANCES ppg g. M g. S ppg GMS g. D Gm • • • GMD oz. Au / yr. Gm oz. Au g. M > 0 makes GMS shift rightward, until g. M → 0 at original ppg. “LR monetary gold stock supply curve” (connect the dots) ≈ flat SR ppg ↑ is reversed in LR by increased mine and mint output.

Results of shifts in monetary stock supply or demand curves • Flow and stock quantities of gold supplied respond to changes in the ppg – initial change in ppg is fully reversed in the LR (assuming no depletion effect on flow supply or wear-and-tear effect on flow demand) – price‑elastic supply of gold dampens changes in the ppg – Ultimately, a monetary stock demand shift is met entirely by an adjustment in quantity (mining accumulation) – Supply shift reversed by LR mining accumulation – ppg returns to its initial value, as determined by unchanged intersection of flow supply and demand curves • These results illustrate the price‑level‑stabilizing property of a gold standard – cited as a virtue by proponents

Depletion, wear-and-tear • Less than full reversal of Δppg if – Wear-and-tear (g. D rises with GM) – Gold mine depletion (current g. S shifts back with rise in accumulated oz. mined)
, Colorado (1890 s),")
SR vs. LR flow supply • Rockoff: South Africa (1874 -86), Colorado (1890 s), Yukon / Alaska (1890 s) due to prospecting, in turn due to high ppg, not exogenous supply shocks • cyanide process ditto • I. e. , these were movements along LR flow supply curve

How long to reach the long run? • Following stock demand for gold↑ and ppg↑ – prospecting, discovery of new gold fields, bringing of additional gold mines on line, accumulation enough new gold to restore normal ppg • How many years before ppg↑ reversed by the supply↑? – Historical deviations of ppg above trend lasted decades – Bordo: response of gold output to ppg↑ strongest at a lag of 25 years
: ppg will 50%")
The largest historical gold flow supply shock • • Chevalier (1859): ppg will 50% Jevons (1863): ppg did 9 -15% – based on wholesale prices • UK Retail Price Index series (1913 = 100) – RPI rose 26 percent 1849 -1867 (ppg 21%) – 1. 3 percent per annum – After which RPI slowly declined
 – “Trade")
Network benefits of a global currency • Lopez-Cordova and Meissner (AER 2003) – “Trade flows may have been nearly 30 percent larger when two countries adopted the gold standard. ” – “the rise of the classical gold standard accounts for perhaps 20 percent of the rise in global trade between 1880 and 1910. ” • Rodrick (FP 1997) – “By many measures, the world economy was more integrated at the height of the gold standard in the late l 9 th century than it is now. ”

Fiscal discipline An “automatic” gold currency … is extremely sensitive to government expenditure …. This is the reason why gold is so unpopular now and also why it was so popular in a bourgeois era. It imposes restrictions on governments or bureaucracies. • Borrowing in gold is limited to what can credibly be repaid by future budget surpluses. Loss of credibility dumping of a government’s bonds and currency notes. Joseph Schumpeter, History of Economic Analysis (1954)

Fiscal discipline Remember that under the gold standard, there was no law that restricted your debt-GDP ratio or deficit-GDP ratio. Feasibility and credit markets did the job. If a country wanted to be on the gold standard, it had to balance its budget in a present-value sense. --Thomas Sargent, 2010 interview Unlike the ECB, the gold standard offered no possibility of bailouts for over-indebted countries, so did not create moral hazard.

Benefits of a gold standard • To money-users? • To borrowers and lenders? • To taxpayers?

Resource cost

G = 2. 5% of Y

What Friedman estimates • equilibrium growth case with stable ppm • ΔGM / national income Y, where ΔGM is shown by 1 2 g. M gs GMS 1 ppg 2 gd g GMD oz. Au / yr. GM oz. Au
( M/M)(M/Y) – M/Y")
Plugging values into Friedman’s formula • G/Y = ( G/ M)( M/M)(M/Y) – M/Y = M 2/NNP =. 625 (based on 1959, still holds up) – M/M from M/M + V/V = P/P + y/y, • • P/P = 0 (flat path of ppg), V/V = -1%/yr result: implied M/M = 4%/yr. y/y = 3%/yr. (still holds up) – G/ M = 1 (!)
( M/M)(M/Y). 025 =")
Plugging values into Friedman’s formula • G/Y = ( G/ M)( M/M)(M/Y). 025 = (1) (. 04) (. 625) – M/Y = M 2/NNP =. 625 (based on 1959, still holds up) – M/M from M/M + V/V = P/P + y/y, • • P/P = 0 (flat path of ppg), V/V = -1%/yr result: implied M/M = 4%/yr. y/y = 3%/yr. (still holds up) – G/ M = 1 (!)

Rationale for G/ M = 1, and critique • Banks assumed to hold 100% reserves of gold – not only against demand liabilities, but even against time deposits! • to estimate the resource costs of a "pure" gold system – all forms of money (and even all time deposits) are literally gold or warehouse receipts for gold • critique: – makes no sense for time deposits – ahistorical for demand deposits – results in vast overestimate of resource costs, compared to a reasonable historical gold reserve ratio

Friedman’s approach with a reasonable reserve ratio • Plug in 2% where Friedman plugged in 100% • Reduces estimated resource cost of a gold standard to one‑fiftieth of Friedman's figure: ( G/Y) = ( G/ M)( M/M)(M/Y) = (. 02)(. 04)(. 625) =. 0005

Gold resource costs in practice • • Not eliminated just by switching to a fiat money regime Investors must trust fiat money enough not to acquire more gold (as an inflation or crisis hedge) than central banks sell – CBs sold only a small fraction of gold 19712008; net buyers since 2008 – Total CB + private hoards have grown as a share of gold stocks • Today ppg is higher than it was in gold standard era – – Nominal parity $35 / oz. Au in 1935 CPI has risen 18 -fold, $35*18 = $630 Actual gold price $1318 (15 March 2018) Not a backward shift in supply: annual output has grown

Real price of gold, 1861 -2009
 resource cost? • Est.")
Are the benefits of a gold standard worth the (revised) resource cost? • Est. resource cost less than just the est. deadweight loss from 7% higher fiat inflation rate – Rolnick and Weber -0. 5% vs. 6. 5% inflation – Conversely: fiat standard not worth it, even at zero resource cost, if inflation > 4%/yr. – Similar calculation applies to official dollarization inflation 6. 5 -0. 5 gain in “consumer surplus” from reducing inflation R$ Md

Output volatility: gold std. vs. Fed Output Volatility (Romer real GDP, std. dev. from trend) 10, 000 9, 000 8, 000 7, 000 6, 000 5, 000 4, 000 3, 000 2, 000 1, 000 0, 000 1869 -1914 1915 -2009 1915 -1946 1947 -2009

Unemployment: gold std. vs. Fed US Unemployment rate, 1869 -2009 %
")
Fiat money hasn’t raised real growth Source: Robert E. Lucas, Jr. (2011)

Private irredeemable money in theory Hayek imagined that private issuers would – promise stable purchasing power – deliver it by artfully managing own M stocks 1978

Private irredeemable money in practice: cryptocurrencies • Not ppm guarantees, but quantity guarantees – Issued at a known pre-programmed rate – Volatile purchasing power – Contrast fiat, gold • Mostly “non-profit” governance – Exceptions: Ripple, Dash • Is it really currency? Several are media of exchange – but not yet money (= commonly accepted MOE) – “Cryptoassets” more accurate

What gives a redeemable private currency value? The demandable debt model

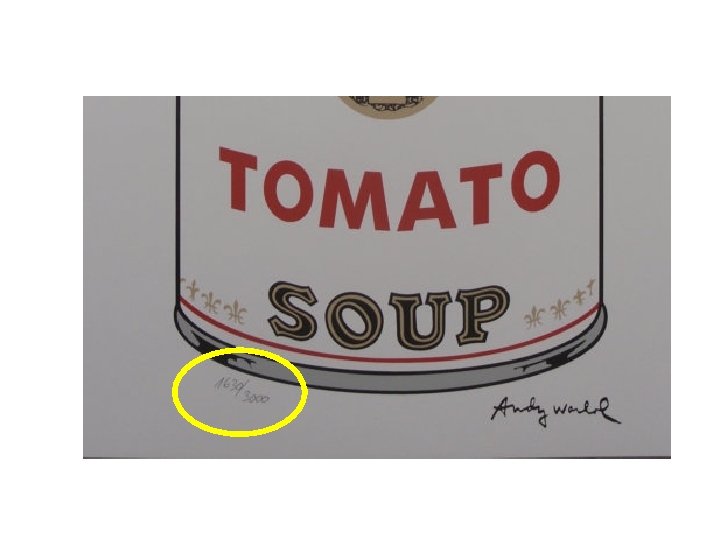
What gives an irredeemable cryptocurrency value? The limited-edition model
![Whence the demand for Bitcoin? [T]here is a perfectly rational demand for bitcoin as](http://slidetodoc.com/presentation_image_h2/c2423062f116cd8c059341cfb85d91e9/image-54.jpg "Whence the demand for Bitcoin? [T]here is a perfectly rational demand for bitcoin as")
Whence the demand for Bitcoin? [T]here is a perfectly rational demand for bitcoin as it is an excellent way to avoid both the beneficial and destructive attempts of governments to control economic activity and to grab wealth -- even if people holding it know that it's a terrible long-term investment. … John H. Cochrane (2017) https: //johnhcochrane. blogspot. com/2017/11/bitcoin-and-bubbles. html
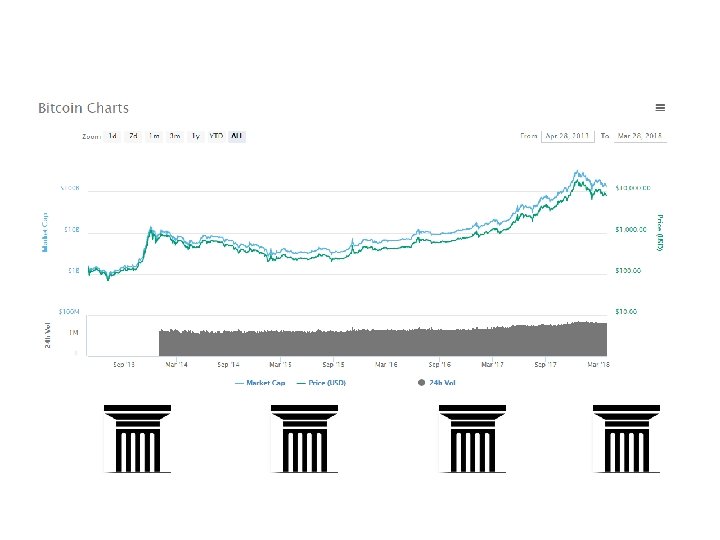

How big is Bitcoin today? June 2018 Top 10 $113 b @ $6, 625 / BTC

Could Bitcoin’s value vanish? Yes. • Irredeemable or non-commodity currency has no “fundamental” or “intrinsic” value, but many potential equilibrium prices, including zero – See: Berentsen and Schär (FRBSF 2018) – intrinsically useless item can have monetary value when agents coordinate on it as MOE; but zero when they abandon it for something else (Luther 2018) • A few once-prominent cryptocurrencies, valued in the $millions, have fallen to less than 1% of their peak values. Call them “dead coins”
 Current market cap: $0. 6")
http: //coinmarketcap. com/currencies/megacoin/#charts Peak market cap: $28 m (#5) Current market cap: $0. 6 m
 Current market cap: $0.")
http: //coinmarketcap. com/currencies/terracoin/#charts Peak market cap: $4. 1 m (#14) Current market cap: $0. 04 m

http: //coinmarketcap. com/currencies/mooncoin/#charts Peak market cap: $2. 7 m Current market cap: $0. 43 m

Could a fiat currency’s value vanish? Yes. However, Bitcoin is not the only currency that has no intrinsic value. State monopoly currencies, such as the U. S. dollar, the euro, and the Swiss franc, have no intrinsic value either. They are fiat currencies created by government decree. The history of state monopoly currencies is a history of wild price swings and failures. … It could be argued that, in some ways, the Bitcoin protocol is more robust than many of the existing fiat currency protocols. Only time will tell. Aleksander Berentsen and Fabian Schär (2018) https: //files. stlouisfed. org/files/htdocs/publications/review/2018/01/10/a-short-introduction-to-the-world-of-cryptocurrencies. pdf

5000 7500 10, 000 12, 500 15, 000 17, 500 20, 000 22, 500 25, 000 27, 500 http: //slideplayer. com/slide/9445340/29/images/83/The+Ecuadorian+Sucre+Exchange+Rate, +November+1998%E 2%80%93 March+2000. jpg

https: //www. zerohedge. com/news/2018 -01 -24/venezuelas-inflation-tops-6500 -new-recordhigh

Cryptocurrency an ongoing Hayekian experiment There remain many open questions and arguable points about these kinds of technologies and currencies, many of which can only be settled by actually fielding them and seeing how they work in practice, both in economic and security terms. https: //unenumerated. blogspot. com/2011/05/bitcoin-what-took-ye-so-long. html Nick Szabo (2011)

Market obstacles to wider use of Bitcoin • Volatility of Bitcoin’s purchasing power • Congestion of the Bitcoin blockchain – distributed ledger system scales poorly • Mengerian network advantage of established (fiat) currencies – Hard to achieve “critical mass” for an alternative standard • The same obstacles inhibit wider monetary use of gold -- but are smaller: – Gold’s purchasing power much less volatile – Single-gated-ledger clearing and settlement processes scale well – Gold currently held more widely: Bitcoin balances c. $113 b; Est. private holdings of gold coins + bullion + ETFs >10 x larger, c. $1. 7 trillion. Est. total gold stock, $7. 7 trillion. – Many projects underway to “tokenize” vaulted gold, making ownership transferable online

https: //www. gold. org/research/cryptocurrencies-no-substitute-for-gold?

Congestion: Blockchains too slow for retail • • • Visa, Master. Card: 17 -25, 000 tps BTC, ETH: max. 4 to 7 tps Nick Szabo (June 2017): “Satoshi made radical tradeoffs in favor of security and against performance. ” – Bitcoin’s massive ledger duplication means “a dreadful reduction in computational efficiency and scalability. ” – “At scale, you can’t pay for coffee on a premium global blockchain. You’ll need a peripheral financial network that settles on that blockchain. ” – • • https: //unenumerated. blogspot. com/2017/02/money-blockchains-and-social-scalability. html Will users adopt a distinct retail payment layer (e. g. Lightning Network) with end-of-day settlement? Will Bitcoin banking arise and proliferate?

Bitcoin is not a very good money. It is a pure fiat money (no backing), whose value comes from limited supply plus these demands. As such it has the huge price fluctuations we see. It's an electronic version of gold, and the price variation should be a warning to economists who long for a return to gold. John H. Cochrane https: //johnhcochrane. blogspot. com/2017/11/bitcoin-and-bubbles. html

Bitcoin “an electronic version of gold”? • • • “and the price variation should be a warning to economists who long for a return to gold”? Bitcoin and gold are supplied by very different mechanisms, which give very different degrees of long-run purchasing power stability Long run BTC: stock grows at programmed rate (vertical supply curve shifts right) ever more slowly (4% this year; 0% in 2140, max 21 m BTC), independent of the purchasing power of BTC. Long run Au: Mining increases the stock of gold above ground slowly on average (1839 -1919 @ 2. 9%/yr. ), but at a variable rate (range ≈ 1% - 5% per year) that responds to, and stabilizes, the purchasing power of Au over time. Gold has a nearly flat LR monetary stock supply curve. Key difference: induced variation in the rate of production when Δppg makes ppg is trend-reverting over the long run, a pattern seen clearly in the historical record.

Bitcoin and monetary gold stock supply in the SR 1/ P BTCS 1/ P GMS GMD BTC • • • Gm BTC supply curve vertical Au supply non-vertical For a given demand shift, more variation in ppb than ppg oz. Au

Bitcoin and monetary gold stock supply in the LR 1/ P BTCS 1/ P GMS BTCD BTC • • GMD Oz. Au BTC supply curve still vertical. “Mining” activity increases, but not Q produced. Au supply curve ≈ flat. SR ppg rise reversed in LR (c. 20 yrs. ) by increased mine output.

Supply shocks • • BTC completely free from supply shocks, unlike gold But historical gold supply shocks (even California gold rush) were small – again see ppg charts

- Slides: 73