The Earth in three dimensions From seismology to


")

![Interpretation: ratios Vp= [(K+4/3 G)/r] Vs= [G/r] The ratio dln. Vs/dln. Vp=2. 25 if](https://slidetodoc.com/presentation_image/57634fe99ce7b8ba5b1cb67b6a941a6f/image-8.jpg "Interpretation: ratios Vp= [(K+4/3 G)/r] Vs= [G/r] The ratio dln. Vs/dln. Vp=2. 25 if")


S Thermal expansivity a=-1/r( r/ T)P Grüneisen parameter ( P/ T)V=g.")


- Slides: 23
The Earth in three dimensions From seismology to composition and temperature
Is this the only model compatible with the data? If we project some chosen model onto the null space of the forward operator Then add it to original model. The same data fit is guaranteed! Deal et al. JGR 1999
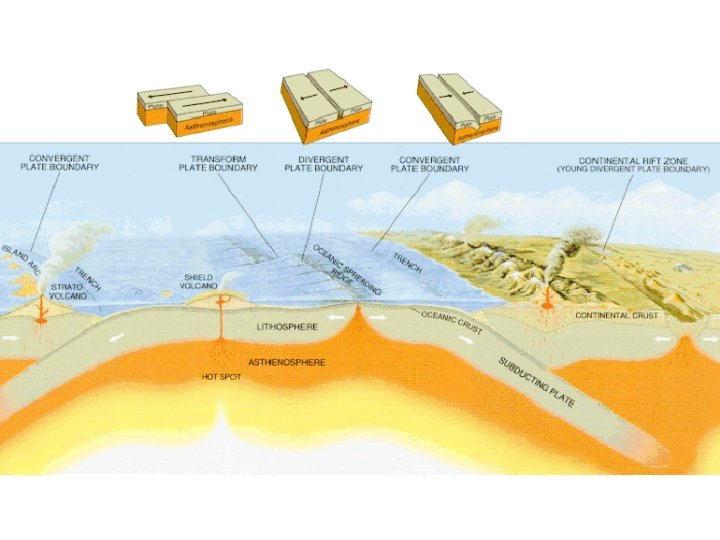
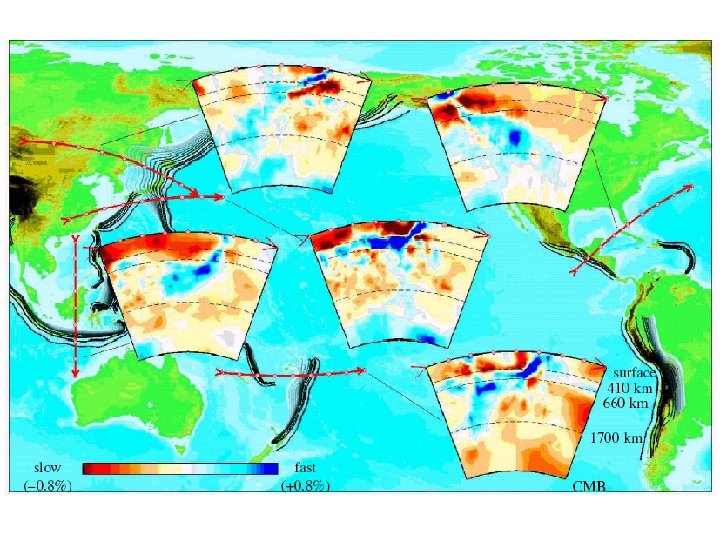
Seismic tomography (Masters et al. , 2000)
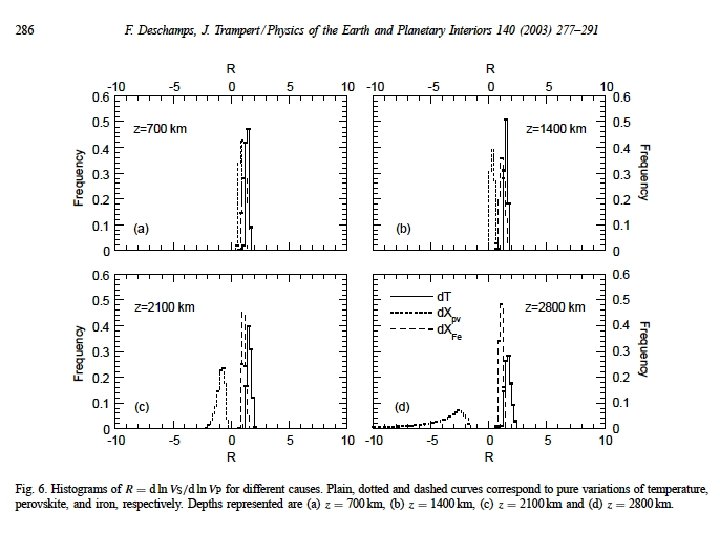
Radial variation of dln. Vs/dln. Vp most popular diagnostic Robertson and Woodhouse, 1996 ‘’The observations of RW 96 and SD 97 reinforce the conclusion that we should seek a compositional interpretation of tomographically observed velocity anomalies in the lower mantle’’ Stacey, 1998.
Interpretation: ratios Vp= [(K+4/3 G)/r] Vs= [G/r] The ratio dln. Vs/dln. Vp=2. 25 if the only variation is in G for a Poisson solid. This is also observed in laboratory experiments for thermal variations.
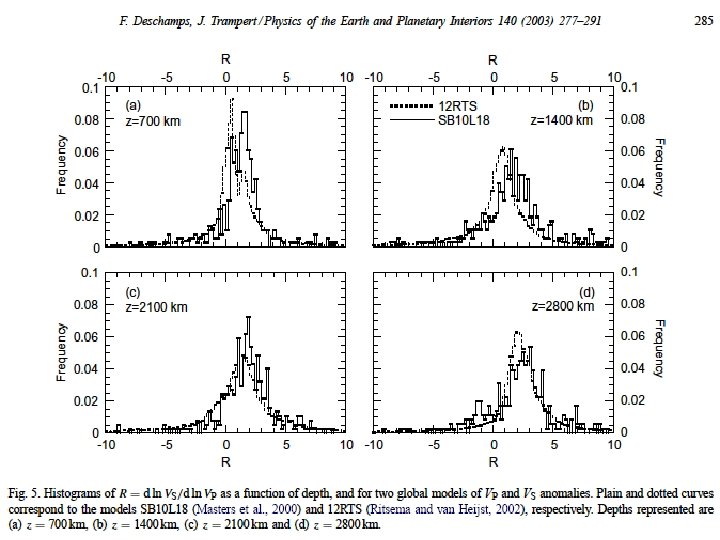
Average ratios of dln. Vs/dln. Vp are not useful if more than one cause is at play. It can best give a qualitative indication. The full histogram gives statistical evidence of compositional anomalies, but they can not be located in the Earth
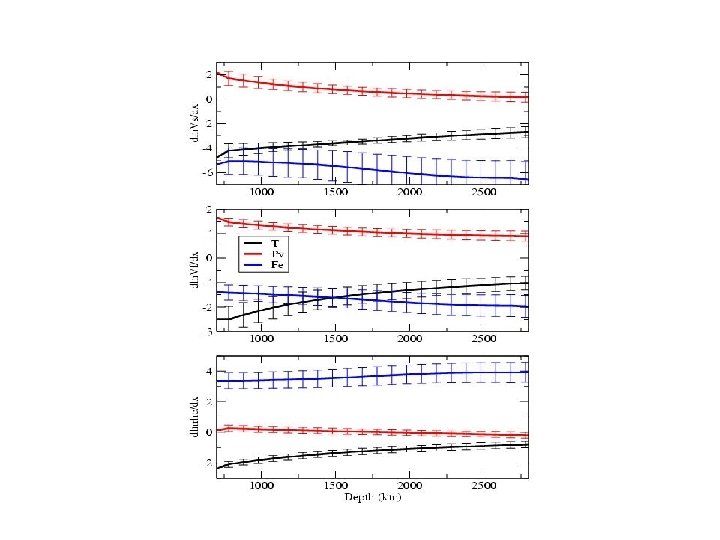
Direct inversion Example of a descending slab Using ln. Vp/ T=-1. 9 x 10 -5, ln. Vs/ T=-3. 0 x 10 -5 ln. Vp/ X =0. 056 and ln. Vs/ X=-0. 025, X is the perovskite content Taking dln. Vp=0. 003 and dln. Vs=0. 006, we find d. T=-190 K and d. X – 0. 011 which is -1. 1% perovskite variation, as expected
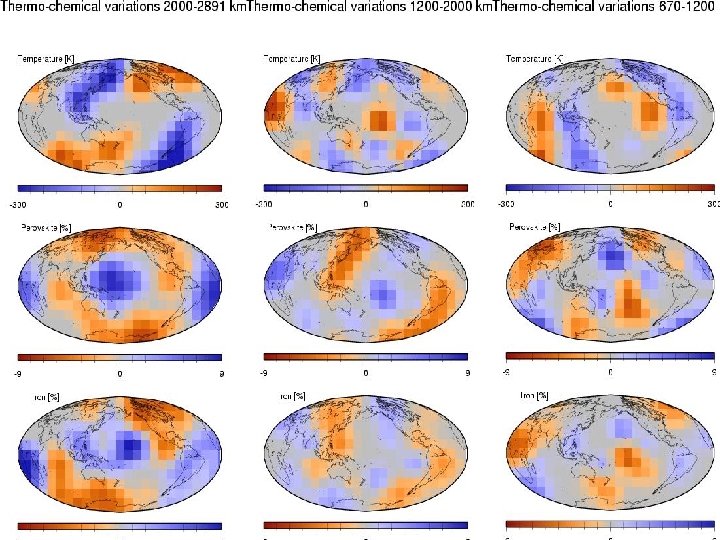
Probabilistic tomography
ØAveraged and gravity filtered models over 15 x 15 degree equal area caps ØLikelihoods in each cap are nearly Gaussian ØMost likely model (above one standard deviation) ØUniform uncertainties §dln. Vs=0. 12 % §dln. VΦ=0. 26 % §dlnρ=0. 48 %
Likelihood of correlation between seismic parameters Evidence for chemical heterogeneity Vs-VF
Incompressibility: KS=-V( P/ V)S Thermal expansivity a=-1/r( r/ T)P Grüneisen parameter ( P/ T)V=g. CV/V Anderson-Grüneisen : d=-1/a. Ks( Ks/ T)P Anderson-Grüneisen : e=-1/a. Ks( G/ T)P d = Ks’-1 -g+q Ks’~4, q~1, g~1, e>6 dlnr/dln. Vs~0. 2
Likelihood of rms-amplitude of seismic parameters Evidence for chemical heterogeneity RMS density
Likelihood of correlation between seismic and thermochemical parameters in the lowermost mantle
o. Ricard et al. JGR 1993 o. Lithgow-Bertelloni and Richards Reviews of Geophys. 1998 o. Superplumes