
The dynamics of estuarine turbidity maxima Stefan Talke
The dynamics of estuarine turbidity maxima Stefan Talke * Huib de Swart * Victor de Jonge Groningen Workshop March 3, 2006
Overview • Experiments • Analysis • Modeling • Ultimate Goal: Understand the effect of biology and physical processes on each other and morphology. • Preliminary Goal: Describe and analyze physical and biological processes separately
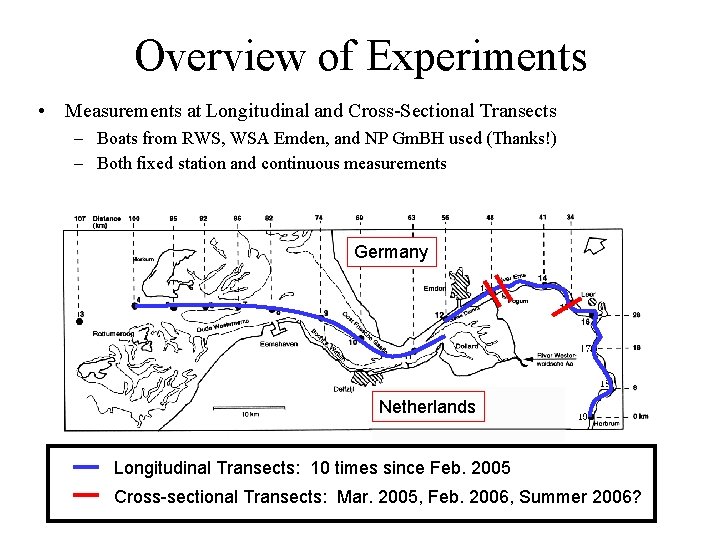
Overview of Experiments • Measurements at Longitudinal and Cross-Sectional Transects – Boats from RWS, WSA Emden, and NP Gm. BH used (Thanks!) – Both fixed station and continuous measurements Germany Netherlands Longitudinal Transects: 10 times since Feb. 2005 Cross-sectional Transects: Mar. 2005, Feb. 2006, Summer 2006?
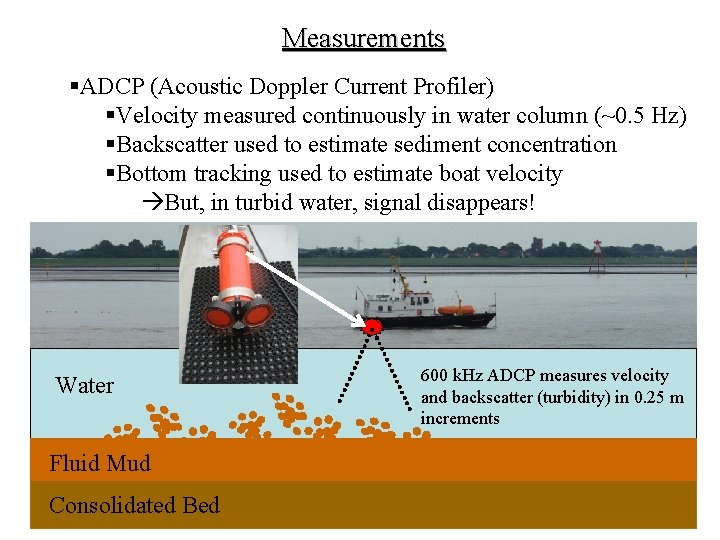
Measurements §ADCP (Acoustic Doppler Current Profiler) §Velocity measured continuously in water column (~0. 5 Hz) §Backscatter used to estimate sediment concentration §Bottom tracking used to estimate boat velocity But, in turbid water, signal disappears! Water Fluid Mud Consolidated Bed 600 k. Hz ADCP measures velocity and backscatter (turbidity) in 0. 25 m increments
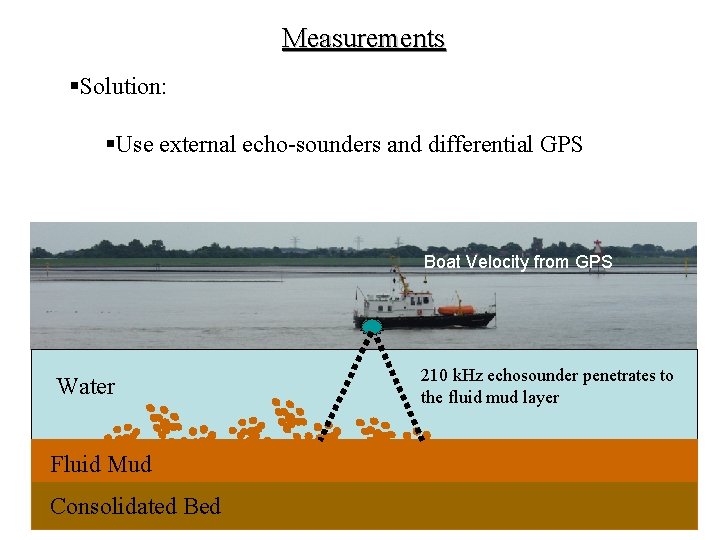
Measurements §Solution: §Use external echo-sounders and differential GPS Boat Velocity from GPS Water Fluid Mud Consolidated Bed 210 k. Hz echosounder penetrates to the fluid mud layer
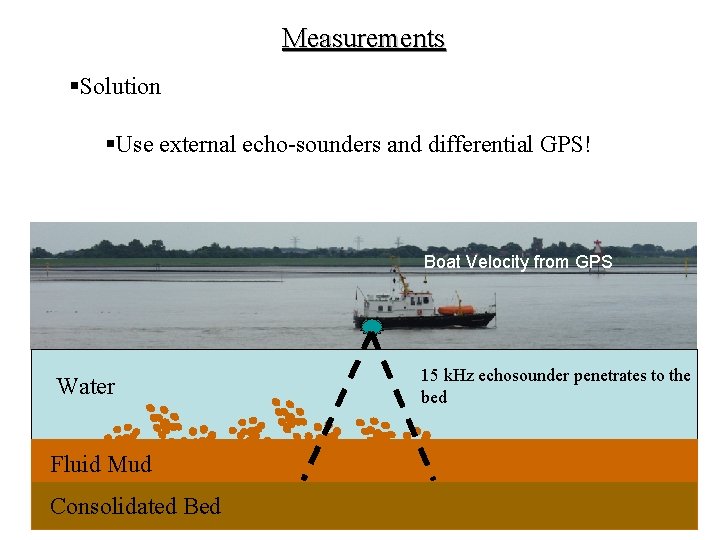
Measurements §Solution §Use external echo-sounders and differential GPS! Boat Velocity from GPS Water Fluid Mud Consolidated Bed 15 k. Hz echosounder penetrates to the bed
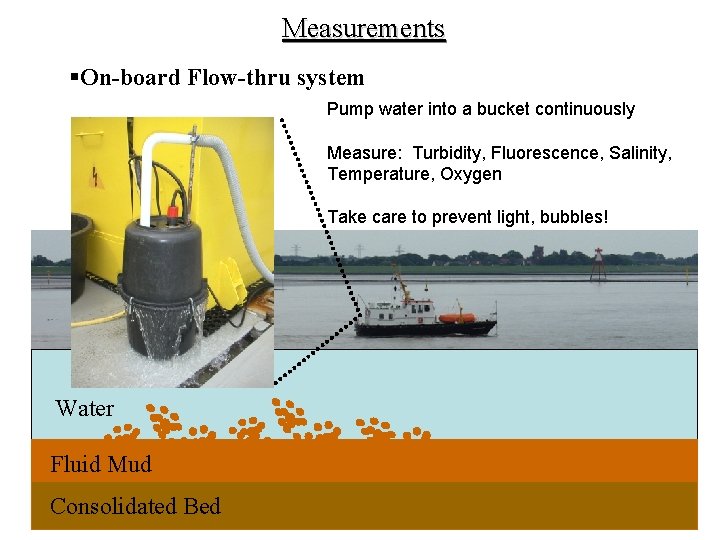
Measurements §On-board Flow-thru system Pump water into a bucket continuously Measure: Turbidity, Fluorescence, Salinity, Temperature, Oxygen Take care to prevent light, bubbles! Water Fluid Mud Consolidated Bed
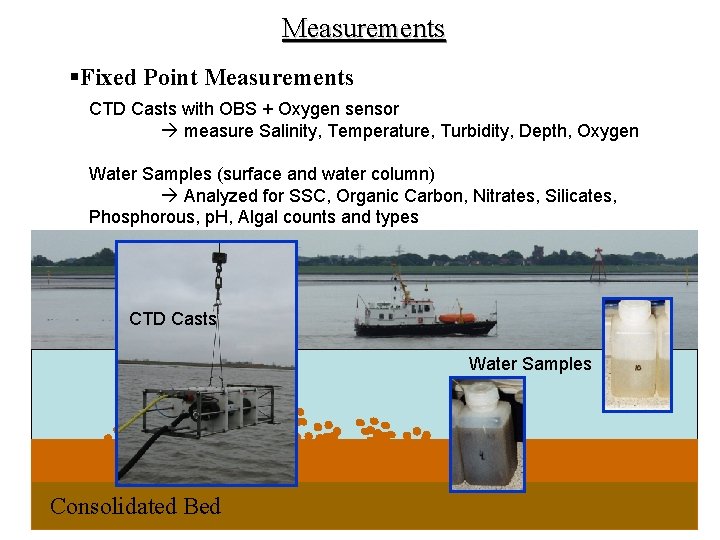
Measurements §Fixed Point Measurements CTD Casts with OBS + Oxygen sensor measure Salinity, Temperature, Turbidity, Depth, Oxygen Water Samples (surface and water column) Analyzed for SSC, Organic Carbon, Nitrates, Silicates, Phosphorous, p. H, Algal counts and types CTD Casts Water Samples Consolidated Bed
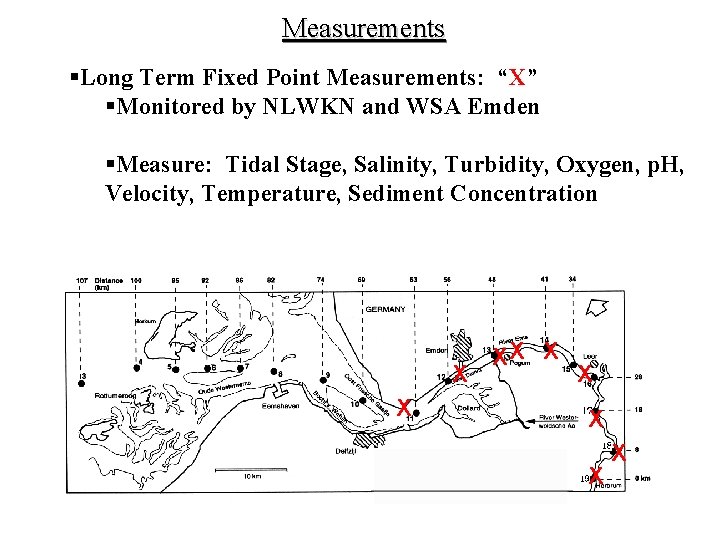
Measurements §Long Term Fixed Point Measurements: “X” §Monitored by NLWKN and WSA Emden §Measure: Tidal Stage, Salinity, Turbidity, Oxygen, p. H, Velocity, Temperature, Sediment Concentration CTD Casts Germany X X Netherlands XX X X
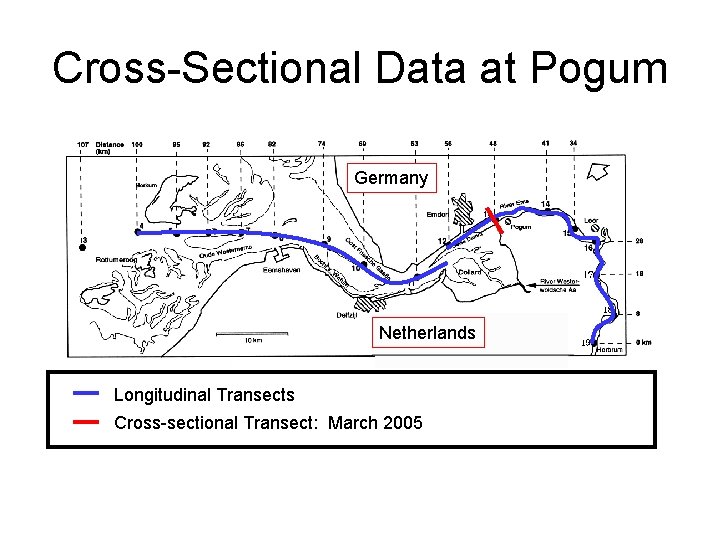
Cross-Sectional Data at Pogum Germany Netherlands Longitudinal Transects Cross-sectional Transect: March 2005
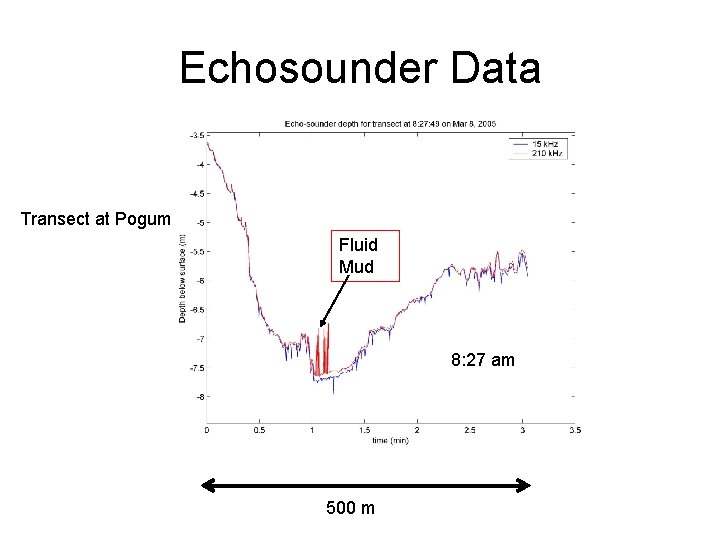
Echosounder Data Transect at Pogum Fluid Mud 8: 27 am 500 m
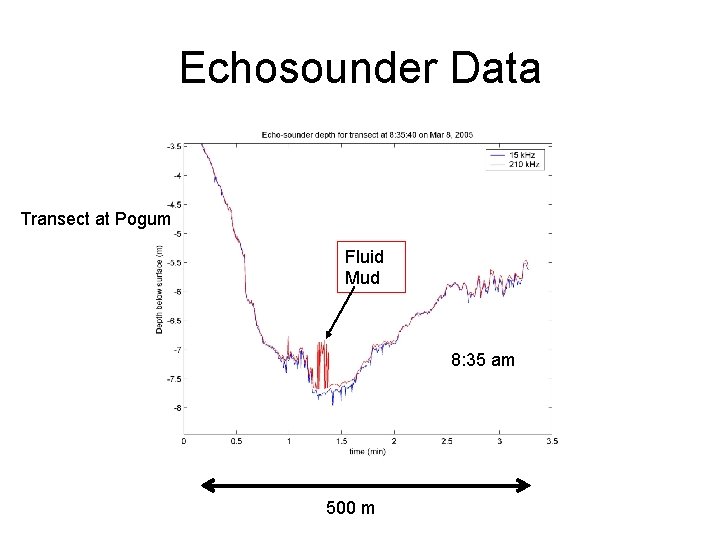
Echosounder Data Transect at Pogum Fluid Mud 8: 35 am 500 m
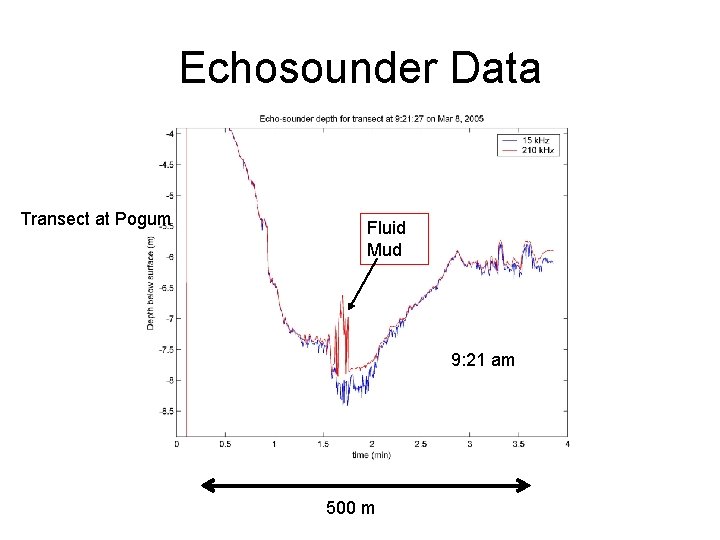
Echosounder Data Transect at Pogum Fluid Mud 9: 21 am 500 m
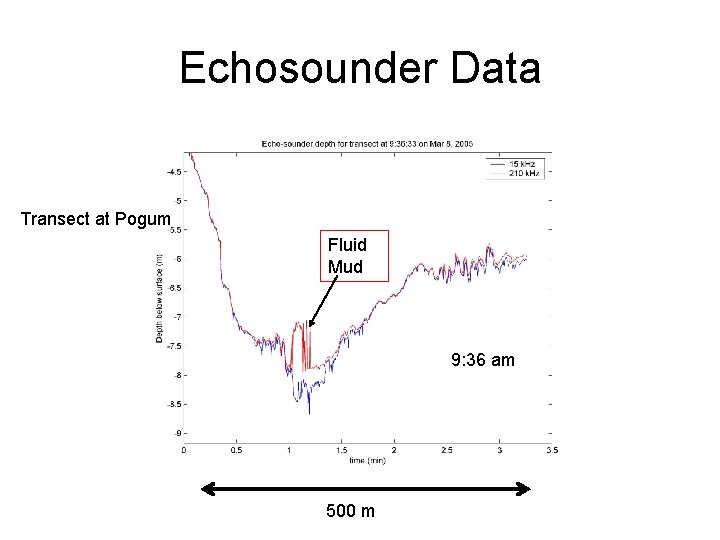
Echosounder Data Transect at Pogum Fluid Mud 9: 36 am 500 m
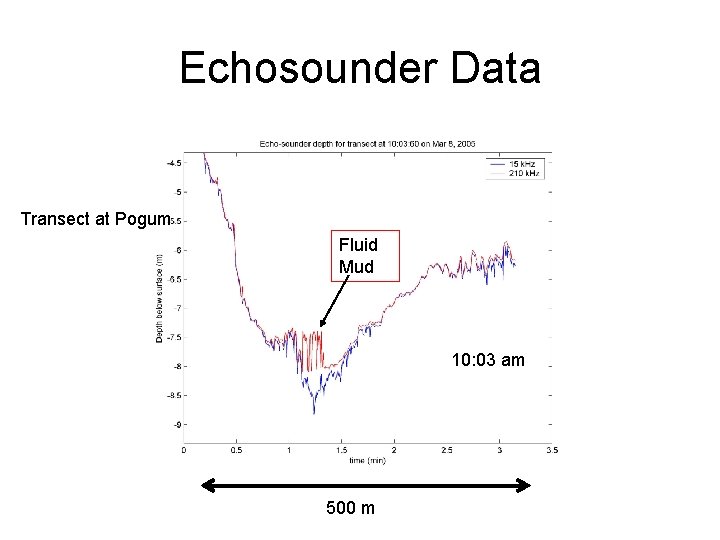
Echosounder Data Transect at Pogum Fluid Mud 10: 03 am 500 m
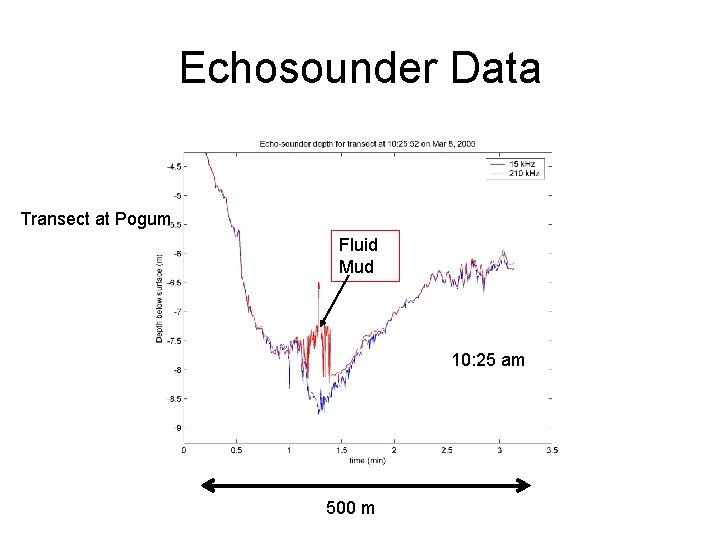
Echosounder Data Transect at Pogum Fluid Mud 10: 25 am 500 m
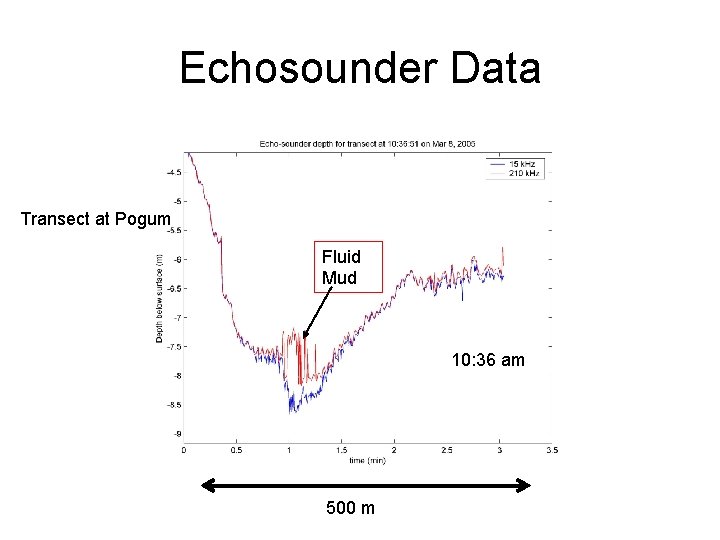
Echosounder Data Transect at Pogum Fluid Mud 10: 36 am 500 m
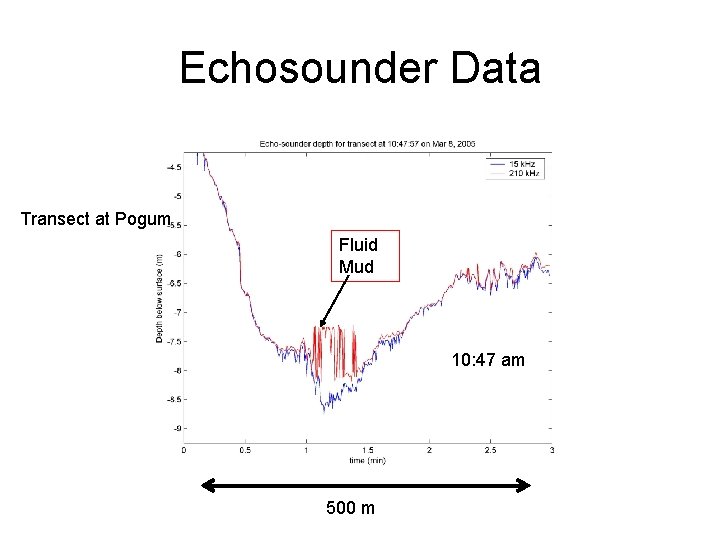
Echosounder Data Transect at Pogum Fluid Mud 10: 47 am 500 m
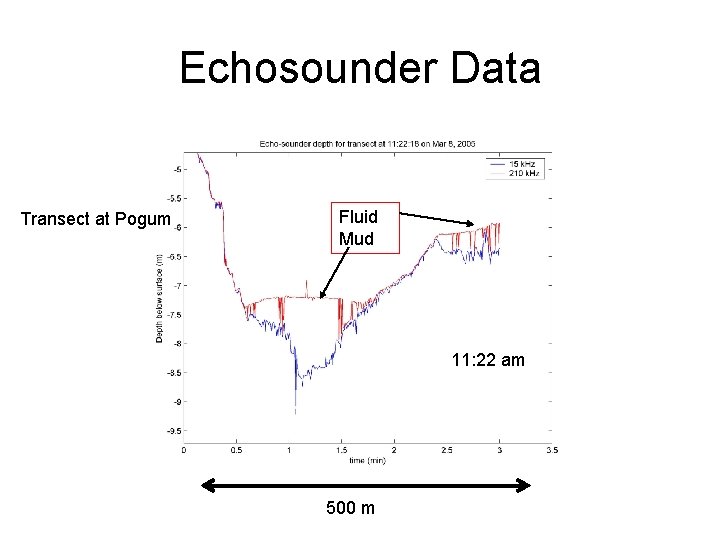
Echosounder Data Transect at Pogum Fluid Mud 11: 22 am 500 m
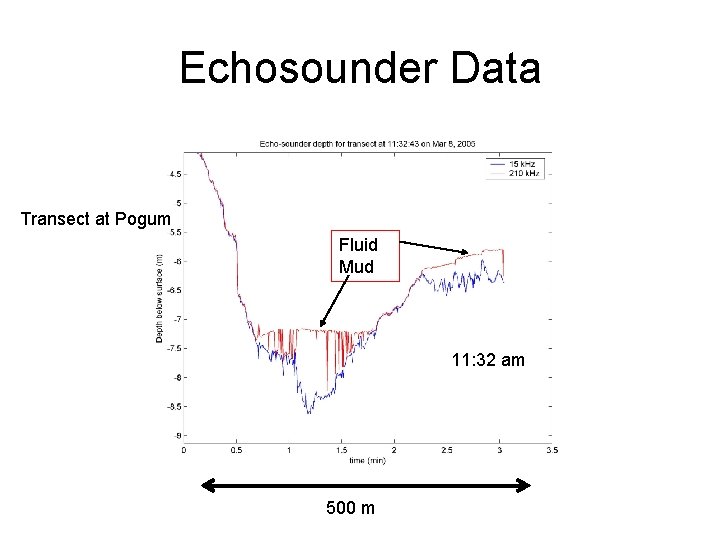
Echosounder Data Transect at Pogum Fluid Mud 11: 32 am 500 m
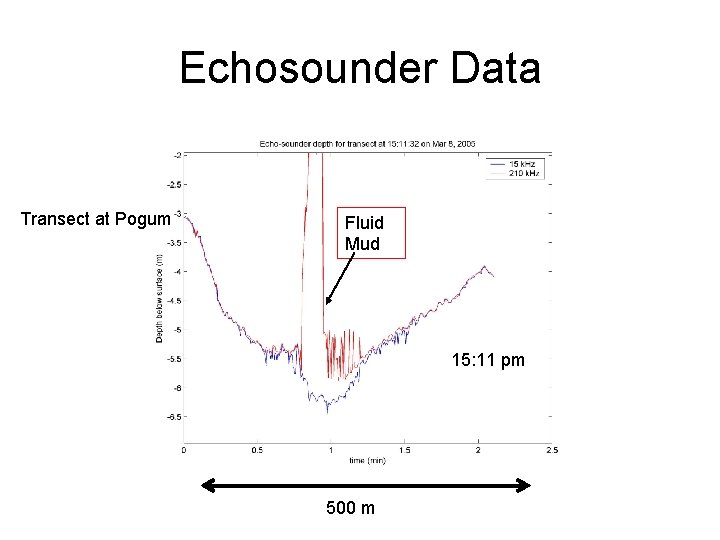
Echosounder Data Transect at Pogum Fluid Mud 15: 11 pm 500 m
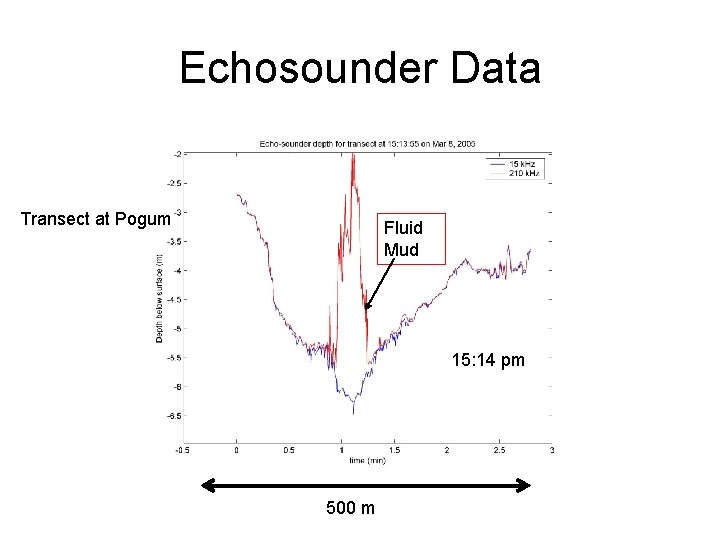
Echosounder Data Transect at Pogum Fluid Mud 15: 14 pm 500 m
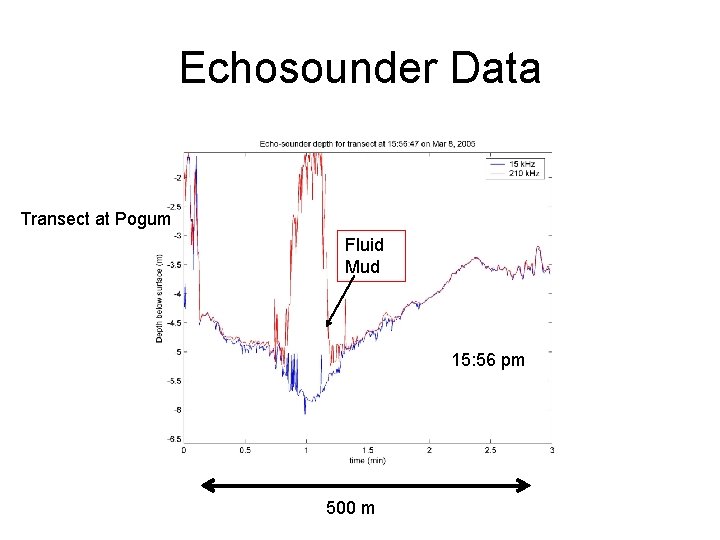
Echosounder Data Transect at Pogum Fluid Mud 15: 56 pm 500 m
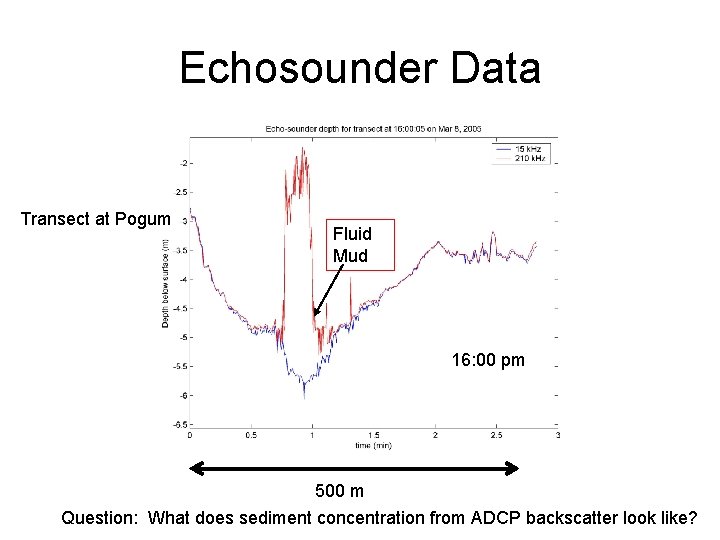
Echosounder Data Transect at Pogum Fluid Mud 16: 00 pm 500 m Question: What does sediment concentration from ADCP backscatter look like?
Research Questions • What are the sediment concentrations – Analysis of ADCP data • What does mixing and turbulence look like over a tidal period – Research project of Robbert Schippers (Msc): • Analyze field data to estimate turbulent mixing • Apply GOTM 1 -D vertical turbulence model
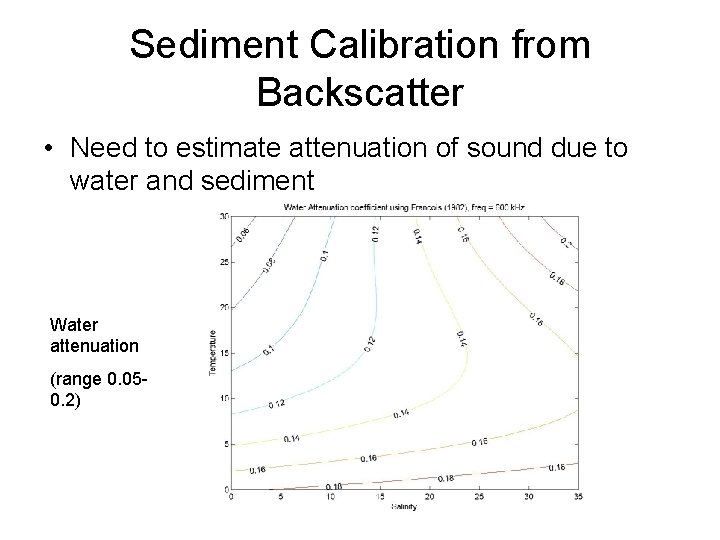
Sediment Calibration from Backscatter • Need to estimate attenuation of sound due to water and sediment Water attenuation (range 0. 050. 2)
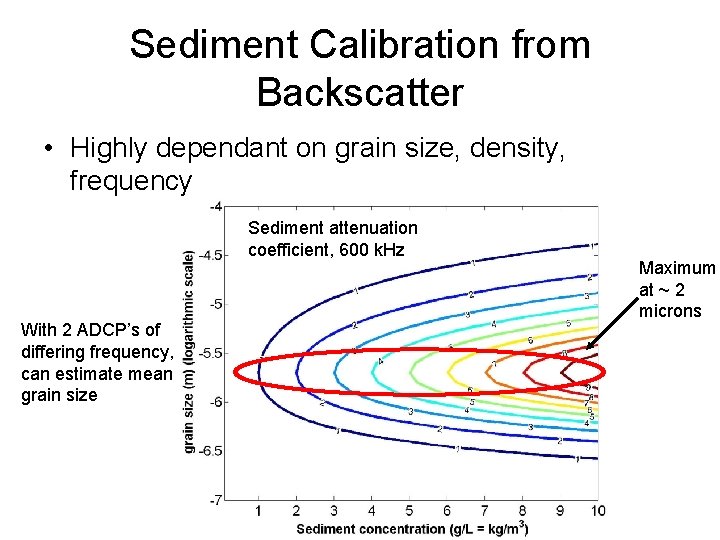
Sediment Calibration from Backscatter • Highly dependant on grain size, density, frequency Sediment attenuation coefficient, 600 k. Hz With 2 ADCP’s of differing frequency, can estimate mean grain size Maximum at ~ 2 microns
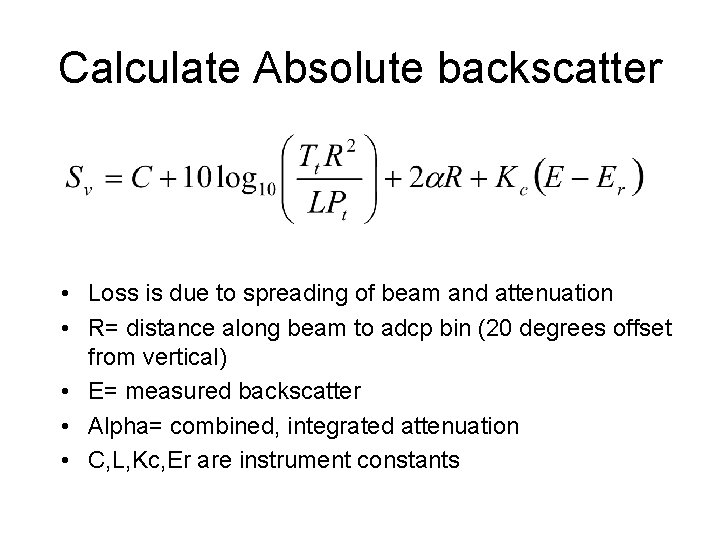
Calculate Absolute backscatter • Loss is due to spreading of beam and attenuation • R= distance along beam to adcp bin (20 degrees offset from vertical) • E= measured backscatter • Alpha= combined, integrated attenuation • C, L, Kc, Er are instrument constants
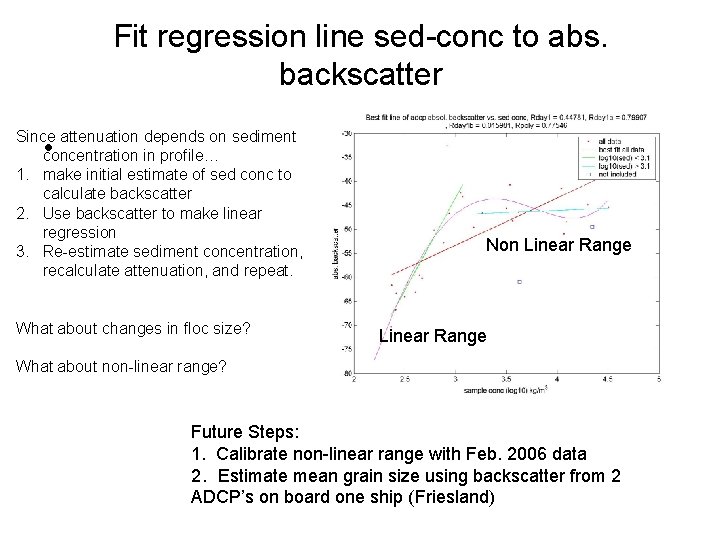
Fit regression line sed-conc to abs. backscatter Since attenuation depends on sediment concentration in profile… 1. make initial estimate of sed conc to calculate backscatter 2. Use backscatter to make linear regression 3. Re-estimate sediment concentration, recalculate attenuation, and repeat. • What about changes in floc size? Non Linear Range What about non-linear range? Future Steps: 1. Calibrate non-linear range with Feb. 2006 data 2. Estimate mean grain size using backscatter from 2 ADCP’s on board one ship (Friesland)
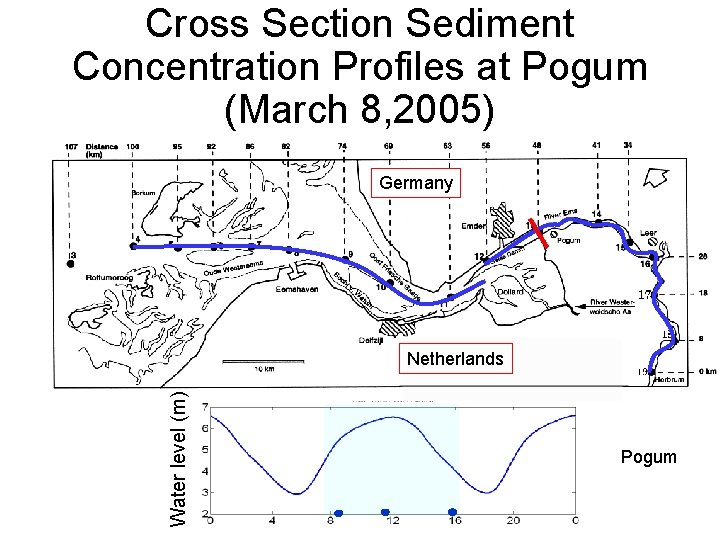
Cross Section Sediment Concentration Profiles at Pogum (March 8, 2005) Germany Water level (m) Netherlands Pogum
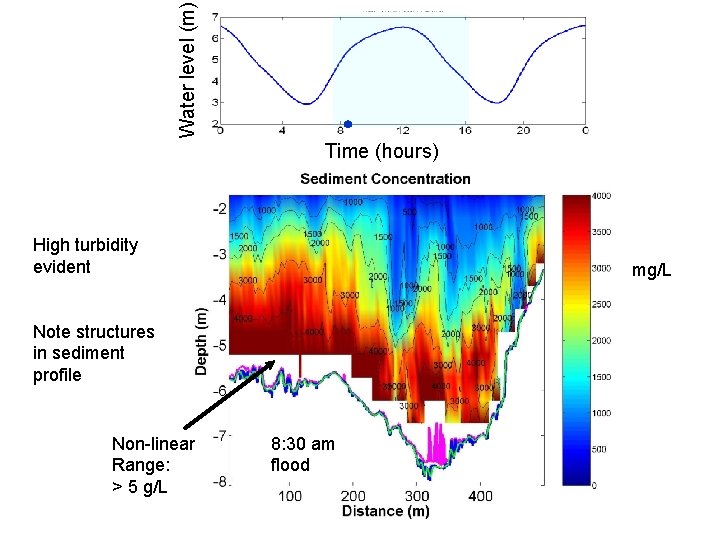
Water level (m) Time (hours) High turbidity evident mg/L Note structures in sediment profile Non-linear Range: > 5 g/L 8: 30 am flood
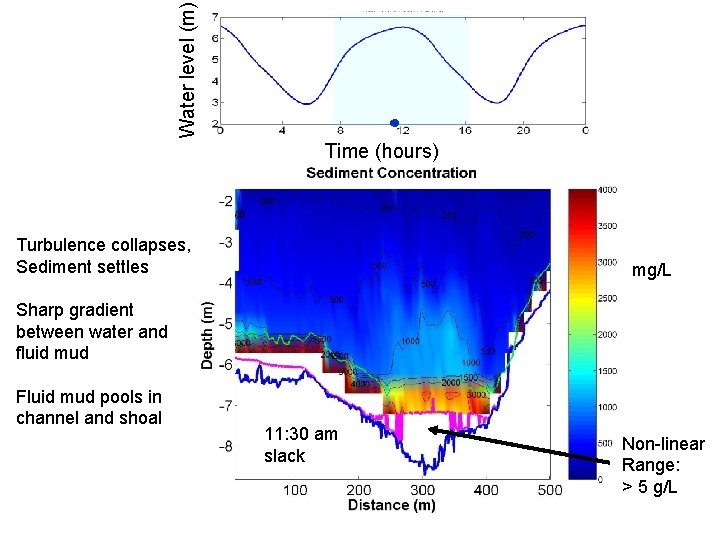
Water level (m) Time (hours) Turbulence collapses, Sediment settles mg/L Sharp gradient between water and fluid mud Fluid mud pools in channel and shoal 11: 30 am slack Non-linear Range: > 5 g/L
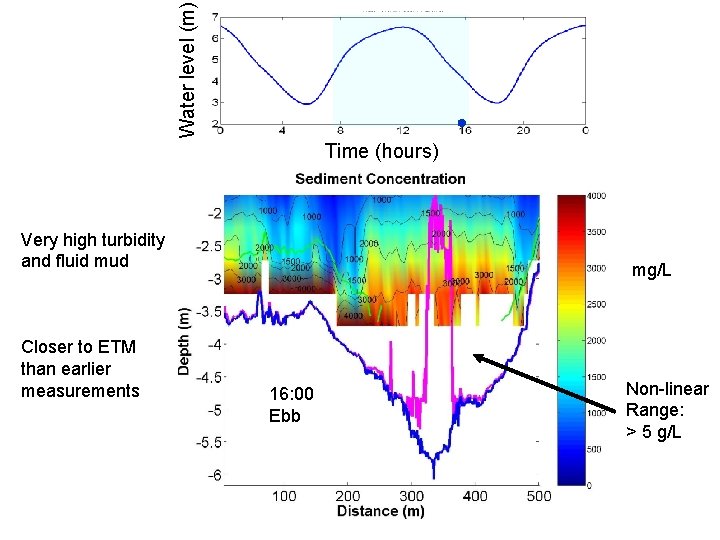
Water level (m) Time (hours) Very high turbidity and fluid mud Closer to ETM than earlier measurements mg/L 8: 30 am 16: 00 Ebb Non-linear Range: > 5 g/L
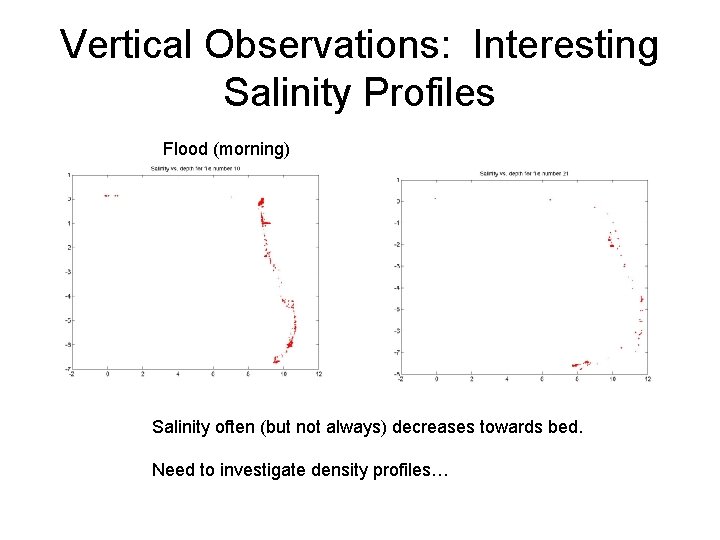
Vertical Observations: Interesting Salinity Profiles Flood (morning) Salinity often (but not always) decreases towards bed. Need to investigate density profiles…
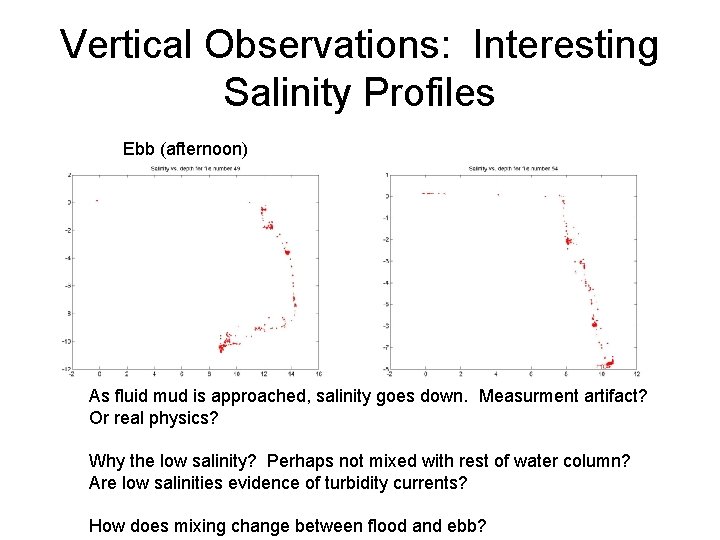
Vertical Observations: Interesting Salinity Profiles Ebb (afternoon) As fluid mud is approached, salinity goes down. Measurment artifact? Or real physics? Why the low salinity? Perhaps not mixed with rest of water column? Are low salinities evidence of turbidity currents? How does mixing change between flood and ebb?
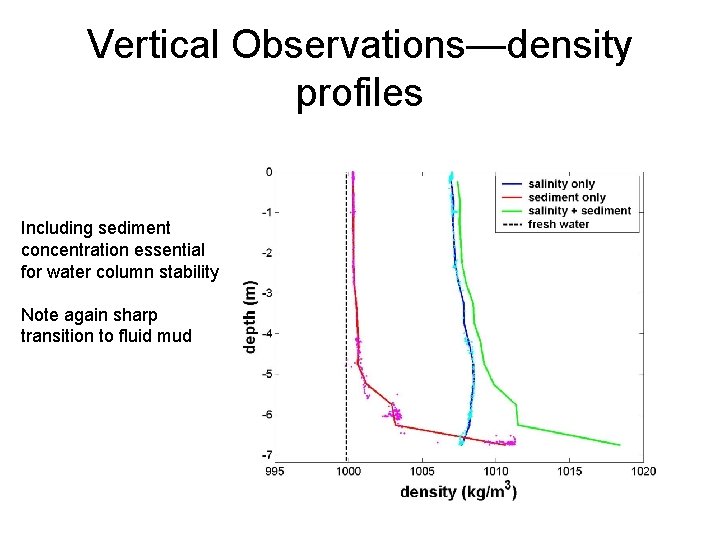
Vertical Observations—density profiles Including sediment concentration essential for water column stability Note again sharp transition to fluid mud
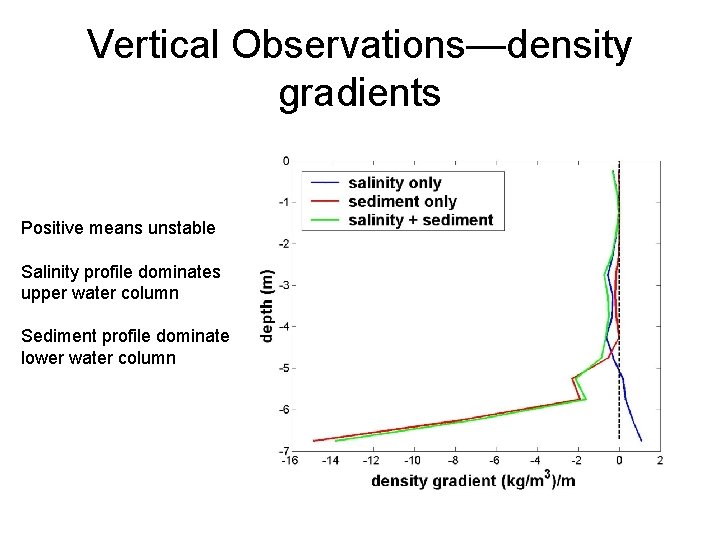
Vertical Observations—density gradients Positive means unstable Salinity profile dominates upper water column Sediment profile dominates lower water column
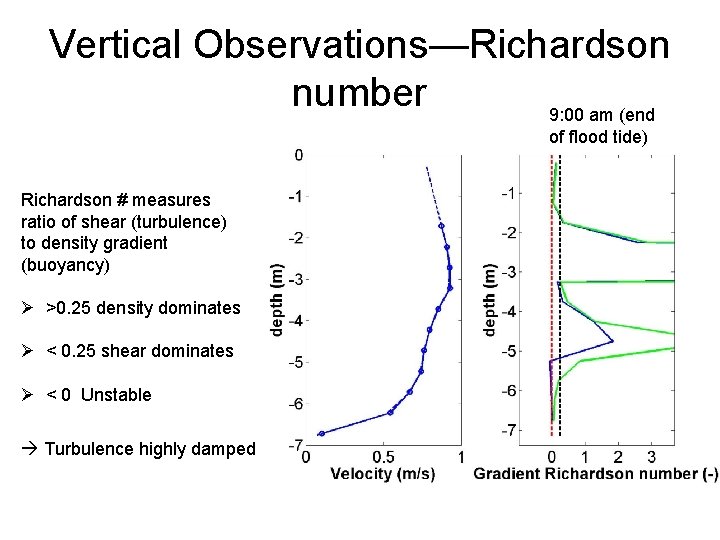
Vertical Observations—Richardson number 9: 00 am (end of flood tide) Richardson # measures ratio of shear (turbulence) to density gradient (buoyancy) Ø >0. 25 density dominates Ø < 0. 25 shear dominates Ø < 0 Unstable Turbulence highly damped
Summary vertical and cross-section measurements • High sediment concentrations observed – How and at what tidal phase is sediment being mixed into upper water column? • Periodic formation of fluid mud layer – Collapse of turbulence, formation of flocs
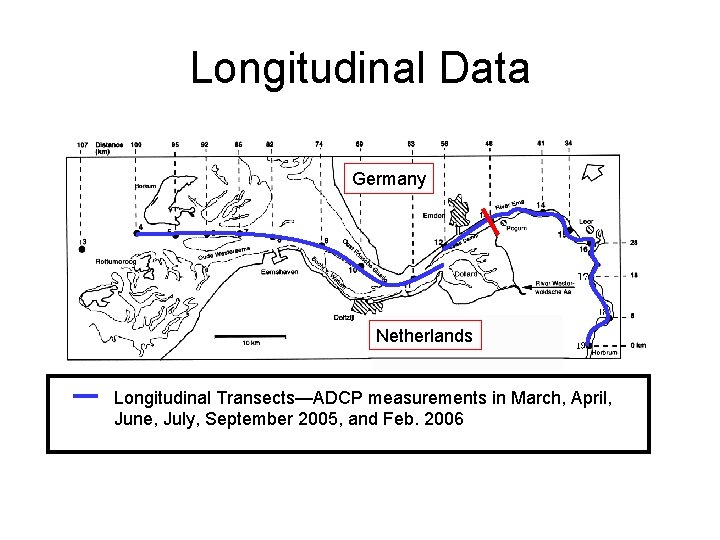
Longitudinal Data Germany Netherlands Longitudinal Transects—ADCP measurements in March, April, June, July, September 2005, and Feb. 2006
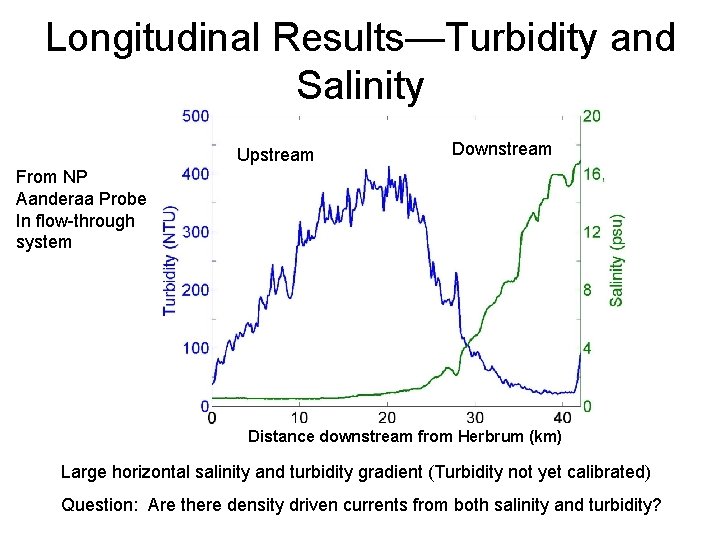
Longitudinal Results—Turbidity and Salinity Upstream Downstream From NP Aanderaa Probe In flow-through system Distance downstream from Herbrum (km) Large horizontal salinity and turbidity gradient (Turbidity not yet calibrated) Question: Are there density driven currents from both salinity and turbidity?
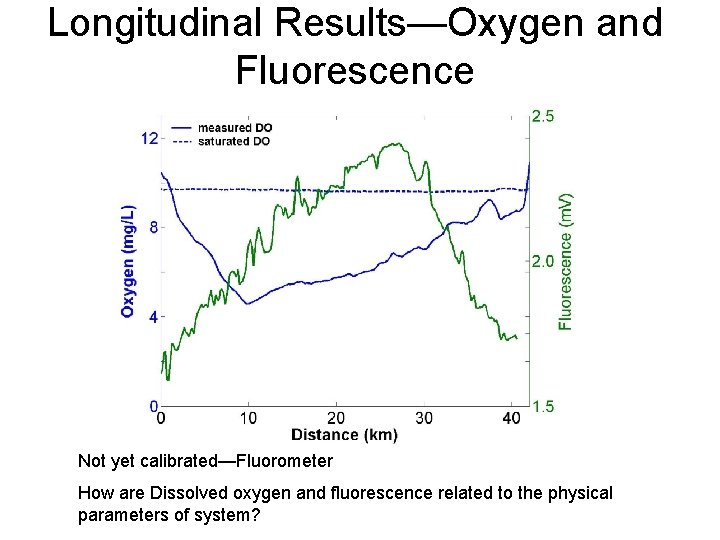
Longitudinal Results—Oxygen and Fluorescence Not yet calibrated—Fluorometer How are Dissolved oxygen and fluorescence related to the physical parameters of system?
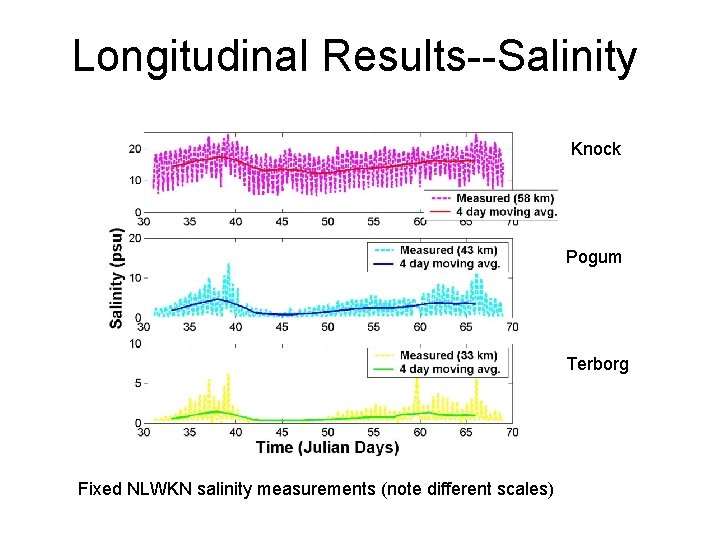
Longitudinal Results--Salinity Knock Pogum Terborg Fixed NLWKN salinity measurements (note different scales)
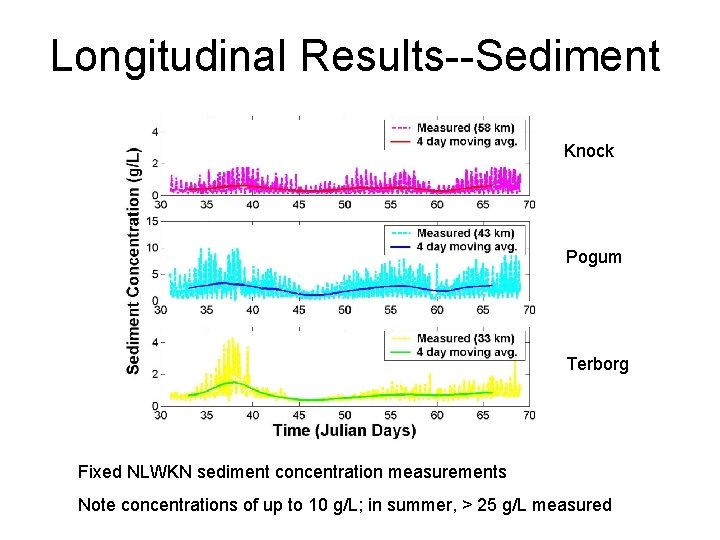
Longitudinal Results--Sediment Knock Pogum Terborg Fixed NLWKN sediment concentration measurements Note concentrations of up to 10 g/L; in summer, > 25 g/L measured
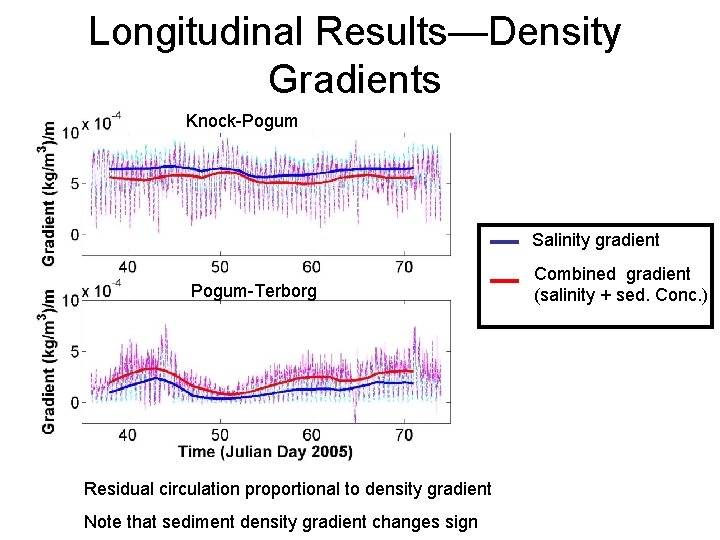
Longitudinal Results—Density Gradients Knock-Pogum Salinity gradient Pogum-Terborg Residual circulation proportional to density gradient Note that sediment density gradient changes sign Combined gradient (salinity + sed. Conc. )
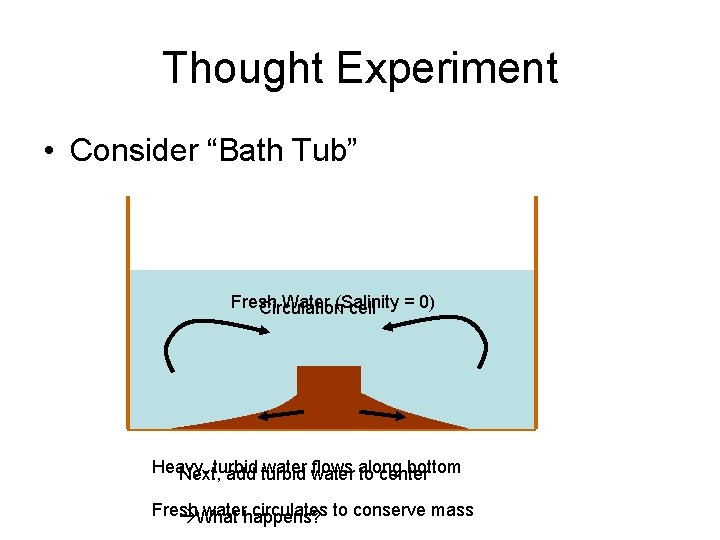
Thought Experiment • Consider “Bath Tub” Fresh Water (Salinity = 0) Circulation cell Heavy, water flows along bottom Next, turbid add turbid to center Fresh waterhappens? circulates to conserve mass What
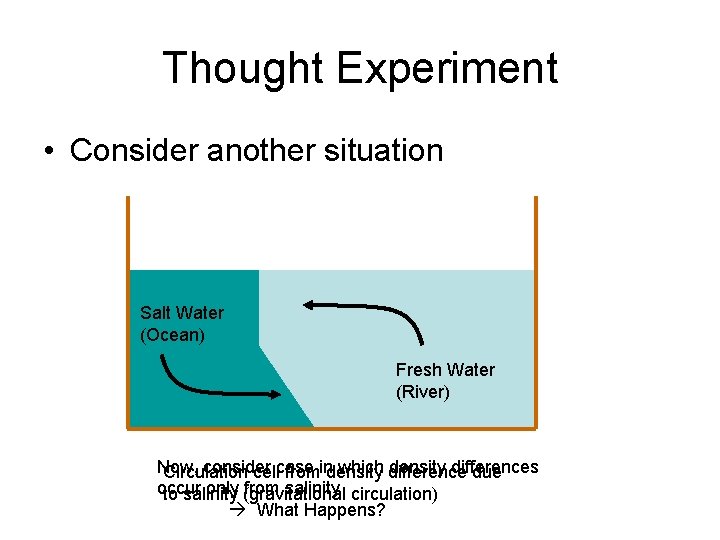
Thought Experiment • Consider another situation Salt Water (Ocean) Fresh Water (River) Now, consider which difference density differences Circulation cellcase fromindensity due occur only (gravitational from salinity circulation) to salinity What Happens?
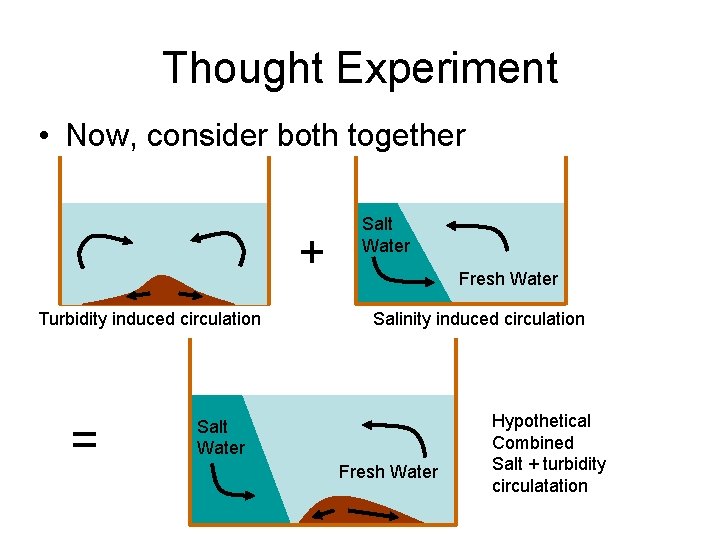
Thought Experiment • Now, consider both together + Turbidity induced circulation = Salt Water Fresh Water Salinity induced circulation Salt Water Fresh Water Hypothetical Combined Salt + turbidity circulatation
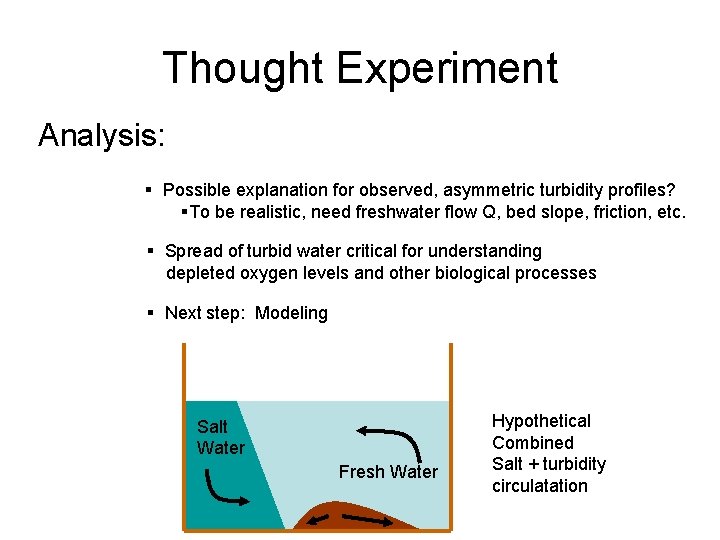
Thought Experiment Analysis: § Possible explanation for observed, asymmetric turbidity profiles? §To be realistic, need freshwater flow Q, bed slope, friction, etc. § Spread of turbid water critical for understanding depleted oxygen levels and other biological processes § Next step: Modeling Salt Water Fresh Water Hypothetical Combined Salt + turbidity circulatation
Development of Simple Model • We make the following assumptions: – No Tides—Consider only averages – Constant horizontal salinity gradient – Salinity well-mixed vertically – Sediment Concentration is prescribed – Balance between settling velocity and turbulent mixing
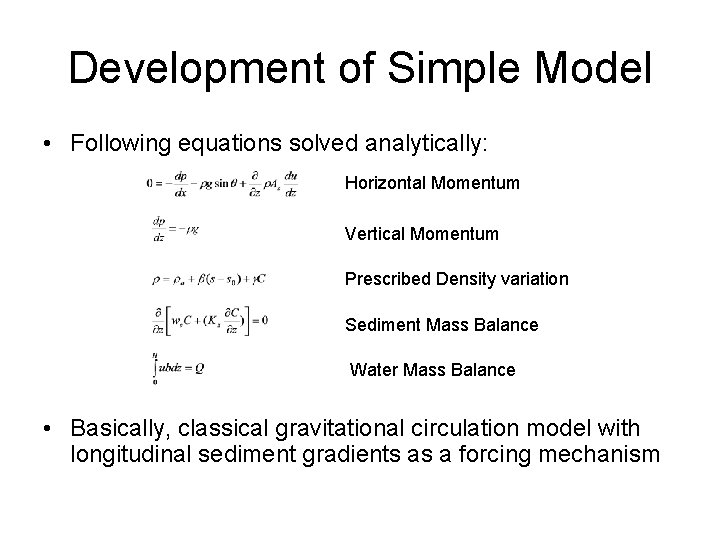
Development of Simple Model • Following equations solved analytically: Horizontal Momentum Vertical Momentum Prescribed Density variation Sediment Mass Balance Water Mass Balance • Basically, classical gravitational circulation model with longitudinal sediment gradients as a forcing mechanism
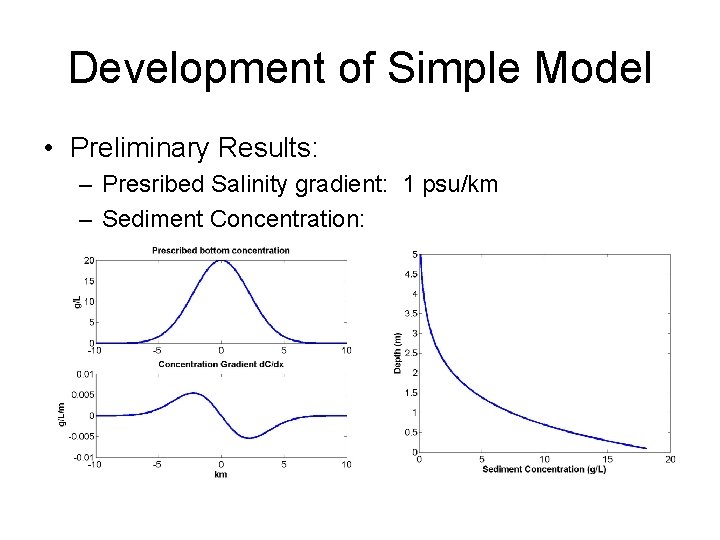
Development of Simple Model • Preliminary Results: – Presribed Salinity gradient: 1 psu/km – Sediment Concentration:
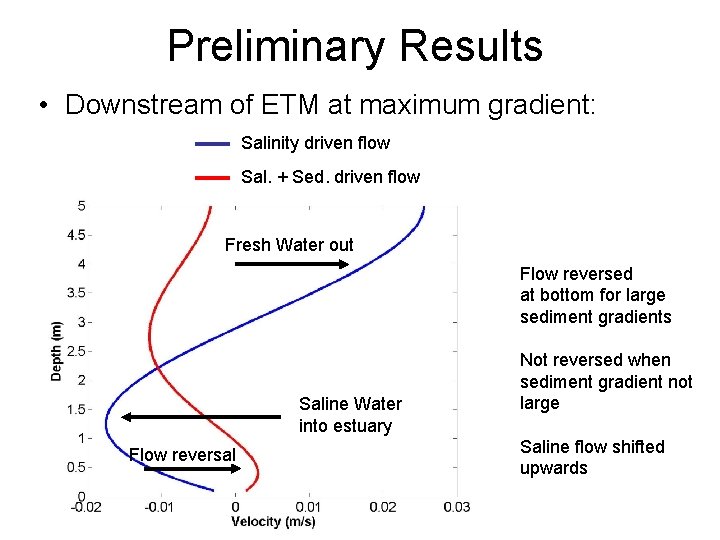
Preliminary Results • Downstream of ETM at maximum gradient: Salinity driven flow Sal. + Sed. driven flow Fresh Water out Flow reversed at bottom for large sediment gradients Saline Water into estuary Flow reversal Not reversed when sediment gradient not large Saline flow shifted upwards
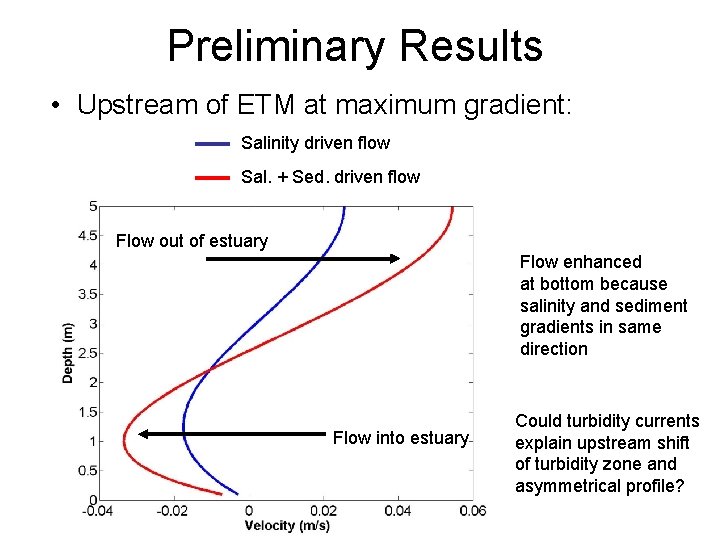
Preliminary Results • Upstream of ETM at maximum gradient: Salinity driven flow Sal. + Sed. driven flow Flow out of estuary Flow enhanced at bottom because salinity and sediment gradients in same direction Flow into estuary Could turbidity currents explain upstream shift of turbidity zone and asymmetrical profile?
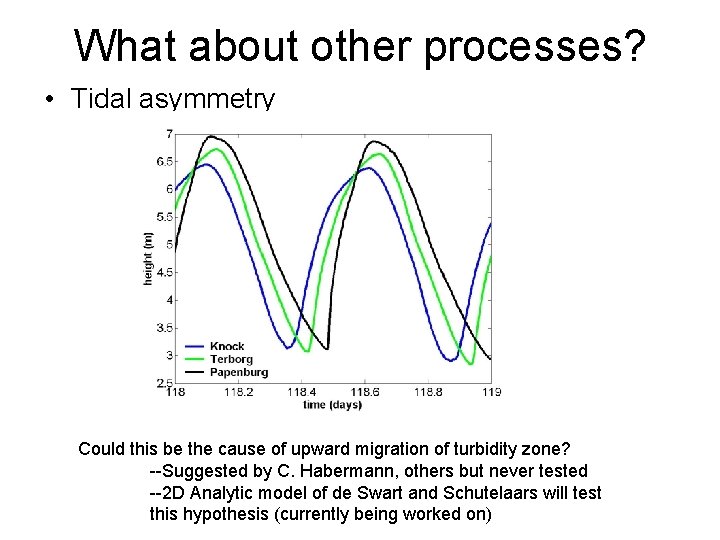
What about other processes? • Tidal asymmetry Could this be the cause of upward migration of turbidity zone? --Suggested by C. Habermann, others but never tested --2 D Analytic model of de Swart and Schutelaars will test this hypothesis (currently being worked on)
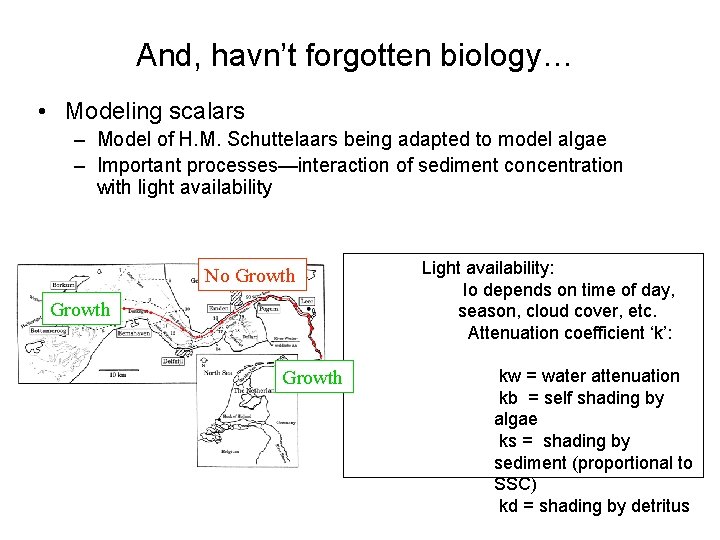
And, havn’t forgotten biology… • Modeling scalars – Model of H. M. Schuttelaars being adapted to model algae – Important processes—interaction of sediment concentration with light availability No Growth Light availability: Io depends on time of day, season, cloud cover, etc. Attenuation coefficient ‘k’: kw = water attenuation kb = self shading by algae ks = shading by sediment (proportional to SSC) kd = shading by detritus
Summary • Questions to come out of measurements – Why the funny vertical salinity profiles? – Can we calibrate non-linear range of ADCP backscatter? – Are there turbidity currents being driven by high sediment concentrations? How does this interact with longitudinal salinity gradient? – What controls the position and longitudinal extent of the ETM plume?
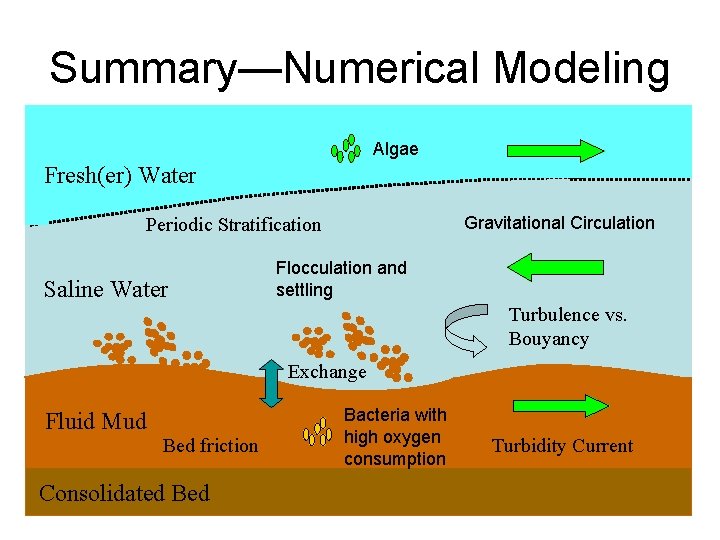
Summary—Numerical Modeling Algae Fresh(er) Water Gravitational Circulation Periodic Stratification Saline Water Flocculation and settling Turbulence vs. Bouyancy Exchange Fluid Mud Bed friction Consolidated Bacteria with high oxygen consumption Turbidity Current
Summary—Next steps • Continue developing models to investigate these questions – Turbidity induced circulation – Effect of tidal assymmetry on residual circulation – Vertical mixing processes near ETM • Both Salinity and Sediment induced density differences and stratification
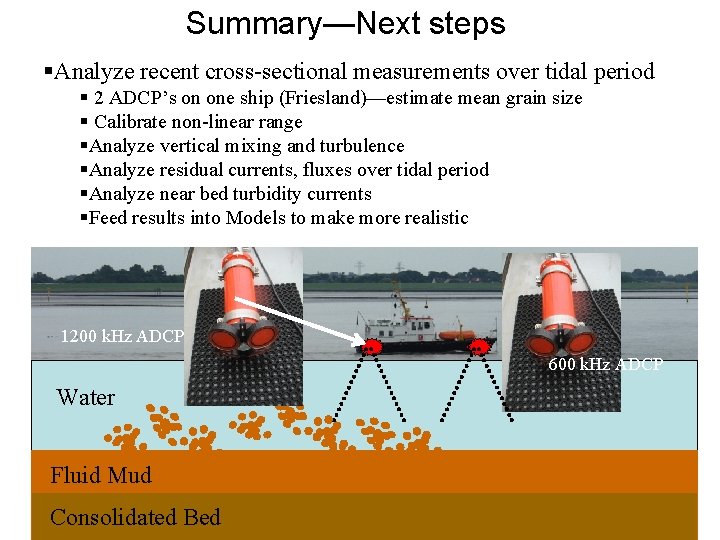
Summary—Next steps §Analyze recent cross-sectional measurements over tidal period § 2 ADCP’s on one ship (Friesland)—estimate mean grain size § Calibrate non-linear range §Analyze vertical mixing and turbulence §Analyze residual currents, fluxes over tidal period §Analyze near bed turbidity currents §Feed results into Models to make more realistic 1200 k. Hz ADCP 600 k. Hz ADCP Water Fluid Mud Consolidated Bed
Thanks for listening!
- Slides: 61