The Dependency Load and Population Pyramids Dependency Load


- Slides: 10
The Dependency Load and Population Pyramids Dependency Load: the percentage of the population that is non-working. It is conventionally defined as including people younger than age 15 and older than age 65. -People not in the dependency load are in the work force - tax payers -Knowing what percentage of our population is in the dependency load helps us determine the needs of our society. -Canada’s dependency load is 33% (21% children, 12% older adults) Population Pyramid: a graph that depicts population distribution by age and sex. -Population pyramids help us to see the dependency load, separated into males and females, and it also allows us to predict how the dependency load has changed, and will change, over time.
Example: Canada, 1961 1. What age group has the largest percentage of people? 2. What group has the smallest percentage of people? 3. What factors may have contributed to the population to have the pyramid look like this? http: //www 12. statcan. gc. ca/census-recensement/2006/as-sa/97 -551/vignettes/cda 06 pymd. swf
Types of Population Pyramids - There are three types of population pyramids. Each type displays the characteristics of a country’s population. 1. Expansive Pyramid displays : - High proportion of children - Low proportion of older people - High birth rate, high death rate, low life expectancy - Typical of a developing country - EX: Most countries in Africa and Asia - Canada: Nunavut - What factors contribute to this scenario? - Poor access to birth control - Lack of education - Need for family members to work http: //www 12. statcan. ca/english/census 06/analysis/agesex/vignettes/nu 06 pymd. html
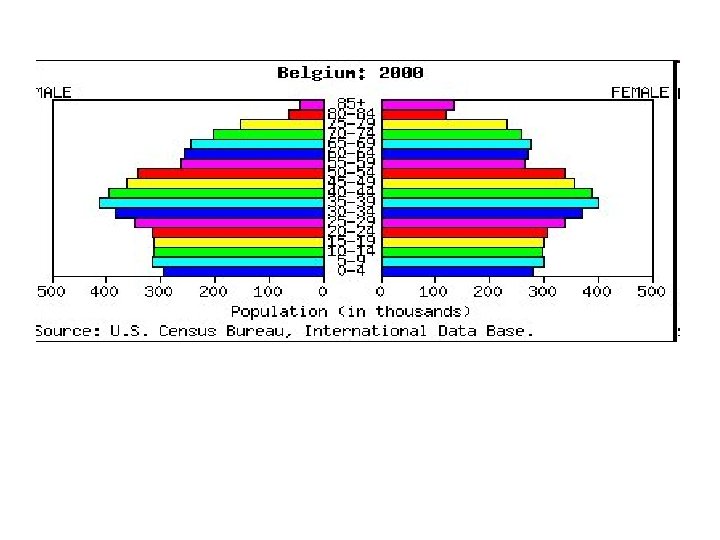
2. Stable Pyramid displays: - equal, or close to equal percentages of all age groups. - low birth rate and a low death rate - country has an unchanging pattern of births and deaths - Typical of a developed country - EX: Sweden, Norway, - Canada: Manitoba - What factors would contribute to this scenario? - high standard of living - change in social norms and values - easy access to birth control - improved health care http: //www 12. statcan. ca/english/census 06/analysis/agesex/vignettes/mb 06 pymd. html
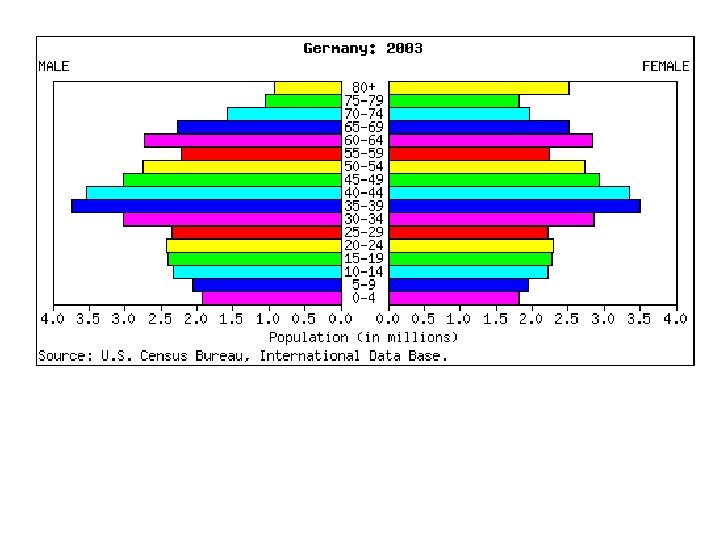
3. Constrictive Pyramid displays : - Lower percentages of younger people - Low birth rates and low death rates - Country has a ‘graying’ population - Typical of a developed country - EX: United States, Germany – Canada: Newfoundland - What factors would contribute to this scenario? - change in social norms and values - improved health care - drastic change in economy or employment http: //www 12. statcan. ca/english/census 06/analysis/agesex/vignettes/nl 06 pymd. html
Changes in Population Structure -A significant factor that has affect Canada’s population was the Baby Boom – a period between 1946 and 1961 where the birth rate increased sharply. -How would the baby boom affect the dependency load in the late 1940’s? - How did society and the economy change when ‘baby boomers’ were in the workforce? -How will the dependency load change when ‘baby boomers’ retire? - What will that affect you when you are in the workforce?