The Course of Atmospheric forecasting MUSTANSIRIYAH UNIVERSITY COLLEGE


 and in")


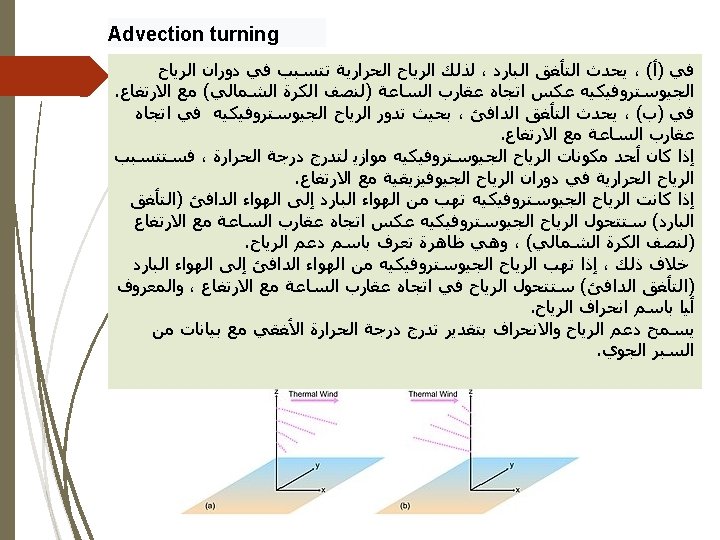
, cold advection is occurring, so thermal wind causes the geostrophic")
- Slides: 21
The Course of Atmospheric forecasting MUSTANSIRIYAH UNIVERSITY COLLEGE OF SCIENCES ATMOSPHERIC SCIENCES DEPARTMENT 2019 -2020 Dr. Jasim hameed THERID STAGE Thermal Wind
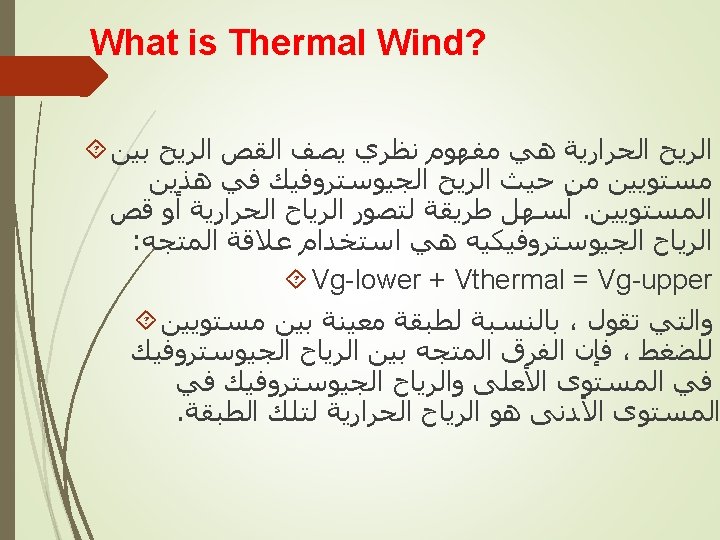
What is Thermal Wind? Thermal wind is a theoretical concept that describes the wind shear between two levels in terms of the geostrophic wind at those two levels. The easiest way to visualize thermal wind or geostrophic wind shear is to use the vector relationship: Vg-lower + Vthermal = Vg-upper which says that, for a given layer between two pressure levels, the vector difference between the geostrophic wind at the upper level and the geostrophic wind at the lower level is thermal wind for that layer.
Physical explanation The thermal wind is the change in the amplitude or sign of the geostrophic wind due to a horizontal temperature gradient. The geostrophic wind is an idealized wind that results from a balance of forces along a horizontal dimension. Whenever the Earth's rotation plays a dominant role in fluid dynamics, as in the mid-latitudes, a balance between the Coriolis force and the pressure-gradient force develops. Intuitively, a horizontal difference in pressure pushes air across that difference in a similar way that the horizontal difference in the height of a hill causes objects to roll downhill. However, the Coriolis force intervenes and nudges the air towards the right (in the northern hemisphere). This is illustrated in panel (a) of the figure below. The balance that develops between these two forces results in a flow that parallels the horizontal pressure difference, or pressure gradient. [1] In addition, when forces acting in the vertical dimension are dominated by the vertical pressuregradient force and the gravitational force, hydrostatic balance occurs.
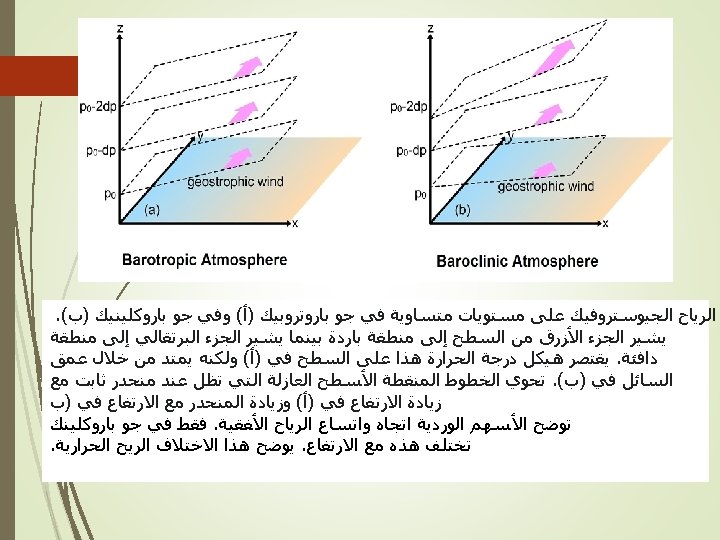
The geostrophic wind on different isobaric levels in a barotropic atmosphere (a) and in a baroclinic atmosphere (b). The blue portion of the surface denotes a cold region while the orange portion denotes a warm region. This temperature structure is restricted to the surface in (a) but extends through the depth of the fluid in (b). The dotted lines enclose isobaric surfaces which remain at constant slope with increasing height in (a) and increase in slope with height in (b). Pink arrows illustrate the direction and amplitude of the horizontal wind. Only in the baroclinic atmosphere (b) do these vary with height. Such variation illustrates thermal wind.
In a barotropic atmosphere, where density is a function only of pressure, a horizontal pressure gradient will drive a geostrophic wind that is constant with height. However, if a horizontal temperature gradient exists along isobars, the isobars will also vary with the temperature. In the mid-latitudes there often is a positive coupling between pressure and temperature. Such a coupling causes the slope of the isobars to increase with height, as illustrated in panel (b) of the figure to the left. Because isobars are steeper at higher elevations, the associated pressure gradient force is stronger there. However, the Coriolis force is the same, so the resulting geostrophic wind at higher elevations must be greater in the direction of the pressure force. [2] In a baroclinic atmosphere, where density is a function of both pressure and temperature, such horizontal temperature gradients can exist. The difference in horizontal wind speed with height that results is a vertical wind shear, traditionally called thermal wind. [2]
Relating Thermal Wind to Thickness In dynamic meteorology courses you will derive the vector relationship between thermal wind and thickness. For the purposes of this course, this relationship will be expressed in its scalar form as follows: Vt = (g/f)*(dh/dn) where: g. . . acceleration of gravity. . . Carioles parameter. . . thickness. . . natural coordinate normal to the thickness lines This equation says that the magnitude of thermal wind for a given layer is proportional to the thickness gradient for that layer. In other words, the closer together the thickness contours, the stronger thermal wind and hence the larger the vertical geostrophic wind shear. The farther apart the thickness contours, the weaker thermal wind and hence the smaller the vertical geostrophic wind shear.
The vector form of the above equation says that thermal wind vector is directed along the thickness contours with cold air on the left (looking downshear). Pictorially, where the black arrow represents thermal wind vector: Thermal Wind Relationship to Thickness (NH) In the Southern Hemisphere, the relationship is reversed with warm air on the left. Does this discussion remind you of the geostrophic wind relationship to height contours?
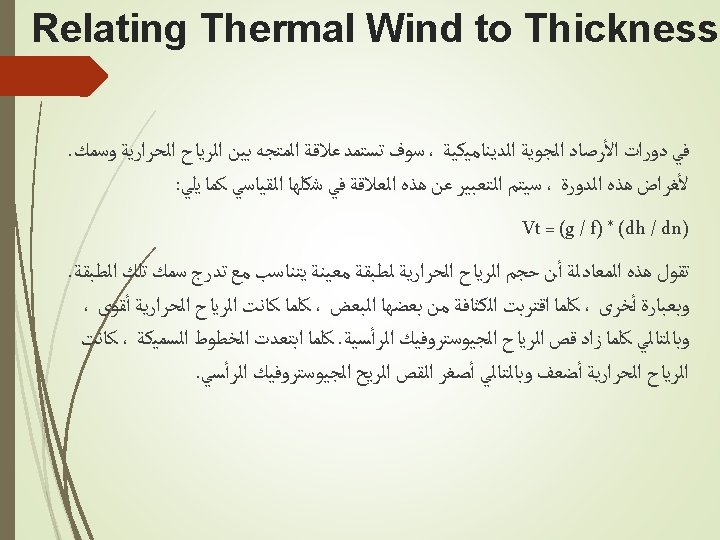
Backing and Veering The thermal wind relationship can be used to assess the type of thermal advection that is occurring within the layer under consideration. Consider the following situation: Warm Air Advection and Veering Wind The lower and upper level geostrophic wind vectors are shown above with the wind direction turning clockwise or veering with increasing height. The thermal wind vector is shown as the wind shear vector between the two layers. Using the relationship of thickness to thermal wind vector, there will be lower (colder) thickness to the top of the figure and higher (warmer) thickness values to the bottom of the figure.
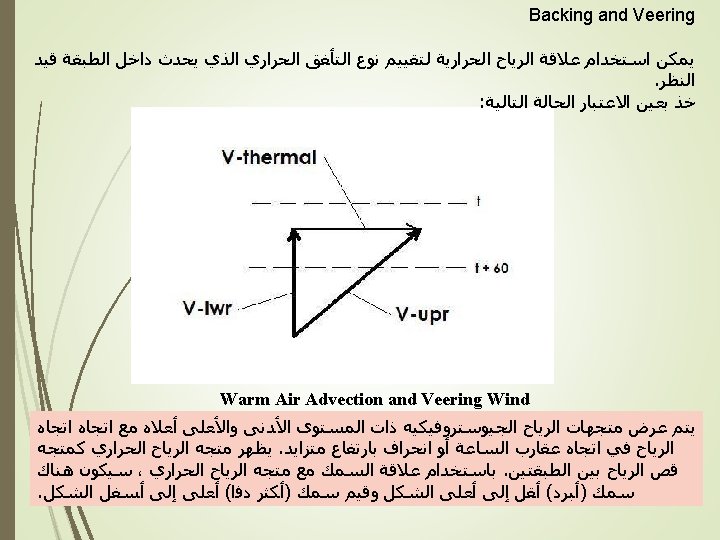
Examination of the figure indicates that the lower and upper level geostrophic winds are blowing from warmer toward colder thickness values. In other words, there is warm air advection in the layer. Compare the above situation to the following: Cold Air Advection and Backing Wind The lower and upper level geostrophic wind vectors are shown above with the wind direction turning counter-clockwise or backing with increasing height. The thermal wind vector is again shown as the wind shear vector between the two layers. Using the relationship of thickness to thermal wind vector, there will again be lower (colder) thickness to the top of the figure and higher (warmer) thickness values to the bottom of the figure.
Examination of the figure indicates that the lower and upper level geostrophic winds are blowing from colder toward warmer thickness values. In other words, there is cold air advection in the layer. Summarizing these results: When the geostrophic winds turn clockwise or veer with height through a layer, warm air advection is occurring in the layer When the geostrophic winds turn counter-clockwise or back with height through the layer, cold air advection is occurring in the layer
Practical Application of the Thermal Wind Concept • Although the above discussion is based on theoretical relationships, it can be applied to vertical profiles of wind direction and speed. • Essentially, examination of the change in wind direction with height implies the something about thermal advection in the layer. • For example, if the winds veer with height through a layer, the implication is that warm air advection is occurring in the layer. Similarly, if the winds back with height through a layer, the implication is that cold air advection is occurring in the layer. • Similarly, the wind shear vector can imply something about the relative direction of warm and cold air for a particular layer. • The bottom line: if the only weather data you have are location surface observations and a local sounding, you can imply something about the regional thermal structure by applying the concept of thermal wind as discussed in this lesson. In the "old days" this process was known as single station analysis. • One way of evaluating backing and veering is the hodograph . A hodograph is a polar-coordinate presentation of wind speed and wind direction . See the web page on hodographs on the operational weather topics page
Advection turning In (a), cold advection is occurring, so thermal wind causes the geostrophic wind to rotate counterclockwise (for the northern hemisphere) with height. In (b), warm advection is occurring, so the geostrophic wind rotates clockwise with height. If a component of the geostrophic wind is parallel to the temperature gradient, thermal wind will cause the geostrophic wind to rotate with height. If geostrophic wind blows from cold air to warm air (cold advection) the geostrophic wind will turn counterclockwise with height (for the northern hemisphere), a phenomenon known as wind backing. Otherwise, if geostrophic wind blows from warm air to cold air (warm advection) the wind will turn clockwise with height, also known as wind veering. Wind backing and veering allow an estimation of the horizontal temperature gradient with data from an atmospheric sounding.