THE COSTS OF SUBURBAN SPRAWL AND URBAN DECAY

THE COSTS OF SUBURBAN SPRAWL AND URBAN DECAY

What is Suburban Sprawl? Sprawl is unsustainable development that wastes tax dollars, destroys farmland open space, and neglects existing infrastructure and community resources.

Everything is a Drive Away Suburban parents spend 17 full. Schools days a year Shops Homebehind the wheel, more than the average parent spends dressing, bathing and feeding a child. Source: Surface Transportation Policy Project Recreation Workplace

About Grow Smart RI Statewide non-profit organization l Diverse coalition of interests l

Mission Promote patterns of development that…… - Revitalize city & town centers Preserve historic, cultural and natural resources Expand economic opportunity for all Rhode Islanders

How We Get it Done Research / Education l Policy Reform / Advocacy l Building municipal capacity l

The Costs of Sprawl and Urban Decay in Rhode Island Published December, 1999

Rhode Island Growth Trends 1980 -2000 l Population l Housing l Motor growth = 6. 9% growth = 17. 2% vehicle growth = 16. 4%

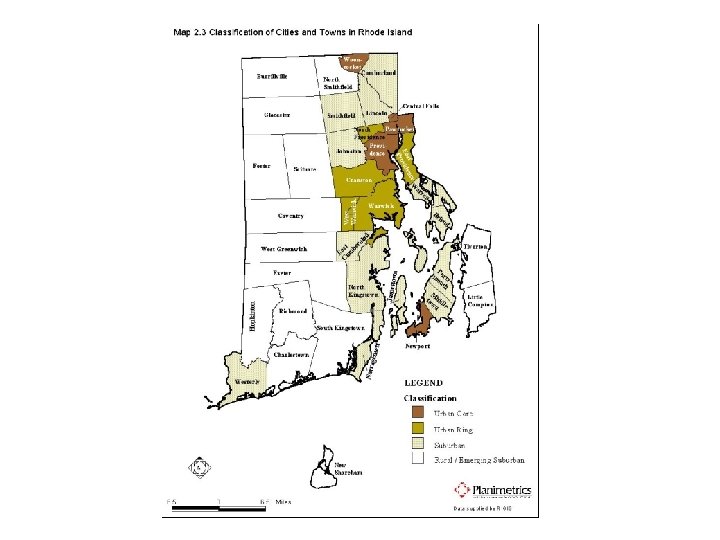
Increase in developed land 1961 -1995 l Core: l Ring: l Suburb l Rural 54% increase 122% increase 169% increase 205% increase

Costs of Sprawl Loss of farms and forestland – 1964 -1997: farmland reduced by half – Potential additional loss by 2020: 3, 100 acres farmland 24, 000 acres forestland l Infrastructure Costs – Roads – School facilities – Utility lines l

• Social Costs Poverty in Core Cities

Loss of jobs from core cities

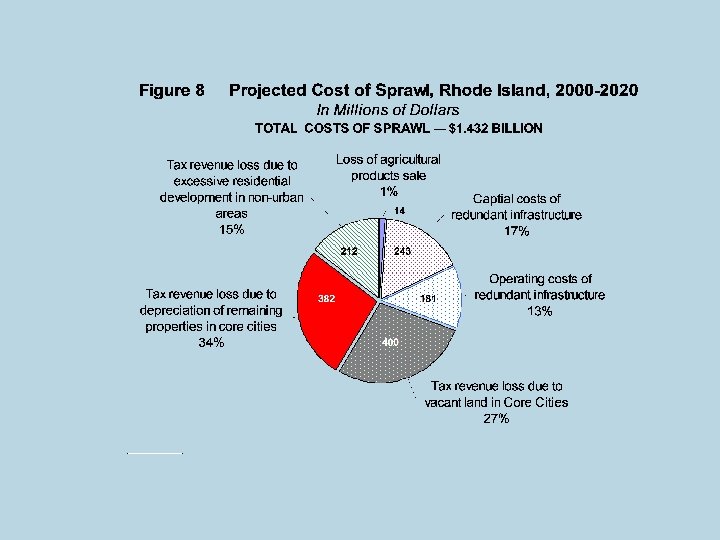
Fiscal Impacts on Urban Centers l Lost Tax Revenue – Estimated loss in assessed valuations: $1. 3 billion – 1998: 934 acres of vacant lots in Providence 8% of citywide acreage – 1999: 560 vacant buildings in Providence

Urban Fiscal Impacts l Reduced property values l Increasing tax rates

Fiscal Impact on suburban and rural towns l Increased taxes due to: – Increased cost of community services due to amount of growth – Increased cost of community services due to pattern of growth

Other Impacts l Increased motor vehicle usage = negative environmental impacts Increased storm water runoff from roads and parking lots l Increased auto emissions l

Calculating the Costs § Current pattern = net gain of 25, 000 new housing units from 2000 -2020 34, 000 units -- ring/suburban/rural - 9, 000 units – urban 25, 000 (RI Statewide Planning Projections)

l Alternative Core Development pattern 8, 750 new units in Urban Core and Ring 6, 250 new units in Suburban 10, 000 new units in Rural 25, 000 new units

How can communities “grow smart”? • • • Encourage growth & development in existing city and town centers Mix land uses Create a range of housing opportunities and choices Foster “walkable” close-knit neighborhoods Preserve & protect open space, farmland, & critical environmental areas Provide a variety of transportation choices

Promote a “distinctive sense of place” through preservation • Take advantage of existing community assets • Make development decisions predictable, fair and cost-effective • Encourage citizen participation in development decisions •

What Smart Growth “Is” And “Is Not” More transportation choices and less traffic Not against cars and roads Vibrant cities, suburbs and towns Not anti-suburban Wider variety of housing choices Not about telling people where or how to live Well-planned growth that improves quality of life Not against growth

www. growsmartri. com 345 South Main Street Providence, RI 02903 273 -5711 Jflaherty@growsmartri. com
- Slides: 24