
The Correlation Between DMFT and OHIS Index among
The Correlation Between DMFT and OHI-S Index among 10 -15 Years Old Children in Kosovo Luljeta Ferizi Shabani 1*, Agim Begzati 1, Fatmir Dragidella 2, Valë Hysenaj Hoxha 1, Vlorë Hysenaj Cakolli 2, Blerta Bruçi 1
INTRODUCTION ØDental caries remains a common disease among school-aged children and is thought to be increasing worldwide, especially in developing countries. The DMFT and OHI-S indexes are two of the most important quantitative factors, measuring tooth health and oral hygiene.
AIM ØThe aim of this study was to determine the correlation between DMFT and OHI-S indexes in 10 -15 years old children treated at the University Dentistry Clinical Center of Kosovo - Pediatric Dentistry Clinic.
METHODS ØThe study has been carried out during 2 years period (2013 -2014) on 695 children ( 51. 7% females and 48. 3% males), ages 10 -15 years from urban and rural areas, included in this cross-sectional study. ØEvery child was examined separately in our clinic using dental mirror and explorer. The questionnaire included their demographic data, age, gender, residence and dental status.
METHODS ØChildren’s oral health status was evaluated using the WHO caries diagnostic criteria for Decayed, Missing and Filled teeth (DMFT), and simplified oral hygiene index by Green-Vermilion (OHI-S). ØPrimary teeth present were ignored and their carious status not recorded.
STATISTICAL ANALYSIS ØMean DMFT index values were compared between boys and girls using Student's t-test and P <0. 01 was considered for statistical significance. Percentages were compared by using the chisquare test (P<0. 05). Statistical software was used for data entry (Microsoft Office Excel 2007 for Windows, Microsoft Corporation, Redmond, WA, USA) and all statistical tests were conducted using IBM SPSS sofware (ver. 20. 0; IBM, Chicago, IL, USA).
RESULTS Ø The findings of our study demonstrated that children aged 10 -15 -year-old living in the urban areas had higher prevalence of caries than those in rural areas for P<0. 01(t=2. 75; Df=639)
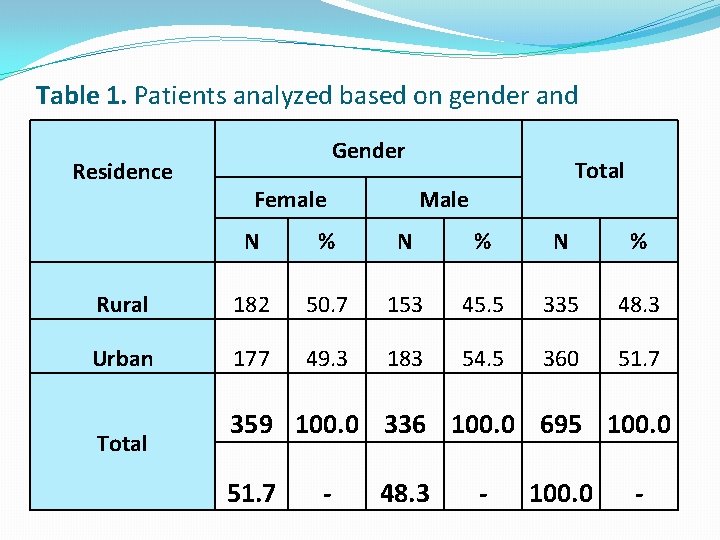
Table 1. Patients analyzed based on gender and residence Residence Gender Female Total Male N % N % Rural 182 50. 7 153 45. 5 335 48. 3 Urban 177 49. 3 183 54. 5 360 51. 7 Total 359 100. 0 336 100. 0 695 100. 0 51. 7 - 48. 3 - 100. 0 -
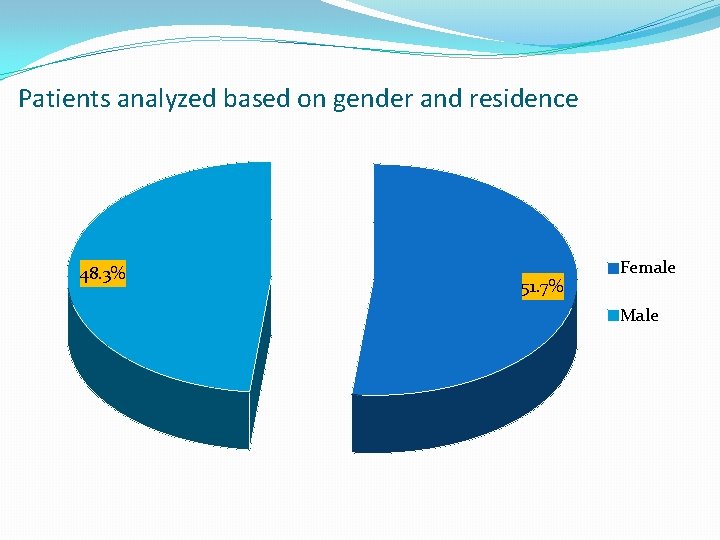
Patients analyzed based on gender and residence 48. 3% 51. 7% Female Male
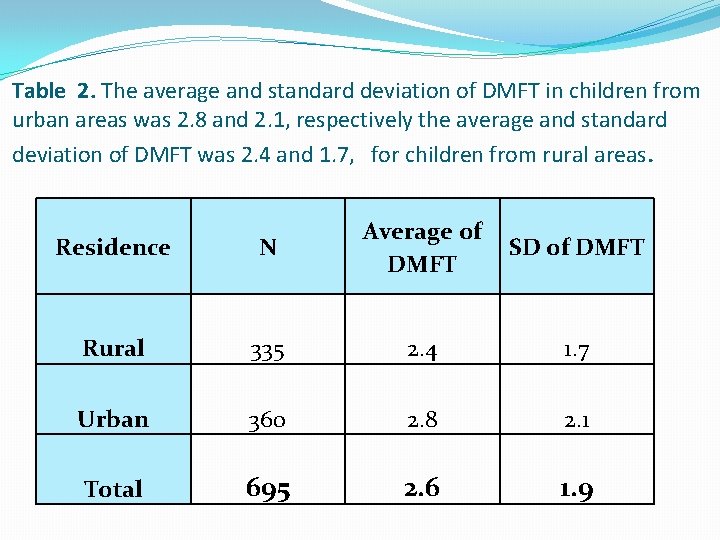
Table 2. The average and standard deviation of DMFT in children from urban areas was 2. 8 and 2. 1, respectively the average and standard deviation of DMFT was 2. 4 and 1. 7, for children from rural areas. Residence N Average of DMFT Rural 335 2. 4 1. 7 Urban 360 2. 8 2. 1 Total 695 2. 6 1. 9 SD of DMFT
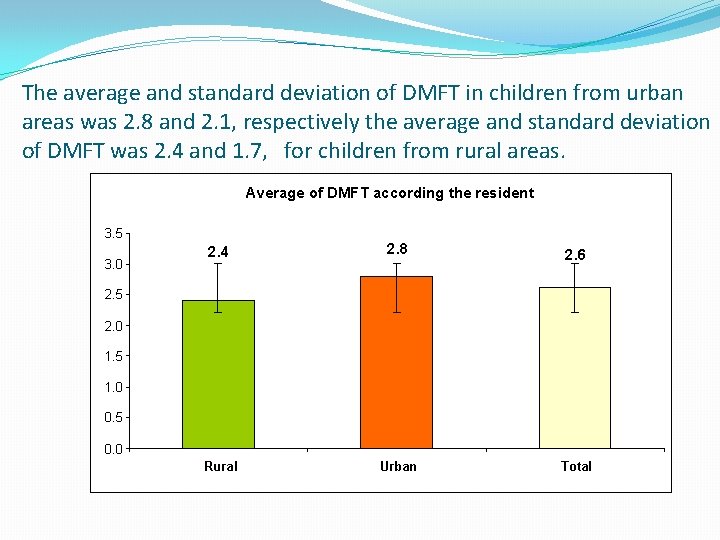
The average and standard deviation of DMFT in children from urban areas was 2. 8 and 2. 1, respectively the average and standard deviation of DMFT was 2. 4 and 1. 7, for children from rural areas. Average of DMFT according the resident 3. 5 3. 0 2. 4 2. 8 2. 6 Rural Urban Total 2. 5 2. 0 1. 5 1. 0 0. 5 0. 0
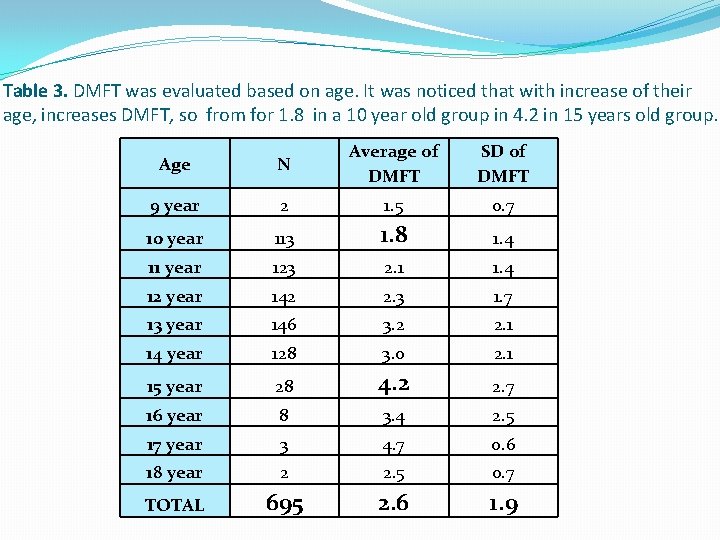
Table 3. DMFT was evaluated based on age. It was noticed that with increase of their age, increases DMFT, so from for 1. 8 in a 10 year old group in 4. 2 in 15 years old group. Age N Average of DMFT SD of DMFT 9 year 2 1. 5 0. 7 10 year 113 1. 8 1. 4 11 year 123 2. 1 1. 4 12 year 142 2. 3 1. 7 13 year 146 3. 2 2. 1 14 year 128 3. 0 2. 1 15 year 28 4. 2 2. 7 16 year 8 3. 4 2. 5 17 year 3 4. 7 0. 6 18 year 2 2. 5 0. 7 TOTAL 695 2. 6 1. 9
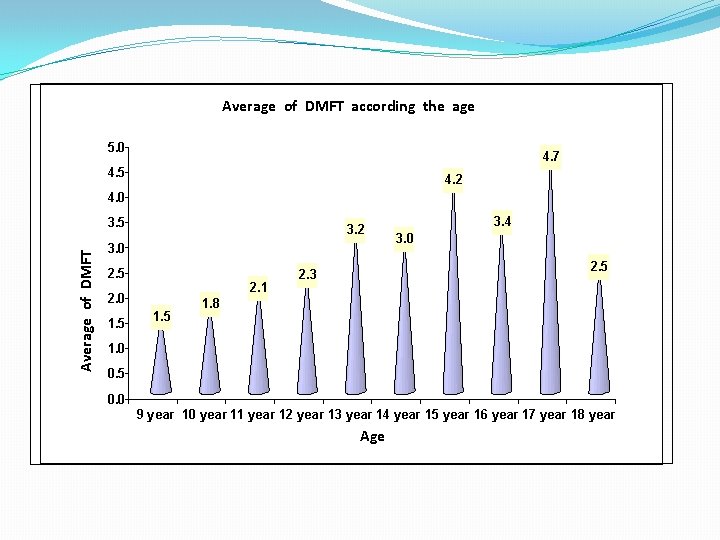
Average of DMFT according the age 5. 0 4. 7 4. 5 4. 2 4. 0 Average of DMFT 3. 5 3. 2 3. 0 2. 5 2. 1 2. 0 1. 5 3. 4 3. 0 2. 5 2. 3 1. 8 1. 0 0. 5 0. 0 9 year 10 year 11 year 12 year 13 year 14 year 15 year 16 year 17 year 18 year Age
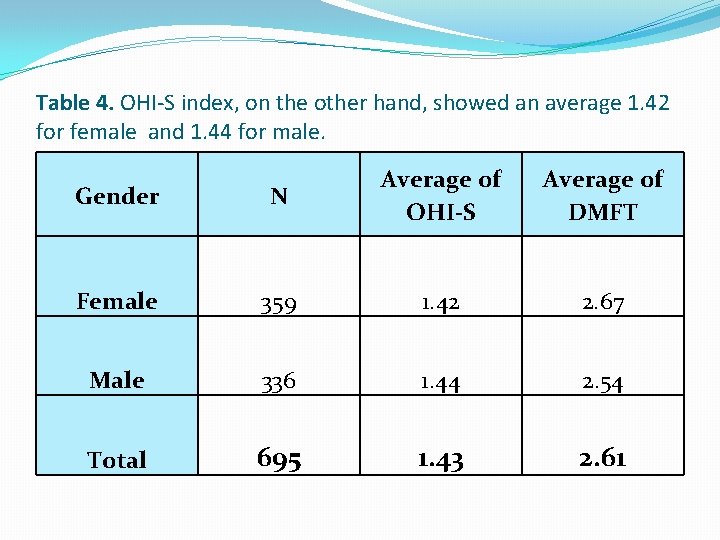
Table 4. OHI-S index, on the other hand, showed an average 1. 42 for female and 1. 44 for male. Gender N Average of OHI-S Average of DMFT Female 359 1. 42 2. 67 Male 336 1. 44 2. 54 Total 695 1. 43 2. 61
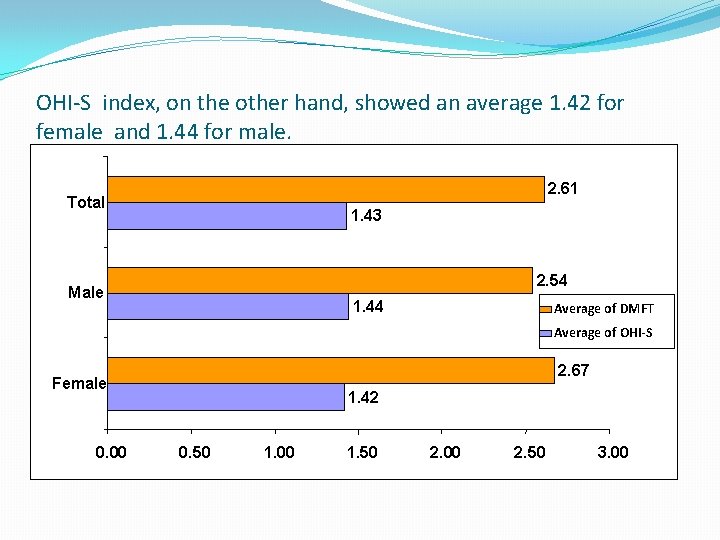
OHI-S index, on the other hand, showed an average 1. 42 for female and 1. 44 for male. 2. 61 Total 1. 43 2. 54 Male 1. 44 Average of DMFT Average of OHI-S 2. 67 Female 0. 00 1. 42 0. 50 1. 00 1. 50 2. 00 2. 50 3. 00
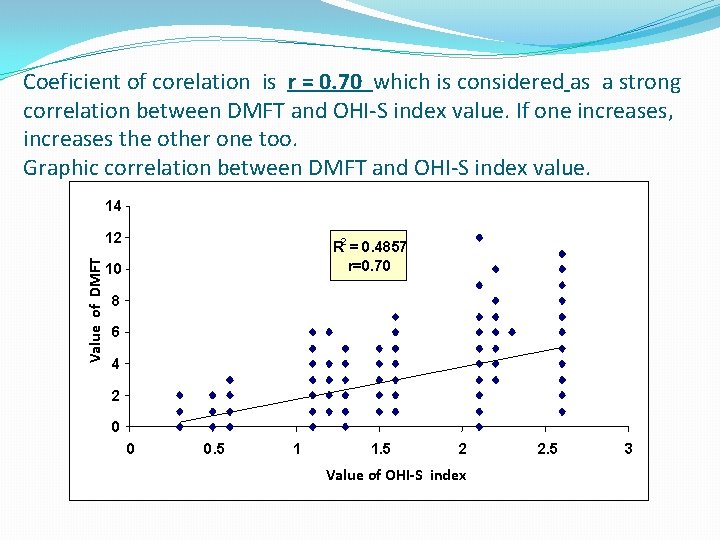
Coeficient of corelation is r = 0. 70 which is considered as a strong correlation between DMFT and OHI-S index value. If one increases, increases the other one too. Graphic correlation between DMFT and OHI-S index value. 14 Value of DMFT 12 R 2 = 0. 4857 r=0. 70 10 8 6 4 2 0 0 0. 5 1 1. 5 2 Value of OHI-S index 2. 5 3
CONCLUSION Ø Based on the result of the t-test, the correlation coefficient was r= 0. 70. We have concluded that there is a strong correlation between DMFT and OHI-S index in children 10 -15 years old, but they had high caries prevalence. Preventive approach and measures are recommended for children due to higher caries prevalence, related to their diet and poor oral health maintenance.
Thank you for your attention!
- Slides: 18