The Collaborative Radar Acquisition Field Test CRAFT Next
: Next Steps Kelvin K. Droegemeier University of")
The Collaborative Radar Acquisition Field Test (CRAFT): Next Steps Kelvin K. Droegemeier University of Oklahoma 2 nd Level II Stakeholders Workshop 26 -27 September 2002 Norman, Oklahoma NCDC

The Issues Before Us n n n Grant funding for CRAFT communication links and personnel is nearly exhausted (data will stop flowing from CAPS sometime in November) The private and academic sectors are finding value in real time Level II data A real time Level II NWS collection system – is likely more than 1 year away – may not provide the latencies and reliability needed by the private sector for the short term – may be perfectly suited for meeting all needs in the longer term n n What options exist? How can we maximize the benefits to all stakeholders: Government, industry, academia?

Options n A wide range of potential options exists, all of which require Government approval – Shut CRAFT down and wait for the NWS system n n n Timeline not yet defined Not clear the NWS system will meet non-Government user needs We likely won’t know until the system is in place If it does meet all user needs, we’re set If it does not, no alternative will exist (might take months to create) – Continue the present collaborative system (58 radars) or expand to all 120 NWS radars (lots of sub-options) – Create a stand-alone system that includes all 120 NWS WSR-88 D radars, serves as a back-up to whatever the NWS implements, and has 7 x 24 support, improved reliability, etc n n Must consider administration of system (later in talk) The ideal perhaps is a partnership among all groups, with “partnership” defined many ways

Suppose the NWS Deploys and Manages its Own Level II Distribution System (a very sensible approach)

CRAFT as a Scalable System: The Current Concept Expanded for “Operational” Deployment
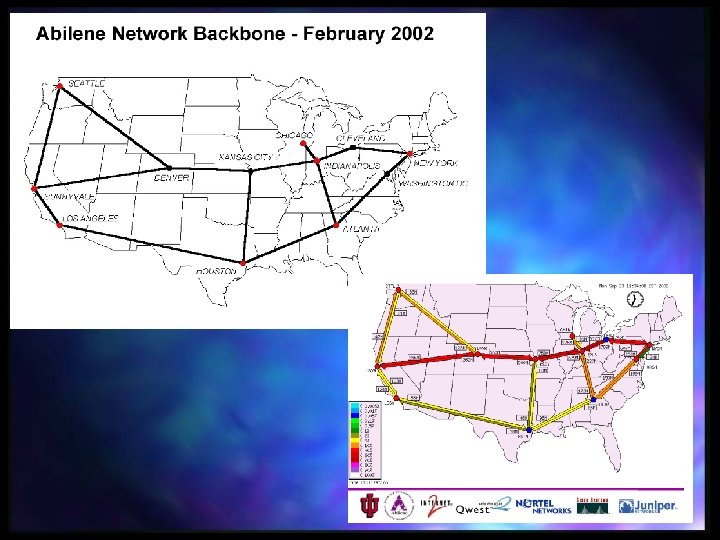

Logical Network Topology LDM Server

Logical Network Topology LDM Server OU At the moment, OU is the only server – Single points of failure (server and line from each radar)

Logical Network Topology LDM Server Universities NOAA Laboratories NOAA Joint Institutes NCAR/UCAR MIT/Lincoln Lab NWS Regional HQ, NCEP Centers, RFCs

Logical Network Topology LDM Server Universities NOAA Laboratories NOAA Joint Institutes NCAR/UCAR MIT/Lincoln Lab NWS Regional HQ, NCEP Centers, RFCs These already exist!!

Logical Network Topology via phone lines or commodity Internet Commodity Internet LDM Server Abilene Backbone (no commercial traffic)

LDM Server LDM Server

LDM Server Abilene Network LDM Server

Each LDM “Hub Site” Carries all 88 D data on Abilene “bus”-- redundancy LDM Server Abilene Network LDM Server

HUB HUB

LDM Server Abilene Network LDM Server

LDM Server Commodity Internet LDM Server Abilene Network LDM Server Commodity Internet Commodity Internet

LDM Server Commodity Internet LDM Server Abilene Network LDM Server Commodity Internet Commodity Internet

LDM Server Commodity Internet LDM Server Abilene Network LDM Server Commodity Internet Commodity Internet

LDM Server Commodity Internet LDM Server Abilene Network LDM Server Commodity Internet Commodity Internet

Commodity Internet LDM Server Abilene Network LDM Server Commodity Internet LDM Server or d te ty ca di di o De mm Co Commodity Internet LDM Server Commodity Internet Customers Commodity Internet LDM Server Private Company

LDM Server Abilene Network LDM Server

Features of this Concept n n NOAA runs its own operational ingest system but allows connections to the BDDS of each NWS radar The CRAFT configuration – Is completely scalable to more nodes or radars – Is highly redundant (each major hub server contains all of the data) – Is highly reliable (loss of a major hub has minimal impact) – Leverages existing infrastructure – Links easily to other networks (e. g. , AWIPS) – Has significant capacity for future growth (dual-pol, phased array) – Could have dual communication lines from each radar – Could serve as a backup system for the NWS

Features of this Concept n n Many variants exist May require enhancements to LDM, e. g. , multi-cast Must consider support of LDM to the commercial sector Key point is to create a national hierarchical distribution system along the lines of the current Unidata IDD

Primary Ingest Node

Relay Node

Leaf Nodes
 and Provisional Costs")
8 Scenarios (6 Detailed) and Provisional Costs

Possible Scenarios n Scenario #1: Maintain the current system of 58 radars with OU as the single ingest node – Assumptions n Line charges paid by same groups as now, at the same rates

Possible Scenarios n Scenario #1: Maintain the current system of 58 radars with OU as the single ingest node – Assumptions n Line charges paid by same groups as now, at the same rates – – – n 6 Sea Grant sites: $31 K/year 6 SRP sites $72 K/year 21 MIT sites $200 K/year 4 Florida sites $5 K/year 10 OU sites $80 K/year 11 other sites FSL, NASA, GTRI, SLC, RAP, SEA (no cost estimates available) Total leveraging is ~ $450, 000 per year

Possible Scenarios n Scenario #1: Maintain the current system of 58 radars with OU as the single ingest node – Assumptions n n n Line charges paid by same groups as now, at the same rates No significant s/w development or 7 x 24 QOS Maintain current OU staff levels (C. Sinclair at 1. 0 FTE and S. Hill at 0. 5 FTE) $20 K for h/w replacement, $10 K for travel (per year) $1 K for supplies (per year) KD, DJ, DE at 1 month each (1. 0 FTE) (per year) – Yearly cost: $355, 000 (could be reduced by shifting some existing lines to cheaper alternatives) – Advantages n n No additional h/w costs (above replacement) Continue using a proven reliable infrastructure

Possible Scenarios – Disadvantages Not all radars are included n Continue with heterogeneous communications infrastructure, latency problems n Relies on existing groups to continue paying their local costs n Little increase in QOS (i. e. , no 7 x 24) n 56 K lines will continue to fall behind in weather n Single ingest system at OU provides no redundancy n Reliance upon university for private sector missioncritical needs n No clear path to deal with data volume increase; however, this may not be critical if NWS system is available relatively soon n

Possible Scenarios n Scenario #2: Same as Scenario #1, but add the remaining 64 NWS radars – Additional assumptions n n n n New CAPS technical staff member ($40 K/year) for QOS and other work $100 K in one-time costs for PCs $200 K for one-time line installation costs and routers $50 K in travel $5 K for supplies $50 K in h/w replacement costs and hot spares 30 new lines cost average of current OU lines; rest cost $50/month based on DSL/cable modem – Year-1 cost: $1. 3 M (could be reduced by shifting some existing lines to cheaper alternatives) – Beyond Year-1: Estimate $900, 000/year
 n Continue using a")
Possible Scenarios – Advantages No additional h/w costs (above replacement) n Continue using a proven reliable infrastructure n All 120 NWS radars available n Improved QOS via 2 nd OU staff person n

Possible Scenarios – Disadvantages Not all radars are included n Continue with heterogeneous communications infrastructure, latency problems n Relies on existing groups to continue paying their local costs n Little increase in QOS (i. e. , no 7 x 24) n 56 K lines will continue to fall behind in weather n Single ingest system at OU provides no redundancy n Reliance upon university for private sector missioncritical needs n

Possible Scenarios n Scenario #3: Same as Scenario #2, but add UCAR as a second Abilene ingest node – Additional assumptions n n $100 K in computer hardware at UCAR One new UCAR technical staff member – Year-1 cost: $1. 5 M (could be reduced by shifting some existing lines to cheaper alternatives) – Beyond Year-1: Estimate $1. 2 M/year – Note: Could possibly add MIT/LL as third redundant node, but this has not been discussed with them
 n Continue using a")
Possible Scenarios – Advantages No additional h/w costs (above replacement) n Continue using a proven reliable infrastructure n All 120 NWS radars available n Improved QOS via 2 nd OU staff person n Greatly improved redundancy, reliability, latencies n

Possible Scenarios – Disadvantages Not all radars are included n Continue with heterogeneous communications infrastructure, latency problems n Relies on existing groups to continue paying their local costs n Little increase in QOS (i. e. , no 7 x 24) n 56 K lines will continue to fall behind in weather n Single ingest system at OU provides no redundancy n Reliance upon university for private sector missioncritical needs (not clear that UCAR can provide needed QOS) n
 No. Radars Ingest Nodes Communications Infrastructure QOS Yearly Cost Scenario")
Scenario Summaries (1 -3) No. Radars Ingest Nodes Communications Infrastructure QOS Yearly Cost Scenario 1 58 OU Current Heterogeneous Mix* Low $0. 36 M Scenario 2 122 OU Current Heterogeneous Mix* Med $1. 3 M (Yr 1) $0. 9 M (Yr 2) Scenario 3 122 OU & UCAR** Current Heterogeneous Mix* High $1. 5 M (Yr 1) $1. 2 M (Yr 2) * Leverages $450 K/year paid by other organizations ** Could try and add MIT/LL as third node

Possible Scenarios n Scenario #4: Same as Scenario #3, but with a national telecommunications carrier providing uniform delivery service to the additional 64 radars only – Additional assumptions n n n AT&T line costs for 2 -year contract for 64 additional radars is $850, 000/year. Mixture of T 1, DSL Note that these costs have not been negotiated and likely could be reduced substantially (might also be able to eliminate T 1 lines) Removes need for one-time installation charges and router costs Still have the costs of the 64 new LDM PCs – Yearly cost: $2. 1 M (hope this could be brought down to $1. 6 or $1. 7 M with tough negotiation)
 n Continue using a")
Possible Scenarios – Advantages No additional h/w costs (above replacement) n Continue using a proven reliable infrastructure n All 120 NWS radars available n Improved QOS via 2 nd OU staff person n Greatly improved redundancy, reliability, latencies n Uniform networking for 64 radars n QOS should be much higher (AT&T rapid response) n

Possible Scenarios – Disadvantages Not all radars are included n PARTLY heterogeneous communications infrastructure, latency problems n Relies on existing groups to continue paying their local costs n Little increase in QOS (i. e. , no 7 x 24) n 56 K lines will continue to fall behind in weather n Single ingest system at OU provides no redundancy n Reliance upon university for private sector missioncritical needs n
 No. Radars Ingest Nodes Communications Infrastructure QOS Yearly Cost Scenario")
Scenario Summaries (1 -4) No. Radars Ingest Nodes Communications Infrastructure QOS Yearly Cost Scenario 1 58 OU Current Heterogeneous Mix* Low $0. 36 M Scenario 2 122 OU Current Heterogeneous Mix* Med $1. 3 M (Yr 1) $0. 9 M (Yr 2) Scenario 3 122 OU & UCAR** Current Heterogeneous Mix* High $1. 5 M (Yr 1) $1. 2 M (Yr 2) Scenario 4 122 OU & UCAR** AT&T for New 64 Radars High $1. 6 to $2. 1 M * Leverages $450 K/year paid by other organizations ** Could try and add MIT/LL as third node

Possible Scenarios n Scenario #5: Same as Scenario #4, but with a national telecommunications carrier providing uniform delivery service to all radars – Additional assumptions n n n AT&T line costs for 2 -year contract for all radars is $1. 4 M/year. Mixture of T 1, DSL Note that these costs have not been negotiated and likely could be reduced substantially (might also be able to eliminate T 1 lines) Removes need for one-time installation charges and router costs Still have the costs of the 64 new LDM PCs – Yearly cost: $2. 8 M (hope this could be brought down to $2. 2 or $2. 3 M with tough negotiation)
 n Continue using a")
Possible Scenarios – Advantages No additional h/w costs (above replacement) n Continue using a proven reliable infrastructure n All 120 NWS radars available n Improved QOS via 2 nd OU staff person n Greatly improved redundancy, reliability, latencies n Uniform networking for ALL radars n QOS should be much higher (AT&T rapid response) n Increased bandwidth needs (e. g. , dual- pol, new VCP, ¼ km by ½ degree resolution) could be handled by the telecomm carrier “automatically” n

Possible Scenarios – Disadvantages n Not all radars are included n PARTLY heterogeneous communications infrastructure, latency problems n Relies on existing groups to continue paying their local costs n Little increase in QOS (i. e. , no 7 x 24) n 56 K lines will continue to fall behind in weather n Single ingest system at OU provides no redundancy n Reliance upon university for private sector missioncritical needs
 No. Radars Ingest Nodes Communications Infrastructure QOS Yearly Cost Scenario")
Scenario Summaries (1 -5) No. Radars Ingest Nodes Communications Infrastructure QOS Yearly Cost Scenario 1 58 OU Current Heterogeneous Mix* Low $0. 36 M Scenario 2 122 OU Current Heterogeneous Mix* Med $1. 3 M (Yr 1) $0. 9 M (Yr 2) Scenario 3 122 OU & UCAR** Current Heterogeneous Mix* High $1. 5 M (Yr 1) $1. 2 M (Yr 2) Scenario 4 122 OU & UCAR** AT&T for New 64 Radars High $1. 6 to $2. 1 M Scenario 5 122 OU & UCAR** AT&T for ALL Radars High $2. 2 to $2. 8 M * Leverages $450 K/year paid by other organizations ** Could try and add MIT/LL as third node

Other Scenarios n Scenario #6: Use NWS River Forecast Centers as points of aggregation – May make sense only if the NWS wishes to pursue a non-AWIPS collection strategy – The general CRAFT concept still could be applied n n Scenario #7: Use the Planned NWS Distribution System Scenario #8: Create a System Operated Entirely by the Private Sector (no university or UCAR involvement)
 – Must be")
Administrative Structure n Points of Reference (for the sake of argument) – Must be able to ensure 7 x 24 service (high reliability) – Latency must be as low as possible – Government receives data at no cost but could/should cost share overall expenses in light of benefits to NCDC (direct ingest for long-term archive), NCEP, FSL, NWS Offices (Level II recorders) – Educational institutions receive data at no cost – Presumably don’t want another “NIDS arrangement” n Options – – – For-profit private company University-based consortium Not-for-profit 501(c)3 University-based center (e. g. , Wisconsin for satellite data) Others?

Key Items for Discussion n n Sustaining the operation of CRAFT beyond November Establishing private sector requirements – – – n n Reliability Latency Hardware and software support Meeting private (and academic) sector needs in the short, medium and long term Administrative issues (including data access rules) Dealing with future data volumes Further analysis of system capabilities – Impact of weather on data reliability/latency – Networking simulation
- Slides: 50