The chemistry of the troposphere and stratosphere Prof


 – rapid vertical transport near")


 + O(3 P) Threshold = 242 nm O 2 O(3")


 Fast < 100 secs Fast ~ 1000 s Slow")
 J")


 Monthly October averages for ozone, 1979, 1982, 1984, 1989,")


 • Sources: • Sinks: Natural 160")


 Anthropogenic: fuel production and distribution 17; fuel consumption 49;")
: Fossil fuel combustion 21;")
 AS RESERVOIR FOR LONG-RANGE TRANSPORT OF NOx")


 Martin et")
 • Ozone is a secondary pollutant")


 estimates and ranges in 2005 (relative to 1750) for anthropogenic")


 scenarios • The A 1 storyline is")


- Slides: 85
The chemistry of the troposphere and stratosphere Prof. M. J. Pilling The University of Leeds (UK) helyett Turányi Tamás Eredeti Pilling előadások: 2009. február 23 -27 A Power. Point file-ok és a videofelvételek letölthetők: http: //garfield. chem. elte. hu/Turanyi/oktatas/Pilling. html
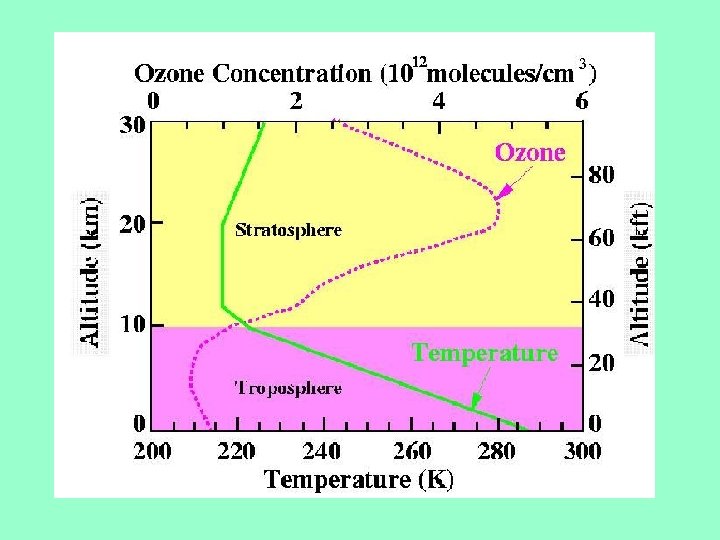
Structure of the atmosphere
Temperature and pressure variations in the atmosphere z Heating by exothermic photochemical reactions Convective heating from surface. Absorption of IR (and some VIS-UV) radiation Barometric equation p = p 0 exp(-z/Hs)
Atmospheric transport • Random motion – mixing – Molecular diffusion is slow, diffusion coefficient D ~ 2 x 10 -5 m 2 s-1 – Average distance travelled in one dimension in time t is ~ (2 Dt). – In the troposphere, eddy diffusion is more important: – Kz ~ 20 m 2 s-1. Molecular diffusion more important at v high altitudes, low p. Takes ~ month for vertical mixing (~10 km). Implications for short and long-lived species. • Directed motion – Advection – winds, e. g. plume from power station. – Occurs on • Local (e. g. offshore winds) • Regional (weather events) • Global (Hadley circulation)
Winds due to weather patterns As air moves from high to low pressure on the surface of the rotating Earth, it is deflected by the Coriolis force.
Global circulation – Hadley Cells Intertropical conversion zone (ITCZ) – rapid vertical transport near the equator.
Horizontal transport timescales
Stratospheric chemistry
O 2 O(3 P) + O(3 P) Threshold = 242 nm O 2 O(3 P) + O(1 D) Threshold = 176 nm
UV absorption spectrum of O 3 at 298 K Hartley bands Very strong absorption Small but significant absorption out to 350 nm (Huggins bands) Photolysis mainly yields O(1 D) + O 2, but as the stratosphere is very dry (H 2 O ~ 5 ppm), almost all of the O(1 D) is collisionally relaxed to O(3 P)
Integrated column - Dobson unit
Timescale Slow (J is small) Fast < 100 secs Fast ~ 1000 s Slow (activation barrier)
Altitude/km z J 3 J 1 = rate of O 2 photolysis (s-1) J 3 = rate of O 3 photolysis (s-1) Graph shows the altitude dependence of the rate of photolysis of O 3 and O 2. Note how J 1 is very small until higher altitudes (1) The ratio J 1/J 3 increases rapidly with altitude, z J 1 J 3 (2) As pressure exp (-z) then [O 2]2 [M] decreases rapidly with z This balance results in a layer of O 3
Altitude / km HOW GOOD IS THE CHAPMAN MECHANSIM? The Chapman mechanism overpredicts O 3 by a factor of 2. Something else must be removing O 3 (Or the production is too high, but this is very unlikely)
Catalytic ozone destruction The loss of odd oxygen can be accelerated through catalytic cycles whose net result is the same as the (slow) 4 th step in the Chapman cycle Uncatalysed: O + O 3 O 2 + O 2 k 4 Catalysed: X + O 3 XO + O 2 k 5 X is a catalyst XO + O X + O 2 k 6 and is reformed Net rxn: O + O 3 O 2 + O 2 X = OH, Cl, NO, Br (and H at higher altitudes) Reaction (4) has a significant barrier and so is slow at stratospheric temperatures Reactions (5) and (6) are fast, and hence the conversion of O and O 3 to 2 molecules of O 2 is much faster, and more ozone is destroyed.
The sources of X
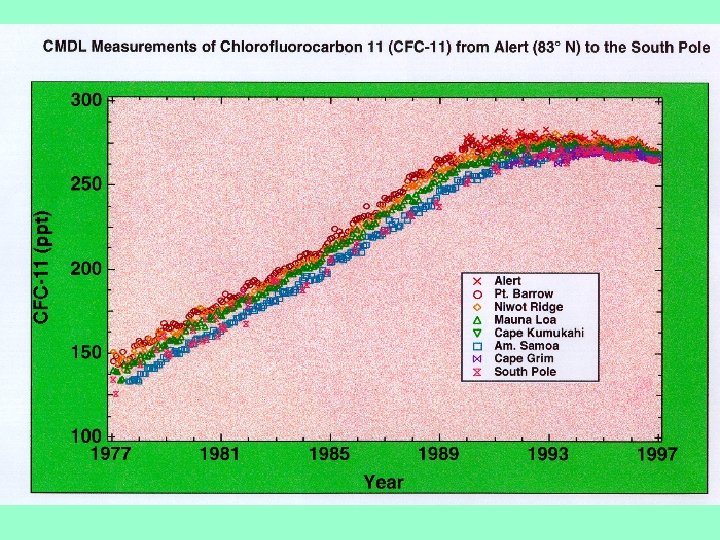
CFC’s are not destroyed in the troposphere. They are only removed by photolysis once they reach the stratosphere.
Data from NOAA CMDL Ozone depleting gases measured using a gas chromatograph with an electron capture detector (invented by Jim Lovelock) 45 years These are ground-based measurements. The maximum in the stratosphere is reached about 5 years later 100 years Why are values in the N hemisphere slightly higher?
“Do nothing” cycles Ox is not destroyed Reduces efficiency of O 3 destruction Removal of the catalyst X. Reservoir is unreactive and relatively stable to photolysis. X can be regenerated from the reservoir, but only slowly. [X] is reduced by these cycles. For Cl atom, destroys 100, 000 molecules of O 3 before being removed to form HCl
Interactions between different catalytic cycles Reservoir species limit the destruction of ozone Cl. ONO 2 stores two catalytic agents – Cl. O and NO 2
Effects of catalytic cycles are not additive due to coupling Mechanism Ozone Column (Dobson units) Chapman only (C) 644 C + NOx 332 C + HOx 392 C + Cl. Ox 300 C + NO x+ HOx + Cl. Ox 376 Coupling to NO leads to null cycles for HOx and Cl. Ox cycles Increase of Cl and NO concentrations in the atmosphere has less effect than if Cl or NO concentrations were increased separately (because Cl. Ox and NOx cycles couple, hence lowering [X])
Bromine cycle Br + O 3 Br. O + O 2 Cl + O 3 Cl. O + O 2 Br. O + Cl. O Br + Cl. OO Cl + O 2 Net 2 O 3 3 O 2 Bromine is very important for O 3 destruction in the Antarctic stratosphere where [O] is low Br and Cl are regenerated, and cycle does not require O atoms, so can occur at lower altitude Source of bromine : CH 3 Br (natural emissions from soil and used as a soil fumigant) Halons (fire retardants) Catalytic cycles are more efficient as HBr and Br. ONO 2 (reservoirs for active Br) are more easily photolysed than HCl or Cl. ONO 2 But, there is less bromine than chlorine
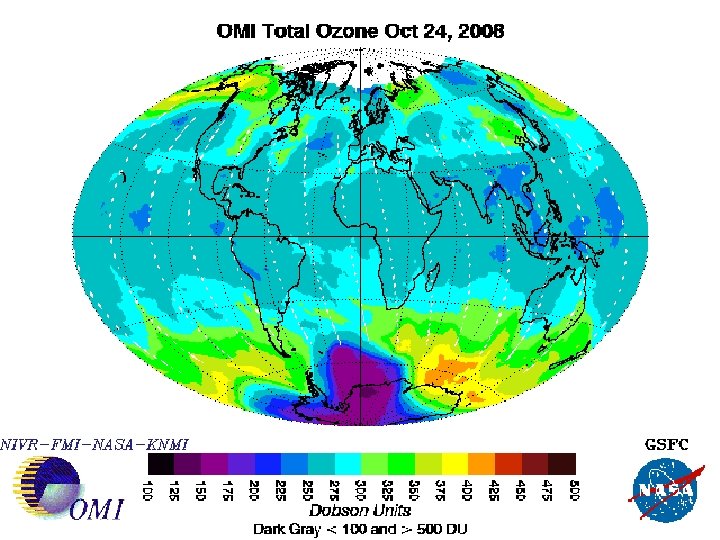
Total Ozone Mapping Spectrometer (TOMS) Monthly October averages for ozone, 1979, 1982, 1984, 1989, 1997, 2001 Dobson units (total O 3 column)
October 2000 “For the Second time in less than a week dangerous levels of UV rays bombard Chile and Argentina, The public should avoid going outside during the peak hours of 11: 00 a. m. and 3: 00 p. m. to avoid exposure to the UV rays” Ushaia, Argentina The most southerly city in the world
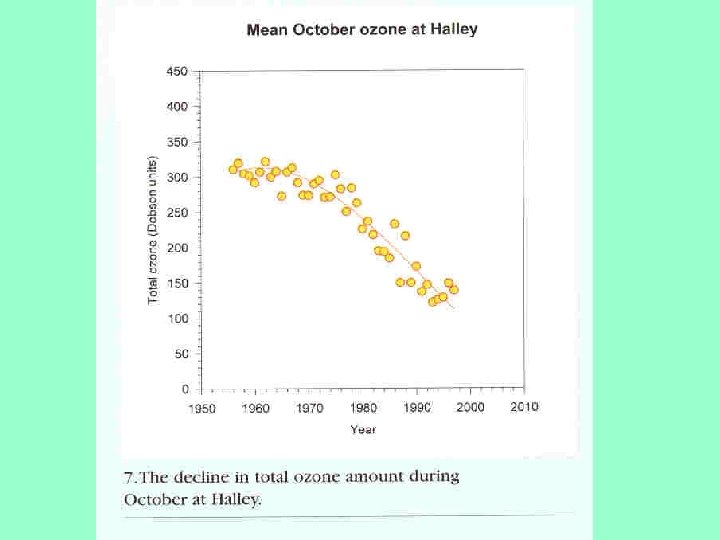
At 15 km, all the ozone disappears in less than 2 months This cannot be explained using gasphase chemistry alone US Base in Antarctica
Steps leading to ozone depletion within the Antarctic vortex Cl. O+Br. O Cl+Br+O 2
Simultaneous measurements of Cl. O and O 3 on the ER-2 Late August 1987 Still dark over Antarctica September 16 th 1987 Daylight returns The “smoking gun” experiment – proved theory was OK
Ozone loss does appear in the Arctic, but not as dramatic Above Spitzbergen Some years see significant depletion, some years not, and always much less than over Antarctica
Tropospheric chemistry
Global tropospheric chemistry Questions to be addressed: 1. Many organic compounds emitted to the atmosphere are oxidised, eventually forming CO 2 and H 2 O. What determines the oxidising capacity of the atmosphere? 2. Methane is a greenhouse gas, whose atmospheric concentration has more than doubled since the industrial revolution. What governs it concentration? 3. Tropospheric oxidation is strongly influenced by NOx, whose lifetime is ~ 1 day. How is NOx transported to regions with no NOx emissions? 4. Ozone is a secondary pollutant. In the boundary layer it affects human health, growth of vegetation and materials. It is also a greenhouse gas. What governs its concentration?
Methane oxidation CH 4 + OH CH 3 O 2 + CH 3 O + HO 2 + (+O 2) CH 3 O 2 + H 2 O NO CH 3 O + NO 2 HO 2 + HCHO NO OH + NO 2 HCHO + OH (+O 2) HO 2 + CO + H 2 O HCHO + h H 2 + CO HCHO + h (+2 O 2) 2 HO 2 + CO Note: 2 x(NO NO 2) conversions HCHO formation provides a route to radical formation.
General oxidation scheme for VOCs O 3 + h O 1 D + O 2 O 1 D + H 2 O 2 OH OH + RH (+O 2) RO 2 + H 2 O RO 2 + NO 2 + RO RO HO 2 (+R’CHO) HO 2 + NO OH + NO 2 + h NO + O; O + O 2 O 3 OVERALL NOx + VOC + sunlight ozone The same reactions can also lead to formation of secondary organic aerosol (SOA)
THE OH RADICAL: MAIN TROPOSPHERIC OXIDANT Primary source: O 3 + hn g O 2 + O(1 D) + M g O+M O(1 D) + H 2 O g 2 OH (1) (2) (3) Sink: oxidation of reduced species CO + OH g CH 4 + OH g CO 2 + H CH 3 + H 2 O HCFC + OH g H 2 O + … GLOBAL MEAN [OH] ~ 1. 0 x 106 molecules cm-3 Major OH sinks
Other oxidising species NO 3 NO 2 + O 3 NO 3 + O 2 NO 2 + NO 3 + M N 2 O 5 + M NO 3 is rapidly lost in the day by photolysis and reaction with NO ( NO 2), so that its daytime concentration is low. It is an important night time oxidant. It adds to alkenes to form nitroalkyl radicals which form peroxy radicals in the usual way. O 3 Ozone reacts with alkenes to form a carbonyl + an energised Criegee biradical. The latter can be stabilised or decompose. One important reaction product is OH: O 3 reactions with alkenes can act as a source of OH, even at night.
Global budget for methane (Tg CH 4 yr-1) • Sources: • Sinks: Natural 160 – Trop. oxidation Anthropogenic 375 by OH Total 535 – Transfer to Natural Sources: stratosphere wetlands, termites, oceans… – Uptake by soils Anthropogenic Sources: Total natural gas, coal mines, enteric fermentation, rice paddies, 445 40 30 515 Notes: 1. The rate of oxidation is k 5[CH 4][OH], where the concentrations are averaged over the troposphere 2. Concentrations of CH 4 have increased from 800 to 1700 ppb since preindustrial times 3. Methane is a greenhouse gas.
HISTORICAL TRENDS IN METHANE Historical methane trend Recent measurements at Mace Head in W Ireland. 1 mg m-3 = 0. 65 ppb NB – seasonal variation – higher in winter
GLOBAL DISTRIBUTION OF METHANE NOAA/CMDL surface air measurements • • Seasonal dependence – higher in winter than summer (maximum in NH correlates with minimum in SH). NH concentrations > SH – main sources are in NH; slow transport across ITCZ.
GLOBAL BUDGET OF CO
GLOBAL DISTRIBUTION OF CO NOAA/CMDL surface air measurements • Compare CH 4. What are the differences and why? (Rate coefficients at 298 K/10 -12 cm 3 molecule-1 s-1: CH 4: 7 x 10 -3; CO: 0. 24)
Global VOC emissions (Tg yr-1) Anthropogenic: fuel production and distribution 17; fuel consumption 49; road transport 36; chemical industry 2; solvents 20; waste burning 8, other 10. Total 142 Tg yr-1 Biogenic: isoprene 503; monoterpenes 127; other reactive VOCs 260, unreactive VOCs 260; Total 1150 Tg yr-1 Typical atmospheric lifetimes (for [OH] = 1 x 10⁶ molecule cm-3) t = 1/k[OH] CH 4 6 yr isoprene 2. 7 h CO 48 days ethane 46 days benzene 6 days ethene 30 h
Global budget for NOx • Global sources (Tg N yr-1): Fossil fuel combustion 21; Biomass burning: 12 Soils 6 Lightning 3 Ammonia oxidation 3 Aircraft 0. 5 Transport from strat 0. 1 • Coupling (rapid - ~ 1 minute in the day) NO + O 3 → NO 2 + O 2 NO 2 + Light → NO + O; O + O 2 + M → O 3 + M Also HO 2 + NO → NO 2 + OH • Loss OH + NO 2 + M → HNO 3 + M Rainout of HNO 3 • Lifetime of NOx is about 1 day. NOx is a key component in ozone formation. Can it be transported to regions where it is not strongly emitted?
PEROXYACETYLNITRATE (PAN) AS RESERVOIR FOR LONG-RANGE TRANSPORT OF NOx
NO 2 as an air pollutant. UK NOx emissions, 1970 - 2000 Recent road transport data for the UK
Spatial distribution of NOx emissions
Maps of annual mean background NO 2 concentrations UK 2001 UK 2010 Key AQ objective is annual mean of 40 mg m-3 to be achieved by 2010 (EU Directive)
Annual mean NO 2 concentrations, London 1999 1407 road links out of 1888 exceed 40 mg m-3 London 2010 670 road links out of 1888 exceed 40 mg m-3
Hungarian air quality network http: //www. kvvm. hu/olm/index. php
NO 2 in Budapest and Hungary in 2005
MAPPING OF TROPOSPHERIC NO 2 FROM THE GOME SATELLITE INSTRUMENT (July 1996) Martin et al. [2002]
Global budget for ozone (Tg O 3 yr-1) • Ozone is a secondary pollutant and is not directly omitted. • Chemical production 3000 – 4600 HO 2 + NO CH 3 O 2 + NO RO 2 + NO • Transport from stratosphere 400 – 1100 • Chemical loss O 1 D + H 2 O HO 2 + O 3 OH + O 3 others • Dry deposition 70% 20% 10% 3000 – 4200 40% 10% 500 - 1500 • Ozone is a greenhouse gas. It affects human health, plant growth and materials
Regional ozone formation
Regional air quality – ozone formation • Ozone is a greenhouse gas. It affects human health, plant growth and materials • Ozone is a secondary pollutant and is not directly emitted. • Emission of VOCs and NOx, coupled with sunlight leads to the formation of photochemical smog. • Major component is ozone. Also aerosols, nitrates … • Need to understand chemical mechanism formation in order to develop strategies and legislation for reduction of ozone concentrations. • The European limit values are linked to these aims • Is it better to control NOx or VOCs – or both?
Chemical mechanism • Initiation: OH formed from ozone photolysis at a rate POH (= 2 k 3[H 2 O]J 1[O 3]/{k 2[M] + k 3[H 2 O]} ) • Propagation OH + RH (+O 2) → RO 2 + H 2 O (R 4) RO 2 + NO → RO + NO 2 (R 5) RO + O 2 → R’CHO + HO 2 (R 6) HO 2 + NO → OH + NO 2 (R 7) • Termination HO 2 + HO 2 → H 2 O 2 (R 8) OH + NO 2 + M → HNO 3 + M (R 9) • Ozone formation O 3 is formed by NO 2 photolysis with a rate equal to the sum of the rates of reactions 5 and 7 (= v 5 + v 7)
DEPENDENCE OF OZONE PRODUCTION ON NOx AND HYDROCARBONS O 3 HOxfamily RH O 3 PHOx RO 2 NO 5 RO 4 6 7 OH NO 2 NO 9 HNO 3 “NOx- saturated” or “hydrocarbon-limited” regime O 2 HO 2 8 O 3 H 2 O 2 “NOx-limited” regime
OZONE CONCENTRATIONS vs. NOx AND VOC EMISSIONS Air pollution model calculation for a typical urban airshed NOx-limited Ridge NOxsaturated
Air quality and climate change
Impact of air pollution UK Air Quality Strategy, 2007 • “Air pollution is currently estimated to reduce the life expectancy of every person in the UK by an average of 78 months. The measures outlined in the strategy could help to reduce the impact on average life expectancy to five months by 2020, and provide a significant step forward in protecting our environment. ” • Defra estimate the health impact of air pollution in 2005 cost £ 9. 1– 21. 4 billion pa.
Timescales of ozone chemistry 1. Global chemistry. Dominated by NOx + CH 4 + sunlight. Timescales are long as are transport distances. 2. Regional chemistry. Many VOCs are emitted, e. g. over Europe. Each has its own lifetime governed by its rate constant for reaction with OH. The timescales of ozone production takes from hours to days. The transport distance for a wind speed of 5 m s-1 and a lifetime of 1 day is ~500 km. 3. Urban chemistry: high concentrations of NO from transport sources. Ozone is depressed by the reaction: NO + O 3 NO 2 + O 2
Radiative Forcing • Radiative forcing: the change in the net radiation balance at the tropopause caused by a particular external factor in the absence of any climate feedbacks. • These forcing mechanisms can be caused by: – change in the atmospheric constituents such as the increase in greenhouse gases (GHGs) – aerosols due to anthropogenic activity, – changes in other components of the Earth/atmosphere system such as changes in the surface albedo (the fraction of incoming radiation that is reflected). Albedo changes are caused, e. g. , by changesin vegetation (e. g. burn scars or agriculture).
Mechanisms of the radiative forcing due to greenhouse gases and of the direct radiative forcings due to aerosols
Global-average radiative forcing (RF) estimates and ranges in 2005 (relative to 1750) for anthropogenic GHGs and other important agents and mechanisms
Carbon dioxide and methane mixing ratios versus time (NOAA Climate Monitoring and Diagnostics Laboratory http: //www. cmdl. noaa. gov/ccgg/insitu. html)
Climate System
Evolution of models
SRES (IPCC Special Report on Emission Scenarios) scenarios • The A 1 storyline is for a future world with very rapid economic growth, global population that peaks in mid-century and declines thereafter, the rapid introduction of new and more efficient technologies and with a substantial reduction in regional differences in per capita income. Within this family are three sub-scenarios with different technological emphasis: • A 1 FI – A 1, fossil fuel intensive • A 1 T – A 1, with non-fossil energy source emphasis • A 1 B – A 1, with a balance across energy sources. • The A 2 storyline is a more pessimistic scenario, describing a very heterogeneous world based on self-reliance, regional differences in economic and technological development and continuous increase in global population. • The B 1 storyline describes a convergent world like A 1, with global population peaking in mid-century, but with rapid changes in economic structures, introduction of clean and resource-efficient technologies, emphasis on global solutions to social and environmental sustainability. • The B 2 storyline describes a world with emphasis on local solutions to social and environmental sustainability, less rapid and more diverse than in B 1 and A 1, with continuously increasing global population, but at a lower rate than A 2.
Royal Society Report on ozone over next 100 years Level of automobile emission limits in Asian countries, compared with the European. Union. Source: Clean Air Initiative for Asian cities
Impact of improved technologies in Asian countries on assessment of NOx emissions
New estimates of CO emissions
New estimates of CH 4 emissions
Predicted lobal temperature rise for different scenarios
Future summer temperatures Using a climate model simulation with greenhouse gas emissions that follow an IPCC SRES A 2 emissions scenario, Hadley Centre predict that more than half of all European summers are likely to be warmer than that of 2003 by the 2040 s, and by the 2060 s a 2003 type summer would be unusually cool 2003: hottest on record (1860) Probably hottest since 1500. 15 000 excess deaths in Europe Stott et al. Nature, December 2004
Impact of climate change on air quality - ozone
ΔO 3 from climate change Warmer temperatures &higher humidities increase O 3 destruction over the oceans O 3 + h O 1 D + O 2 O 1 D + H 2 O 2 OH O 1 D + N 2 , O 2 O 3 P But also a role from increases in isoprene emissions from vegetation &changes in lightning NOx OH+RH(+O 2) RO 2 + H 2 O RO 2 + NO RO + NO 2+ h (+O 2) NO+O 3 2020 s CLEcc 2020 s CLE
PAN – peroxy acetyl nitrate PAN is formed from reactions of the acetyl peroxy radical and NO 2: e. g. CH 3 CHO + OH (+O 2) CH 3 COO 2 + H 2 O CH 3 COO 2 + NO 2 CH 3 COO 2 NO 2 (PAN) PAN is a reservoir compound for nitrogen oxides and provides a mechanism for their transport, especially in the upper troposphere. It provides a means of carrying nitrogen oxides from polluted to less polluted regions. It is a major player in the intercontinental transport of pollutants
Heat wave in Europe, August 2003 • Monitoring stations in Europe reporting high band concentrations of ozone • >15 000 ‘excess deaths’ in France; 2000 in UK, ~30% from air pollution. • Temperatures exceeded 350 C in SE England. • What about Hungary? • How frequent will such summers be in the future?
Köszönöm a figyelmet!