The changing face of the Electricity Market in


 * Scotland Шотландия Electricité de")


: • Some Power Stations constrained “ON” to ensure")


 Воздействие Сертификатов")

 and the")
. • Funded by Department")


 Key Changes in Electricity Market in UK • April 1 st 1990:")
 • Key Changes in Electricity Market in UK • Prices to consumers")
 There is a need for • A strong Regulator with Powers to")


- Slides: 65
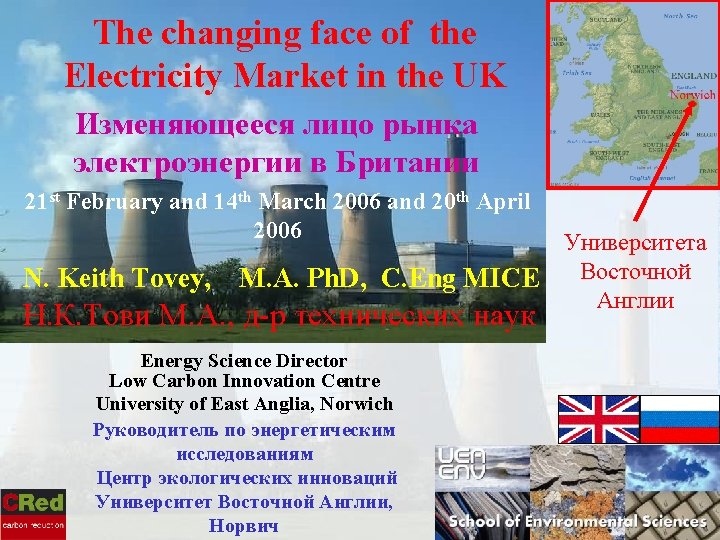
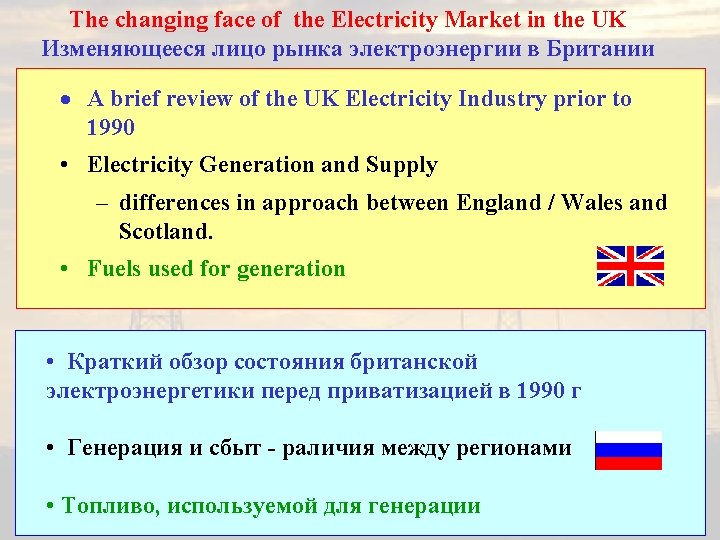
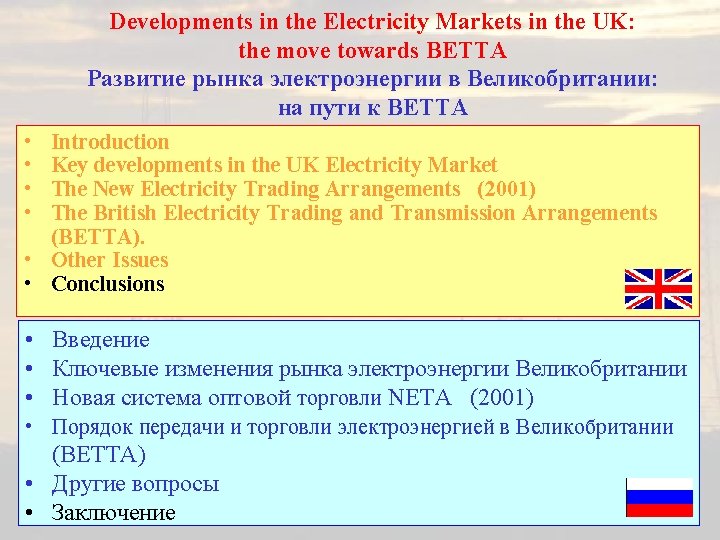
The changing face of the Electricity Market in the UK Изменяющееся лицо рынка электроэнергии в Британии • • A brief review of the UK Electricity Industry prior to 1990. The Electricity Markets in the 1990 s after Privatisation The New Electricity Trading Arrangements NETA (2001) The British Electricity Trading and Transmission Arrangements (BETTA). • The Supply of Electricity since 1990 • Conclusions • Краткий обзор состояния британской электроэнергетики перед приватизацией в 1990 г • Рынки электроэнергии в 1990 г после приватизации • Новая система оптовой торговли NЕТА (2001) • Порядок передачи и торговли электроэнергией в Великобритании (BETTA) • Сбыт электроэнергии с 1990 • Заключение
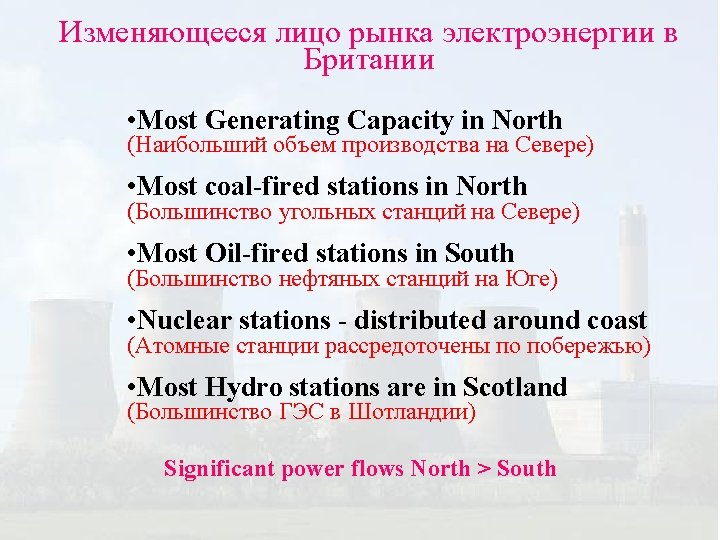
The Generation and Distribution of Electricity has always been different in Scotland compared to England Wales (Шотландия всегда отличалась от Англии и Уэльса в плане производства и распределения э/э ) Scotland (Шотландия): Scotland Шотландия Northern Ireland Северная Ирландия England Wales Англия и Уэльс Two vertically integrated companies supplying discrete areas (Две вертикально интегрированных компании, снабжающие отдельные территории) England Wales (Англия и Уэльс): One Generating Company (CEGB) and 12 Regional Electricity Suppliers (Одна генерирующая компания (CEGB) и 12 региональных поставщиков). 2000 MW Ed. F Electricité de France EDF
Scotland Шотландия Scottish Hydro Structure of Electricity Supply in early 1990 s Структура системы энергоснабжения в начале 1990 г. г. Scotland Шотландия Scottish Power Northern NORWEB England & Wales Yorkshire East Midlands Англия. MANWEB и Уэльс Midlands SWALEC SWEB • two companies две компании England Wales Англия и Уэльс 12 Regional Supply Companies 12 региональных компаний Eastern London Southern Vertical Integration Вертикальная интеграция SEEBOARD also Distributed Network Operators а также распределяющие сетевые операторы
Most Generating Capacity is in the North - most demand is in South Наибольший объем производства на Севере - потребления на Юге MW Interconnector to Scotland Generating Capacity Surplus/Deficit Избыток/дефицит объема производства +1643 on February 12 th 18: 00 +418 (февраль 12, 18: 00) +7525 +ve: generating capacity -4709 exceeding demand (производство превышает потребление) -ve: demand exceeding -1963 Interconnector to France generating capacity (потребление превышает производство)
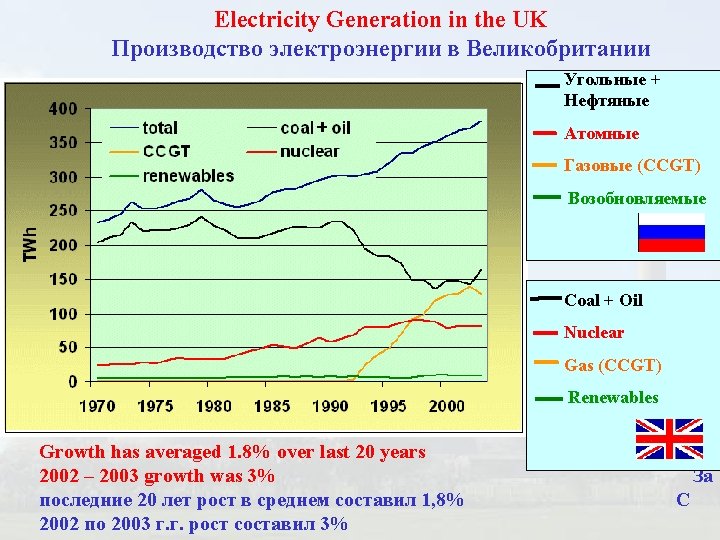
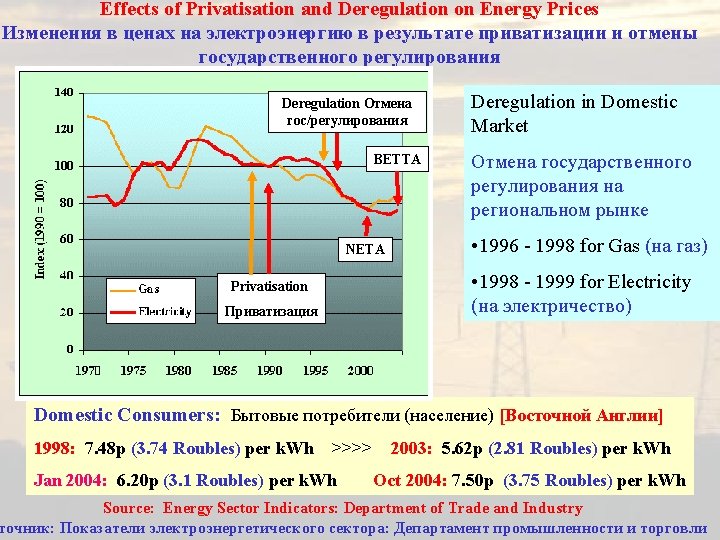
Electricity Generation - pre 1990 Производство э/э - до 1990 • Decision on how electricity was to be generated was done on a generating set basis (Производство э/э осуществлялось согласно следующим принципам: • Generating Sets to run were selected on Merit Order. • Based on Marginal Costs (Основано на маргинальных ценах) • (i. e. the fuel costs - цены на нефть) Some generating sets were run OUT of MERIT ORDER where system constraints were an issue. • Generators sold electricity to Regional Electricity Boards (Производители продавали э/э региональным министерствам э/э) • Electricity Boards sold to consumers in their Area only (Региональные министерства продавли э/э потребителям только своей области) • Prices to consumers varied between regions (Цены для потребителей варьировались по регионам)
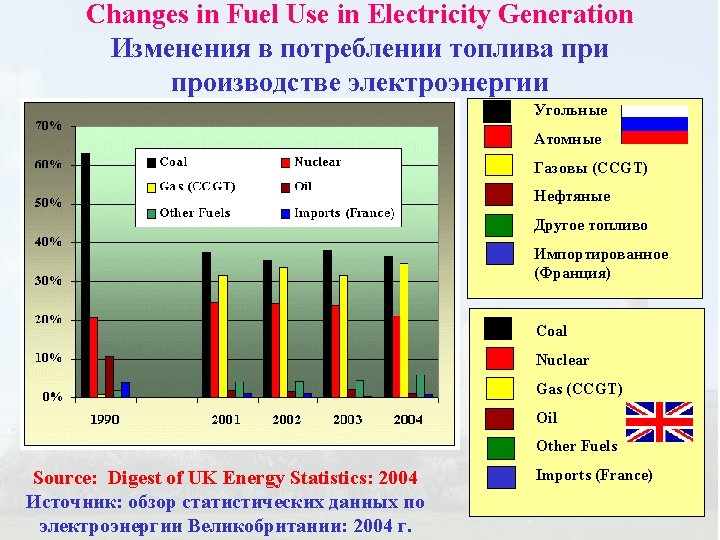
Privatisation of Electricity Supply Industry 1990 Приватизация в области энергетики в 1990 Central Electricity Generating Board Центральное • Coal (Угольные) Fired Power Stations • Oil (Нефтяные) Fired Power stations • Gas Turbine (Газовы турбины) Stations National Power Национальная энергетика Power. Gen Nuclear Electric • Hydro Stations (ГЭС) • Nuclear Stations (Атомные) National Grid Company • Transmission (Трансмиссия) Национальная сетевая компания 12 Regional Electricity Companies 12 Региональных э/э компаний 12 Regional Electricity Companies (12 Региональных э/э компаний)
Typical UK Electricity Demand in Winter 2003 and 2005
The changing face of the Electricity Market in the UK Изменяющееся лицо рынка электроэнергии в Британии • A brief review of the UK Electricity Industry prior to 1990. • The Electricity Markets in the 1990 s after Privatisation • The New Electricity Trading Arrangements NETA (2001) • The British Electricity Trading and Transmission Arrangements (BETTA). • The Supply of Electricity since 1990 • Conclusions • Краткий обзор состояния британской электроэнергетики перед приватизацией в 1990 г • Рынки электроэнергии в 1990 г после приватизации • Новая система оптовой торговли NЕТА (2001) • Порядок передачи и торговли электроэнергией в Великобритании (BETTA) • Сбыт электроэнергии с 1990 • Заключение
Scottish Nuclear Scottish Hydro Consumers Потребители Scottish Power (Атомная) * Scotland Шотландия Electricité de France Power. Gen Independents. Независимые The BNFL (Magnox) Industry. Промышленность Nuclear Electric * Eastern ** Innogy Poo l Пул England Wales Англия и Уэльс Licensed Consumers Suppliers Лицензирова нные поставщики RECs Потребители Second Tier Consumers Вторичные потребители
The changing face of the Electricity Market in the UK · The Electricity Markets in the 1990 s after Privatisation §The Electricity Pool §The bidding process - Pool Input and Pool Output · Рынки электроэнергии в 1990 г после приватизации ·Электрический пул ·Процесс подачи заявок в системе пула
The Operation of The Electricity Pool: 1990 – 2001 Функционирование Электрического Пула: 1990 -2001 • Only the Generators (>100 MW) bid into the POOL to supply electricity e. g. National Power (now Innogy), Power. Gen etc (В торгах POOL принимали участие только производители (>100 MW), таки как Национальная Энергетика (теперь Innogy), Powergen и т. д. ) • The National Grid Company published projected demands for the following day and invited bids (Национальная сетевая Компания выдавала данные по спросу на следующий день и инициировала торги) • The Generators supplied bids for each generating set in each station for each half-hour period of the following day (Производители снабжали заявки на каждой станции для каждого получасового периода следующего дня) • The NGC sorted bids to determine which generating sets would be used for each particular period, and which ones would have capacity made available (NGC классифицировало заявки по каждому периоду
1250 MW 1250 MW 10000 MW Bid from company E £ 19. 50 per MWh Bid from company D £ 19. 40 per MWh Bid from company C £ 19. 32 per MWh 32500 MW Bid from company B £ 19. 31 per MWh Bid from company A £ 19. 20 per MWh (0. 96 R / k. Wh) Range of bids from companies in range £ 18 - £ 19 per MWh 0. 90 - 0. 95 Roubles per k. Wh 10000 MW Range of bids from companies in range £ 15 - £ 18 per MWh System Marginal Price = £ 19. 31 SMP 0. 75 - 0. 9 Roubles per k. Wh 10000 MW Range of bids from companies in range <£ 15 per MWh 0. 75 Roubles per k. Wh £ 1 ~ 50 Roubles Companies up to and including B successful
The Operation of The Electricity Pool Работа электрического Пула • All Companies who were successful were paid the SMP for all units generated irrespective of what their bid was (Все Компании, успешно оплатившие SMP независимо от цели заявки ) • The bids were for the single half-hour period and fresh bids were required for all half hour periods • (Заявки были на отдельные получасовые периоды и новый запрос делался каждые пол часа) • It was possible for companies to bid £ 0 and this would guarantee that they generated and paid SMP • (Было достаточно подать нулевую заявку и это гарантировало выработку и выплату SMP) – However, if all Companies did the same they would have to generate electricity for nothing (Хотя если бы так поступали все компании электричество вырабатывалось бы в пустую) • In addition to the SMP, there was also a capacity charge relating to the generating capacity which was requested to be available
The Operation of The Electricity Pool • Capacity Charge paid to all Generators who had been requested to have capacity available. -based on formula(по формуле): LOLP * (VOLL - SMP) Loss of Load Probability Value of Lost Load VOLL: was set by the Regulator at around £ 2400 per MWH (Была установлена Регулятором примерно около 120 Roubles за 1 k. Wh) LOLP: normally a very low figure but could become significant if there was a shortfall in generating capacity (обычно незначительная цифра может стать важной если наблюдается дефицит выработки) Capacity Charge: signal to ensure sufficient capacity was available. Pool Input Price (PIP) = SMP + LOLP * (VOLL - SMP)
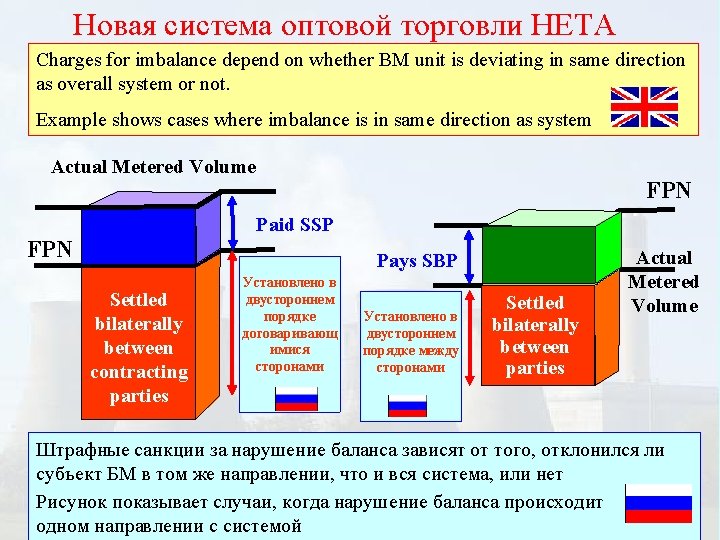
Электрический пул System Constraints (Система давления): • Some Power Stations constrained “ON” to ensure security of supply even when their bid was more expensive (Некоторые электростанции constrained “ON” обеспечить снабжение, даже в случае более дорогих заявок) • Some Power Stations constrained “OFF” even when their bid was cheaper (-excess of capacity in one region) (Некоторые электростанции constrained “OFF” обеспечить снабжение, даже в случае более дешевых заявок) • Constrained Stations paid their “Bid” Price (уплачивали их «заявочную» цену) • POOL Output Price: (POP) = Pool Input Price + Uplift • Uplift represented the additional charges incurred to National Grid Company because of System Constraints • Suppliers purchased Electricity at Pool Output Price (Поставщики закупают э/э на Пуле по цене производителя)
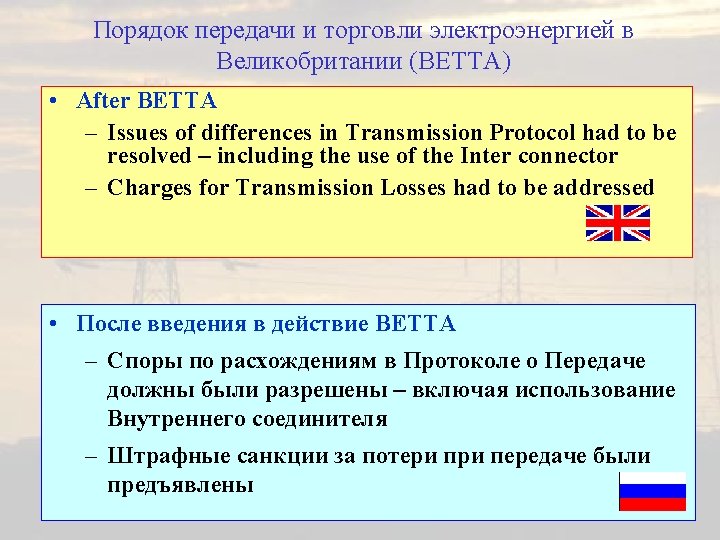
Электрический пул: A Review · · · Need for strong Regulatory Body to ensure prices were not fixed. Evidence suggested price manipulation took place in early years. Regulator required major generators to dispose of some stations. The lack of Demand Side Bidding was a weakness Charges for Transmission Losses were averaged over whole Network. • Customers in North subsidise those in South • Generators in South subsidise those in North • These issues have been partly resolved under BETTA Separate discussions relating to Distribution Charges are also under way
Changes in Regional Electricity Companies in the 1990 s 1990 • Take-over Scottish Power takes over MANWEB Scottish & Southern • Vertical Integration • n. Power acquire Midlands • Power. Gen acquire East Midlands Scottish Power United Utilities • United Utilities formed – in NORWEB area Scottish Power. Gen n. Power • Mergers Scottish & Southern c. 1998 Scottish Hydro & Southern become Scottish & Southern
The changing face of the Electricity Market in the UK Изменяющееся лицо рынка электроэнергии в Британии • A brief review of the UK Electricity Industry prior to 1990. • The Electricity Markets in the 1990 s after Privatisation • The New Electricity Trading Arrangements NETA (2001) • The British Electricity Trading and Transmission Arrangements (BETTA). • The Supply of Electricity since 1990 • Conclusions • Краткий обзор состояния британской электроэнергетики перед приватизацией в 1990 г • Рынки электроэнергии в 1990 г после приватизации • Новая система оптовой торговли NЕТА (2001) • Порядок передачи и торговли электроэнергией в Великобритании (BETTA) • Сбыт электроэнергии с 1990 • Заключение
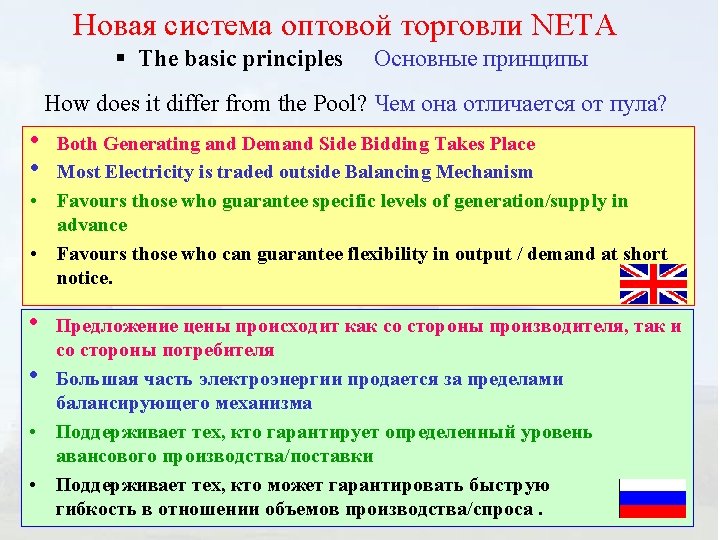
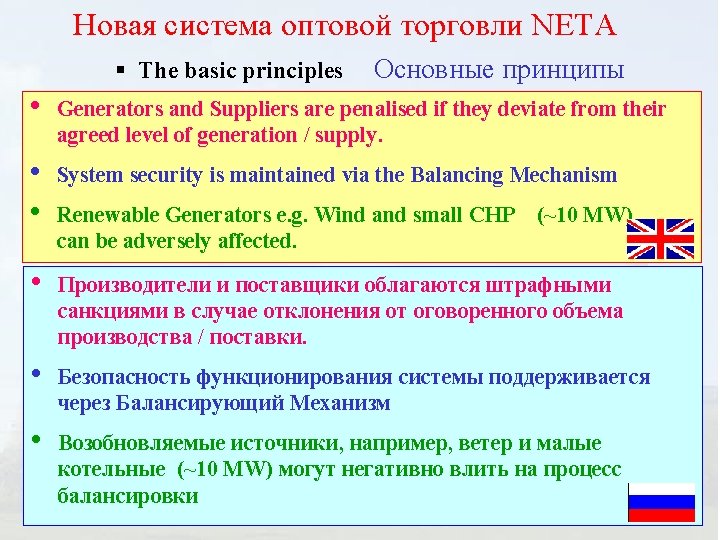
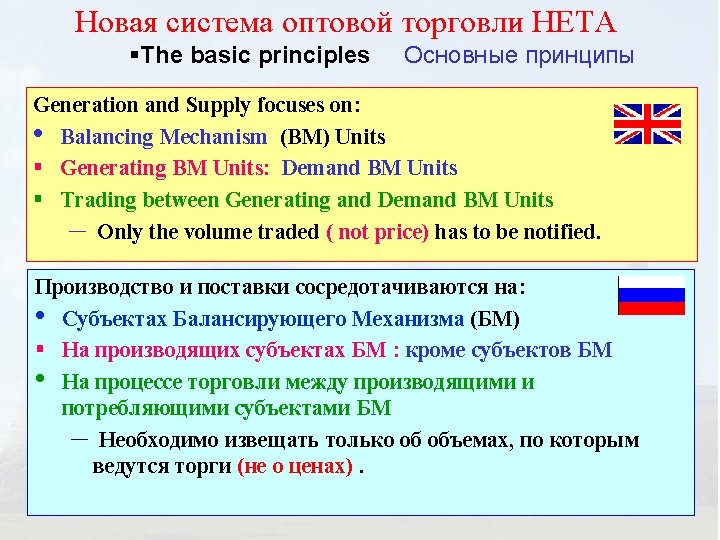
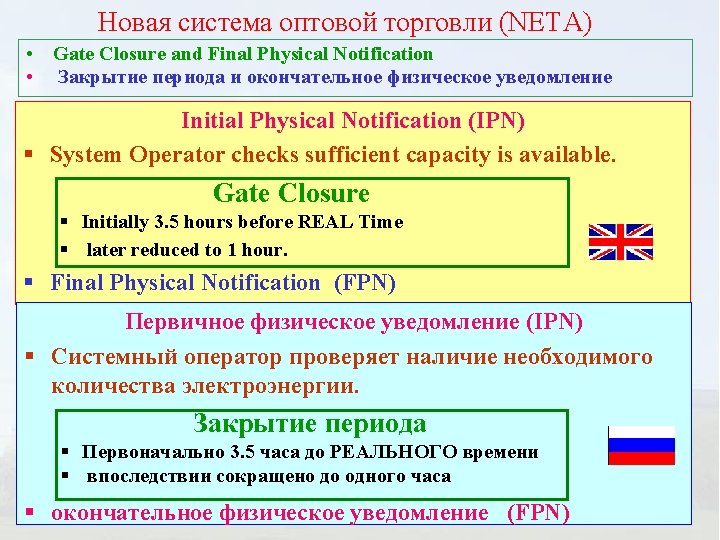
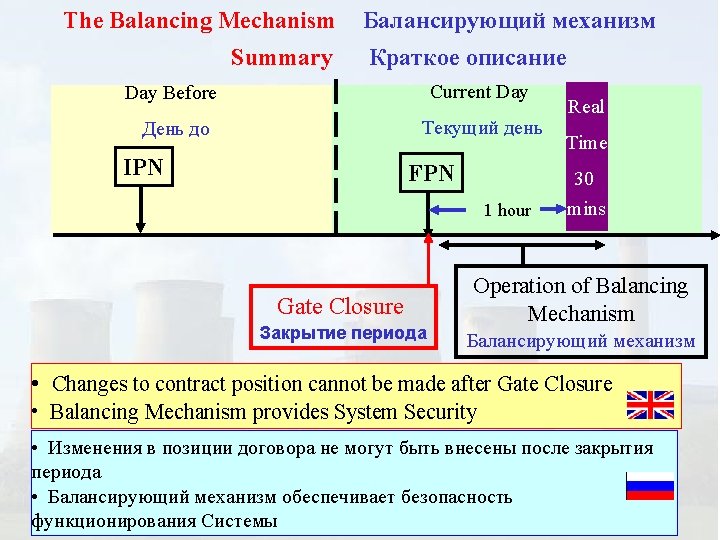
The New Electricity Trading Arrangements Новая система оптовой торговли НЕТА The Balancing Mechanism • • Балансирующий механизм To allow system to remain stable Too little electricity on the system – Generators can OFFER to INCREASE output – Suppliers can OFFER to REDUCE consumption Time OFFER FPN Time • If OFFER is agreed then Generators / Suppliers are PAID for any electricity increased / reduced under the OFFER.
The New Electricity Trading Arrangements Новая система оптовой торговли НЕТА The Balancing Mechanism • Балансирующий механизм Too much electricity on the system – Generators can BID to REDUCE output – Suppliers can BID to INCREASE consumption OFFER Bid Time FPN Time OFFER Bid FPN • If BID is agreed then Generators / Suppliers PAY for any reduction in generation / increase in demand under the BID.
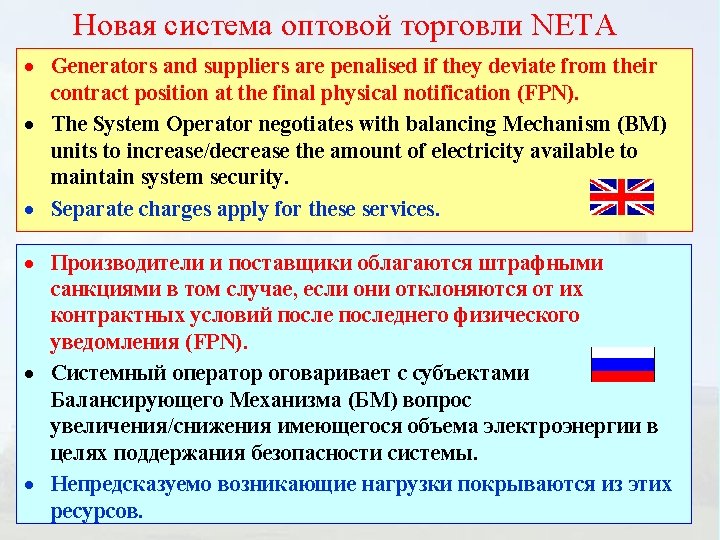
The Balancing Mechanism Балансирующий механизм Generators / Suppliers may submit OFFERs or BIDs which differ for different levels of deviation from the Final Physical Notification 50 - 100 MW: £ 50 per MWh (2. 5 Roubles per k. Wh) 25 - 50 MW: £ 30 per MWh (1. 5 Roubles per k. Wh) 0 - 25 MW: £ 20 per MWh (1 Rouble per k. Wh) FPN окончательная физическая нотификация Example of Differential Offers from a Generator National Grid Company normally accepts OFFERS / BIDS which are cheapest unless System Constraints prevent this.
The Balancing Mechanism Балансирующий механизм What happens if System Operator has got it wrong? • OFFERs / BIDs cannot be cancelled • UNDO BID removes an OFFER and is usually less than the OFFER • UNDO OFFER removes a BID and is usually more than the BID • OFFERs / UNDO BIDs [ or BIDs / UNDO OFFERs] are submitted in pairs OFFER / UNDO BID: Pair +2 OFFER / UNDO BID: Pair +1 BID / UNDO OFFER: Pair -2 FPN
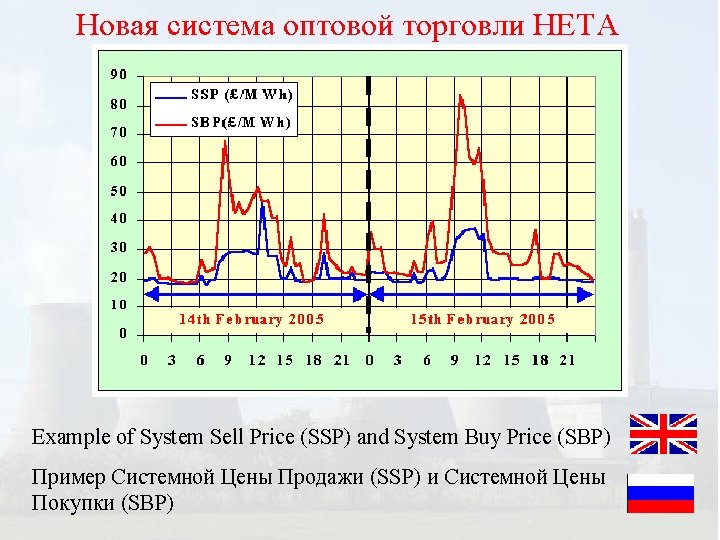
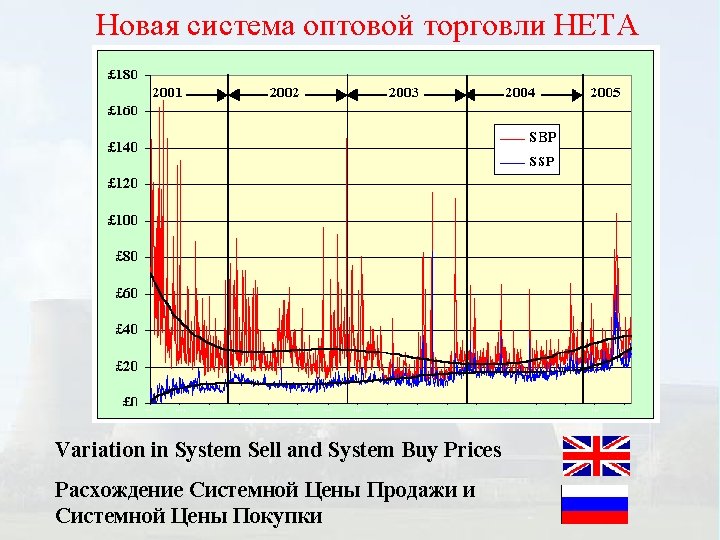
Новая система оптовой торговли НЕТА How well has it performed since starting on 27 th March 2001? In last 18 months wholesale prices have risen and are now higher than at start of NETA
2 Generator Connection Charges under BETTA Плата за подключение к генератору энергоснабжения по BETTA 1 3 5 4 8 9 7 6 A 11 10 10 12 > £ 20 per k. W B £ 15 to £ 20 per k. W C £ 10 to £ 15 per k. W D £ 5 to £ 10 per k. W E £ 0 to £ 5 per k. W F - £ 5 to £ 0 per k. W G - £ 10 to -£ 5 per k. W 14 13 15 19 21 18 20 16 17
The changing face of the Electricity Market in the UK Изменяющееся лицо рынка электроэнергии в Британии • • A brief review of the UK Electricity Industry prior to 1990. The Electricity Markets in the 1990 s after Privatisation The New Electricity Trading Arrangements NETA (2001) The British Electricity Trading and Transmission Arrangements (BETTA). • The Supply of Electricity since 1990 • Conclusions • Краткий обзор состояния британской электроэнергетики перед приватизацией в 1990 г • Рынки электроэнергии в 1990 г после приватизации • Новая система оптовой торговли NЕТА (2001) • Порядок передачи и торговли электроэнергией в Великобритании (BETTA) • Сбыт электроэнергии с 1990 • Заключение
The Supply of Electricity since 1990 Сбыт электроэнергии с 1990 Large Consumers (> 1 MW) Крупные потребители Before privatisation: • Could only purchase from the LocalRegional Electricity Company (REC) supplier in their region After privatisation • Consumers > 1 MW could purchase from ANY REC not just their own regional Company (second tier RECs). • From 1994 Consumers > 100 k. W were included in Deregulation
The Supply of Electricity since 1990 Сбыт электроэнергии с 1990 Domestic Consumers: Бытовые потребители (население) Transition Arrangements to 1998 Договоры о переходном периоде на период до 1998 Domestic Consumers did not benefit from competition until September 1998. Prices to Domestic Consumers were regulated according to the formula: RPI - X + E + F RPI is a measure of inflation X was a factor set by Regulator - initially ~ 5% but later reduced. E was an energy conservation factor whereby costs of such measures could be passed on to the consumer F was a levy designed to promote exploitation of Renewables
The Supply of Electricity since 1990 Сбыт электроэнергии с 1990 Domestic Consumers: Бытовые потребители (население) September 1998 - June 1999 Regions of England Wales were progressively Deregulated so that Domestic Consumers could purchase their electricity from any supplier. Implementation of Deregulation in stages: allowed any initial problems encountered to be sorted out. After Deregulation, the RPI - X + E + F formula no longer applied. To allow new suppliers to gain a foothold, the existing suppliers could not reduce their prices in their own area for a further transition period of a few years.
Changes in Structure of Supplies Companies in last 4 years Изменения в структуре компаний-поставщиков за последние 4 года Electricité de France (EDF) acquire London and SEEBOARD Электричество Франции (ЭФ) снабжает Лондон и Сиборд n. Power acquires Yorkshire n. Power снабжает Йоркшир Power. Gen acquires Eastern (TXU) EDF acquire SWEB Power. Gen снабжает Восточный (TXU), EDF снабжает SWEB Scottish and Southern acquire SWALEC Scottish and Southern снабжают SWALEC n. Power acquire Northern Power. Gen acquire NORWEB n. Power снабжает Северный Power. Gen снабжает NORWEB Only in Scotland has their been no change in ownership Только в Шотландии не было изменений в отношении прав собственности
Distributed Network Ownership in in 2005 2004 Distributed Владение распределительной сетью в 2005 Scottish & Southern Scottish Power United Utilities Mid American Electricité de France Western Power Distributed Network Ownership Владение распределите льной сети Power. Gen Central Networks Aquila Scottish & Southern Scottish Power n. Power. Gen Electricité de France Regional Supply Ownership Владение региональных поставщиков
Электрический пул: Supply Side Impact on Suppliers of Renewables Obligation Certificates (ROCs) Воздействие Сертификатов обязательства по использованию возобновляемых источников Since April 1 st 2002, all suppliers must provide a minimum percentage of electricity from renewable sources. • The percentage is set to increase each year to 10. 4% by 2010. • Compliance is indicated by Renewable Obligation Certificates. Failure to meet this requirement incurs a fine at the “Buy-out” price - initial 3 p per k. Wh (1. 5 Roubles per k. Wh) and rising in line with inflation - currently 3. 233 p per k. Wh. • “But-out” fines are recycled to companies in proportion to ROCs they hold - thus trading is occurring in ROCs at a surcharge price which has been as high as 5. 2 p per k. Wh (2. 6 Roubles). • Domestic prices are set to rise slightly because of this Renewable Obligation.
Metering • Specialist Metering Companies have entered market since 1998. • Siemens Energy Services is now the largest independent supplier of metering services. • It reads gas and electricity meters throughout the UK • Processes customer data and handles the payment of bills. • Siemens covers nearly 8 million households (around one-third) • It provides a metering service for • British Gas, • Powergen, • npower, • Scottish Power, • Scottish & Southern Energy.
The Regulator • OFGEM controls the prices charged by National Grid (Transco) and the Distribution Companies • These are natural monopolies. • Transmission and distribution make up around 25 -30 per cent of the average domestic bill. BUT • OFGEM also has a duty to ensure the companies can finance investment needed to rewire Britain. • Rewiring is necessary with increased use of Renewables.
Consumer Protection Energywatch: set up by the Utilities Act (2000). • Funded by Department of Trade and Industry • Funding comes from the licence fee paid by all energy companies • It looks after consumers interests and deals with complaints • Energywatch is accountable to the DTI. • Energywatch is separate from OFGEM. • Two organisations work closely together. • Relationship with OFGEM is set out in a Memorandum of Understanding.
Consumer Protection Energywatch: Some key projects currently underway by Energywatch: • Dealing with Rogue Traders who try to get people to switch suppliers • Dealing with late and inaccurate bills • In 2002/2003 Energywatch had • • • 45, 546 account, billing and other complaints (up from 37, 075)* 34, 027 transfer complaints (up from 30, 743)* 12, 960 direct selling complaints (up from 6, 991)*
Provision of Comparison Services
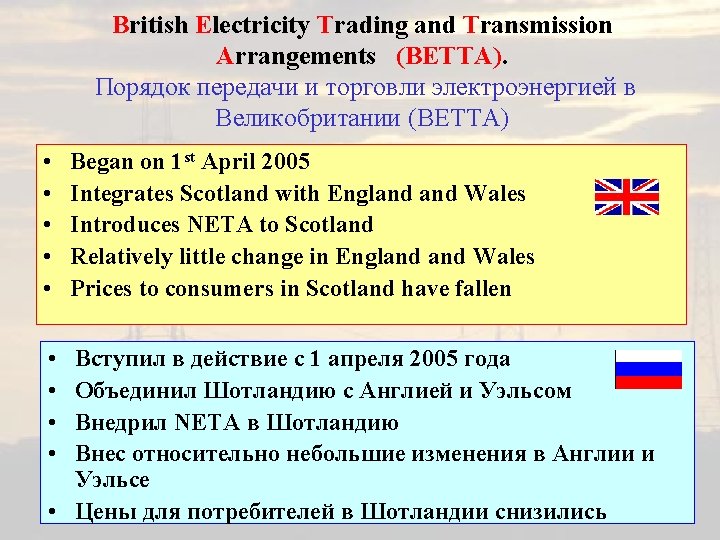
Conclusions (1) Key Changes in Electricity Market in UK • April 1 st 1990: Privatisation: Electricity POOL Established • Large Consumers benefit from Deregulation • 1994: Intermediate Consumers benefit from Deregulation • 1998 + All Consumers benefit from Deregulation • • 27 th March 2001: NETA replaced POOL 1 st April 2002: Renewable Obligation comes into force • The POOL and NETA were not used in Scotland • 1 st April 2005: BETTA extended NETA to include Scotland
Conclusions (2) • Key Changes in Electricity Market in UK • Prices to consumers fell as a result of Deregulation (up to 20% in some cases but have returned to pre-Deregulation levels) • Wholesale prices of Electricity fell by 20% after NETA, but have risen significantly in last 18 months. • Prices to consumers changed little after introduction of NETA but have recently risen in response to wholsesale price changes. • Most electricity >> 90% is traded outside Balancing Mechanism Trading • NETA favours Generators / Suppliers who can guarantee output / supply in advance • NETA favours Generators / Suppliers who can be flexible to make adjustments during Balancing Mechanism Trading.
Conclusions (3) There is a need for • A strong Regulator with Powers to curtail malpractice • A Consumer Watchdog to deal with Complaints etc. New companies are emerging in the market • Metering Companies • Distribution only Companies • Significant changes in structure • Mergers / Demergers • Vertical Integration / Splitting of functions
Developments in the Electricity Markets in the UK: the move towards BETTA Развитие рынка электроэнергии в Великобритании: на пути к ВЕТТА This presentation is available over Internet at • www 2. env. uea. ac. uk/gmmc/neta/NETA. htm • Further information on the POOL and NETA – The Changing Face of the Electricity markets in the UK [2003] – Recent Changes in the Electricity Markets in the UK [2004] – Available at the same WEB address Настоящая Презентация доступна в сети Internet по адресу • www 2. env. uea. ac. uk/gmmc/neta/NETA. htm • Дополнительная информация по POOL и NETA – Изменяющийся облик рынка электроэнергии в Великобритании [2003] – Последние изменения рынка электроэнергии Великобритании[2004] – Доступны по указанному выше WEB-адресу
The changing face of the Electricity Market in the UK Изменяющееся лицо рынка электроэнергии в Британии Some Useful WEB Sites • www. bmreports. com/ : Up to date information of NETA Market • www. ofgem. gov. uk/ : The UK Regulator • www. elexon. co. uk/ : Documents and Modifications to NETA • www. nationalgrid. com/uk/ : The System Operator • www. energywatch. org. uk/ : Energy Watch • www 2. env. uea. ac. uk/gmmc/energy/enpoint. htm the Energy Web Page at UEA giving links to many Energy Web Sites in UK and overseas. This presentation is available over Internet at www 2. env. uea. ac. uk/gmmc/neta/NETA. htm
Н. К. Тови М. А. , д-р технических наук Факультет экологических исследований Университета Восточной Англии k. tovey@uea. ac. uk Energy Science Director Low Carbon Innovation Centre School of Environmental Sciences University of East Anglia Norwich NR 4 7 TJ