The Carbohydrates Sugars Starches and Fibers Chapter 4

The Carbohydrates: Sugars, Starches, and Fibers Chapter 4

GOOD carbs

Introduction to Biochemical Energy § Brain § Runs on Glucose § Muscles § Run on Glucose § Glycogen (glucose storage in muscles) § Fat § Sources of carbohydrates § Carbs are not “fattening”

p. 108

Chemist’s View of Carbohydrates The lines representing some of the bonds and the carbons at the corners are not shown. Now the single hydrogens are not shown, but lines still extend upward or downward from the ring to show where they belong. Another way to look at glucose is to notice that its six carbon atoms are all connected. In this and other illustrations throughout this book, glucose is represented as a blue hexagon.

Another way to look at glucose is to notice that its six carbon atoms are all connected.

Now the single hydrogens are not shown, but lines still extend upward or downward from the ring to show where they belong. Fig. 4 -3 b, p. 99

Chemist’s View of Carbohydrates § Carbohydrate family § Atoms and chemical bonds § Monosaccharides § Chemical energy packs § Glucose, fructose, galactose § Disaccharides § Maltose, sucrose, lactose § Polysaccharides

The Monosacch’s § Monosaccharides – three of them § Same numbers and kinds of atoms § Differing sweetness § Glucose – blood sugar available for energy § Part of every disaccharide § Fructose § Sweetest of the sugars § Galactose § Only in a few foods

Paired Monosacch’s § Disaccharides § Pairs of monosaccharides § Maltose – two glucose units § Sucrose – glucose and fructose § Lactose – galactose and glucose § Condensation § Links two monosaccharides together § Hydrolysis § Breaks a disaccharide in two

§ Condensation- H 2 O released as 2 monosaccharides form a disaccharide § Hydrolysis- Disaccharide split into 2 monosaccharides with H going to one and OH to the other, rxn needs water

Disaccharide bond condensation hydrolysis
 Bond broken Glucose + glucose The disaccharide maltose splits into two")
Maltose (malt sugar) Bond broken Glucose + glucose The disaccharide maltose splits into two glucose molecules with H added to one and OH to the other (from the water molecule).
 Sucrose splits into two 6 -carbon sugars, glucose and fructose")
Sucrose (common white sugar) Sucrose splits into two 6 -carbon sugars, glucose and fructose
 Glucose Galactose")
Lactose (milk sugar) Glucose Galactose
 § Storage form of")
Multiple glucoses § Polysaccharides § Glycogen (your body makes it) § Storage form of energy in the animal § Bonded glucose units § Starch (you eat it) § Storage form of energy in plants § Bonded glucose units § Fiber (mostly undigestible) and only in plants

Glycogen A glycogen molecule contains hundreds of glucose units in highly branched chains. Each new glycogen molecule needs a special protein for the attachment of the first glucose (shown here in red). Starch (amylopectin) Starch (amylose) A starch molecule contains hundreds of glucose molecules in either occasionally branched chains (amylopectin) or unbranched chains (amylose).

Glycogen A glycogen molecule with branched glucose chains. Red dot is the protein for the attachment of the first glucose.

Healthy Starch and Fiber sources
 Starch (amylose) A starch molecule contains hundreds of glucose molecules in")
Starches Starch (amylopectin) Starch (amylose) A starch molecule contains hundreds of glucose molecules in either occasionally branched chains (amylopectin) or unbranched chains (amylose). Fig. 4 -8 b, p. 101

Fiber § Differ from starches § Soluble fibers – benefits § Insoluble fibers – benefits § Functional fibers § Resistant starches § Phytic acid

Starch Cellulose

Carbohydrate Digestion § Ultimate goal § Glucose for absorption and use § Hydrolysis via enzymes § Mouth § Salivary enzyme amylase § Stomach acid & protein-digesting enzymes § Role of fiber

Carbohydrate Digestion § Small intestine § Most carbohydrate digestion occurs here § Pancreatic amylase § Specific disaccharide enzymes § Maltase § Sucrase § Lactase § Large intestine § Fibers partially digested

STARCH Mouth and salivary glands The salivary glands secrete saliva into the mouth to moisten the food. The salivary enzyme amylase begins digestion: Small Salivary Amylase polysaccharides, Starch glands maltose Stomach acid inactivates salivary enzymes, halting starch digestion. Small intestine and pancreas The pancreas produces an amylase that is released through the pancreatic duct into the small intestine: Pancreatic Small polysacamylase Starch charides, maltose Then disaccharidase enzymes on the surface of the small intestinal cells hydrolyze the disaccharides into monosaccharides: Glucose + Maltose Maltase Glucose Fructose Sucrase + Glucose Galactose Lactase + Glucose Intestinal cells absorb these monosaccharides. FIBER Mouth (Liver) Stomach (Gallbladder) Mouth The mechanical action of the mouth crushes and tears fiber in food and mixes it with saliva to moisten it for swallowing. Stomach Fiber is not digested, and it delays gastric emptying. Pancreas Small intestine Fiber is not digested, and it delays absorption of other nutrients. Small intestine Large intestine Most fiber passes intact through the digestive tract to the large intestine. Here, bacterial enzymes digest fiber: Bacterial Short-chain Some enzymes fatty acids, fiber gas Fiber holds water; regulates bowel activity; and binds substances such as bile, cholesterol, and some minerals, carrying them out of the body. Fig. 4 -10, p. 104

Carbohydrate Absorption § Active transport § Glucose § Galactose § Facilitated diffusion § Fructose § Liver § Conversion of fructose and galactose

Carbohydrate Absorption

All starches and sugars get converted to glucose Monosaccharides, the end products of carbohydrate digestion, enter the capillaries of the intestinal villi. In the liver, galactose and fructose are converted to glucose. Small intestine Monosaccharides travel to the liver via the portal vein.

Carbohydrate Metabolism § Glucose is key player § Storing glucose as glycogen § Liver storage § Condensation into glycogen § Hydrolysis for release of glucose when needed § Muscle storage § Selfishly hoards glycogen

Carbohydrate Metabolism § Glucose for energy § Fuels most of body’s cells § Preferred source for brain, nerve cells, and developing red blood cells § Cellular breakdown of glucose § Making glucose from protein § Amino acid conversion § Gluconeogenesis

Carbohydrate Metabolism § Ketone bodies from fat fragments § Inadequate supply of carbohydrates § Fat metabolism shifts § Ketone body formation – starvation § Ketosis – acid-base balance § Carbohydrate needed for protein-sparing and prevention of ketosis § Using glucose to make fat

The Constancy of Blood Glucose § Steady supply of glucose in blood stream § Via food in the intestines § Via the liver’s stored glycogen § Blood glucose homeostasis § Insulin § Glucose from blood sent into cells § Glucagon & epinephrine § Bring glucose out from storage

Blood Glucose Homeostasis

Blood vessel 1 When a person eats, blood glucose rises. Intestine 4 1 4 As the body's cells use glucose, blood levels decline. Insulin 2 High blood glucose stimulates the pancreas to release insulin. 2 Glucagon 5 blood glucose 5 Low stimulates the pancreas to release glucagon into the bloodstream. Pancreas Liver 3 Insulin stimulates the uptake of glucose into cells and storage as glycogen in the liver and muscles. Insulin also stimulates the conversion of excess glucose into fat for storage. 6 stimulates 6 Glucagon liver cells to break down glycogen and release glucose into the blood. 3 7 7 Blood glucose begins to rise. Key: 3 Glucose Insulin Glucagon Glycogen Fat cell Muscle a a. The stress hormone epinephrine and other hormones also bring glucose out of storage.

The Constancy of Blood Glucose § Balancing within the normal range § BALANCED meals at regular intervals § Diabetes § Insulin is either inadequate or ineffective § Type 1 diabetes § Type 2 diabetes § Hypoglycemia § Prevalence

The Constancy of Blood Glucose § Glycemic response § Speed of glucose absorption, level of blood glucose, and return to normal glucose levels § Low glycemic response § Desired § High glycemic response § Glycemic index § Benefits § Utility

Glycemic Index of Selected Foods

Insulin’s Response § Surge of insulin levels § Glycemic effect § Factors impacting glycemic effect § Glycemic index and body weight § Insulin resistance § Fructose § Prediabetes and metabolic syndrome § Body’s insulin response

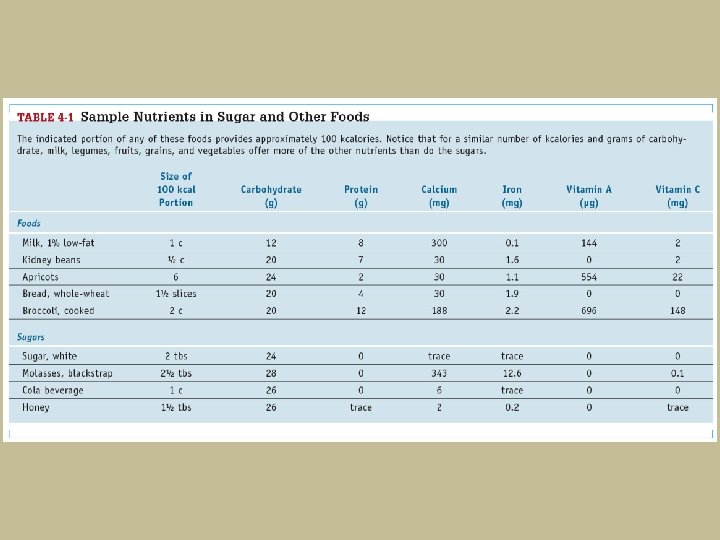
Health Effects of Sugars § Pleasure in moderate amounts § Nutrient deficiencies § Energy with few other nutrients § Discretionary kcalories § Honey § More energy per spoonful § Health benefits § Sugar sources

Sugar vs HFCS § READ “How Sugar Compares with HFCS” § READ “Cost of HFCS vs Sugar” (Both posted on class website)


Health Effects of Sugars § Dental caries § Bacteria ferment sugars producing acid § Food factors associated with tooth decay § Time of food in mouth § Sticky foods § Frequency of sugar consumption § Food choices § Factors associated with tooth decay

Dental Caries
 Bone Root canal Nerve Blood")
Enamel Caries Dentin Gum Crown Pulp (blood vessels, nerves) Bone Root canal Nerve Blood vessel Stepped Art Fig. 4 -14, p. 114

Recommended Intakes of Sugars § Dietary Guidelines § Choose and prepare foods with little added sugar § DRI § Added sugars § No more than 25% of day’s total energy § Impact on other food groups § WHO and FAO recommendations

p. 113

Alternative Sweeteners § Artificial sweeteners § Non-nutritive sweeteners § Large doses and adverse effects § Stevia – an herbal product § Generally recognized as safe (GRAS) § Sugar alcohols § Provide kcalories § Benefits and side effects

p. 115

Table 4 -2 a, p. 116

Table 4 -2 b, p. 117

Fig. 4 -15, p. 118

Health Effects of Starch and Fibers § Heart disease § Whole grains § Sources § Soluble fibers § Sources § Improving heart disease risk factors § Diet composition for reducing heart disease risk

Health Effects of Starch and Fibers § Diabetes § High-fiber foods § GI health § High-fiber foods § Ample fluids § Weight management § High-fiber foods and whole grains § Feeling of fullness

Health Effects of Starch and Fibers § Cancer § Dietary fiber and colon cancer § Fiber supplements § Sources of dietary fiber § Phytochemicals § Preventing colon cancer § Diluting, binding, and removing § Bacterial fermentation

Whole Grain Has Benefits Beyond Fiber Traditional vitamins, minerals and nutrients Fiber Lignan Resistant starch Antioxidants Plant stanols and Phytate sterols Inulin and fructooligosaccharides Whitney & Rolfes – Understanding Nutrition, 12 th Edition 56

Health Effects of Starch and Fibers § Excessive fiber § Insufficient energy or nutrient needs § Abdominal discomfort, gas, diarrhea § GI obstruction § Nutrient absorption § Dietary goals § Balance, moderation, variety

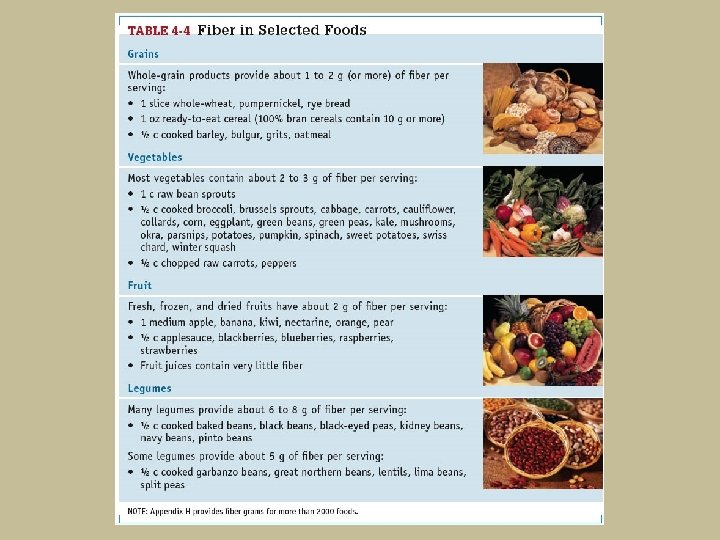
Dietary Fibers: Characteristics, Sources, & Health Effects

Recommended Intakes of Starch & Fibers § DRI for carbohydrates § 45 to 65% of energy requirement § RDA for carbohydrates § 130 grams per day § Fiber § DV: 11. 5 grams per 1000 -kcalories § DRI: 14 grams per 1000 -kcalories § No UL

From Guidelines to Groceries § Grains § 1 ounce provides about 15 g of carbohydrate § Eliminate refined grains, the less the better § Vegetables § Starch content of corn and potatoes § Fruits § Milk and milk products § Meat and meat alternatives
 60 50 40 30 20 10")
Key: Carbohydrate Fat Protein Daily intake (% kcal/day) 60 50 40 30 20 10 0 1977– 1978 1987– 1988 1994– 1996 2005– 2006 Years

From Guidelines to Groceries § Read food labels § Total carbohydrate § Starch, fibers, sugars § Wannabe whole grain products § Sugars § Added and natural sugars

Fig. 4 -16, p. 122

Will the Whole Grain Please Stand Up? 65

Benefits Beyond Fiber: Traditional Nutrients Whole Grains provide key nutrients: § § Carbohydrates B vitamins Vitamin E Trace minerals: § Iron § Zinc § Copper § Magnesium 66

Carbohydrates’ k. Calorie Contributions § Obesity and the link to carbohydrates § Total daily energy intakes have increased § Activity levels have declined § Increase in body weight § Epidemiological studies § Inverse relationship between carbs & weight § Weight loss § k. Calorie intake

Sugars’ Share in the Problem § Increase in consumption of added sugars § High-fructose corn syrup § Body fat stores § Carbohydrate cravings § Self-imposed labeling of foods § Carbohydrate addictions § Not physiological or pharmacological

Sugars’ Share in the Problem § Simple to swallow § Sweetened beverages § Appetite control § Fructose and insulin § Flaws in plausibility § Food form – liquid or solid § Energy regulation
 2500 2000 1500 Key: k. Calories 1000 1977– 1978 1987– 1988 1994–")
Energy (kcal/day) 2500 2000 1500 Key: k. Calories 1000 1977– 1978 1987– 1988 1994– 1996 2500– 2006 Years Fig. H 4 -2, p. 127
 200 175 150 Key: Men Women 125 1976– 1980 1988– 1994")
Body weight (lb) 200 175 150 Key: Men Women 125 1976– 1980 1988– 1994 Years 1999– 2002 Fig. H 4 -3, p. 127

Insulin’s Response § Surge of insulin levels § Glycemic effect § Factors impacting glycemic effect § Glycemic index and body weight § Insulin resistance § Fructose § Prediabetes and metabolic syndrome § Body’s insulin response

Lactose Intolerance § Lactase activity § Highest immediately after birth § Declines with age § Symptoms of intolerance § Causes of intolerance beyond age § Prevalence § Genetically determined

Lactose Intolerance § Dietary changes § Manage dairy consumption rather than restriction § GI bacteria § Fermented milk products § Individualized diets § Potential nutrient deficiencies § Riboflavin, vitamin D, and calcium
- Slides: 74