The Behavior of Squall Lines in Horizontally Heterogeneous

The Behavior of Squall Lines in Horizontally Heterogeneous Coastal Environments KELLY LOMBARDO AND TRISTAN KADING Speaker: 潘鈺太 Professor: 楊明仁

Outline 1. Introduction 2. Data and Method 3. Results 4. Internal gravity wave characteristics 5. Precipitation enhancement with MAUL 6. Summary
 as they")
Introduction Squall lines often respond to the stable marine atmospheric boundary layer(MABL) as they move toward the coast and offshore. Not confined to coastal regions, however, as the stable layer can progress tens to hundreds of kilometers inland as a sea breeze during certain synoptic regimes (e. g. , Tijm et al. 1999; Lombardo et al. 2016). Collide with MABL, some decay, while others remain intense(Lombardo and Colle 2012, 2013) Simulations of northeastern U. S. squall lines showed that a successful coastline crossing can be supported by the Bore-like feature resulting from the collision of the storm cold pool and MABL(Lombardo and Colle 2013)
 Experiment over east-central Florida (Gray 1991),")
Introduction During the Convection and Precipitation/Electrification (Ca. PE) Experiment over east-central Florida (Gray 1991), analysis of a collision between a less dense gust front and a denser sea breeze showed the generation of a bore that propagated ahead of the storm outflow, opposing the sea breeze motion (Wakimoto and Kingsmill 1995). A few small convective cells developed in association with the bore, though it was unable to support deep convection over the coastal waters. The goal of this study: 1. Understand the conditions that support the development of waves following the interaction between a squall line and marine layer. 2. The impact of the offshore convective forcing mechanism on storm structure and dynamics.

Data and method: a. Numerical model 1. Nonhydrostatic Cloud Model 1, CM 1, version 18. 2. 600 km (horizontal-x) X 20 km (vertical-z) The horizontal grid is 200 m. The vertical grid is stretched from 50 -m spacing below 3 km to 250 -m spacing above 10 km, resulting 148 vertical levels. 3. Left 300 KM(wooded-wetland surface ) Right 300 KM(Water Surface) -->MABL 4. Microphysics: Morrison double-moment scheme. 5. No radiation and surface heat and moisture fluxes are included to prevent the convolution of a storm’s response to the MABL and time-varying environmental parameters. (But the horizontal boundaries are open radiative to minimize reflection off the lateral edges)

Data and method b. Sounding All simulations are initialized with the Weisman and Klemp (1982) analytic sounding , as it supports long-lived, robust squall lines capable of traversing the full horizontal domain. CAPE CIN LCL LFC : 1923 J /kg : 44 J /kg : 1021 m : 1796 m Red line: limits the ability of the MABL to initiate deep convective storms. (above LCL, or it would change CAPE!) Vertical Wind Shear. 0~10 m/s From surface to 2500 m.

Data and method : Warm bubble setting Initiate at t =0. Elliptical +2 K warm bubble. Centered at 150 km from the left boundary and 1. 5 km above the surface. Horizontal and vertical radii of 10 and 1. 5 km, respectively.
 The MABL move westward as a density")
Data and method: Sensitivity Experiment setting (海洋邊界穩定層) The MABL move westward as a density current, which is characteristic of observed sea breezes in the mid-Atlantic during JJA (e. g. , Simpson et al. 1977; Simpson 1997; Galvin 1997; Lombardo et al. 2016, 2018). The collision is inland because of the movement of MABL.
")
Data and method: Vertical momentum equation 1. Dynamic Vertical Perturbation Pressure Gradient Force (DVPPGF) P’=Pd’+Pb’ (due to dynamic and density) 2. Buoyant contribution to the vertical momentum 3. Nonhydrostatic Vertical Pressure Gradient Force (NHVPGF) (1+2)

Result: Control simulation 1. Note that , there is no MABL in the control run 混 合 比 相 對 位 溫 2. Convection remains robust. 3. Potential instability values Near -12 C/km btw 1 -5 km Squall line的行進方向利於 發展對流。 浮 力
 Result: Sensitivity experiment: Time: 450 min(進入海上已 4 hr. ) Shading: mixing ratio")
混合比 (bulk) Result: Sensitivity experiment: Time: 450 min(進入海上已 4 hr. ) Shading: mixing ratio Contour: T perturbation Storms are weaker for Deep and cold MABL. 重 力 波 導 致 移 速 增 快

相對位溫 Result: Sensitivity experiment Time: 450 min Shading: Equivalent potential T Instability over water surface btw 1 -5 km, it helps storms moving forward. 即使最冷最厚的MABL, 也不改變其強度。 But below 1 km, 不適合對流. 同時減少CAPE大小。 波動訊號

Result: Sensitivity experiment 浮力 1. 冷池較冷 2. 兩者相當 Time: 450 min Shading: Buoyancy Contour: Vertical motion 3. MABL較冷 浮力的相對大小是產生波動 與否的關鍵。

CAPE/CIN Result: Sensitivity experiment Time: 450 min Shading: CAPE Contour: CIN Greatest CAPE above MABL to 1. 5 km, so shallower MABL favors Intense storms.

動力項 浮力項 DVPPGA and Buoyant contribution for Control simulation Squall line Cold pool 激發 1. Calculated at 370 min, squall line over MABL prior to decay. (10 min ave. ) 2. The vertical motion is mostly contributed from DVPPGA. 3. Confluence is important.

DVPPGA for sensitivity exp. 1. Why only choose 250 m and 1000 m? Highlight the vertical motion 2. Weaker convergence at leading edge. 3. For 1000 m deep, vertical motions are more vigorous. Weaker convergence Same buoyancy Weaker PGF, due to similar density. Two maxima 對流機制 改變

For -8 K MABL *Internal gravity waves occurs. *It is very obvious the up and down motion. (Black and Yellow contour) -8 K波動的產生

Passive tracer motion a. Release btw a. 0~500 m <-MABL b. 500~1800 m MABL~LFC (中層) c. 1800~2500 m LFC-> (低層) (高層) b. LFC=1. 5 km All the parcel ascend into upper air. c. Contour: -1 K位溫擾動(方便找出冷池位置)

Passive tracer for sensitivity experiment 原因: CAPE值在低層越來越低 38% 4. 5% <3%

Passive tracer motion *Waves are inefficient for lifting air into storm, because of its upward and dowmward motion. <2% 385 min to 400 min 0% 0% *The ingestion of MABL air into the storm would diminish the deep convective latent heating, resulting in a reduction in storm intensity and potentially decay (Alfaro 2017). *Subsequently, air successfully ascends into the storm and lift from the trailing cold pool is necessary. 隨後冷池舉升

Internal gravity wave characteristics 1. A bore is a gravity wave disturbance that can form as a density current (冷池 )encounters a stably stratified boundary layer(-8 K MABL) and propagates along the low level inversion ahead of the density current. (Haase and Smith 1984; Rottman and Simpson 1989; Koch et al. 1991). Unlike density currents, classical bores transport no mass. 2. A bore can evolve into a family of solitary waves, known as Soliton, energy can become trapped when there exists a relatively deep, weakly stratified layer above the stable boundary layer as well as a favorable curvature vertical profile in the low-level winds. (Doviak and Ge 1984; Wood and Simpson 1984; Rottman and Simpson 1989; Klemp et al. 1997; Parker 2008) 3. Cold pool (+) -8 K MABL ->Atmospheric bores->Into a family of solitary waves(a soliton)
 在本實驗: do=冷池密度流厚度 ho=MABL厚度")
Bore (Courtesy Koch 2004. ) 在本實驗: do=冷池密度流厚度 ho=MABL厚度

How it traps vertical energy -Scorer parameter 要隨高度遞減

Internal gravity wave characteristics The curvatures and magnitudes of the vertical wind profile are similar to those seen in Doviak and Ge (1984), Crook (1988), and Fulton et al. (1990). 本實驗有足夠的垂直風切產生soliton. Explain why there are internal gravity waves in -8 K MABL. If a mechanism is not present to trap the vertical propagation of wave energy, the bore will quickly diminish (Crook 1988; Koch et al. 1991; Koch and Clark 1999). *但此篇沒有特別去算scorer parameter.
 1. Directly related to MABL depth")
黑虛線: 增強開始 灰虛線: 增強結束 Precipitation enhancement (時間約20~40 min) 1. Directly related to MABL depth and temperature. 2. Increase first, but decrease finally. 3. -2 K(figure. a) is not obvious. 4. Focus on -8 K(figure. c) gray line.
 *Only occur in 1000 m")
*Explain why there is precipitation enhancement 右圖時間為碰撞前 (190 min) *Only occur in 1000 m deep MABL. *Due to the modification of the environment downstream of the squall line by the storms. (冷池使前方的環境條件改變) *Downstream of squall line, the moist absolutely unstable layer(MAUL) develop. *MAUL will make LFC lower than the depth of 1000 m MABL.
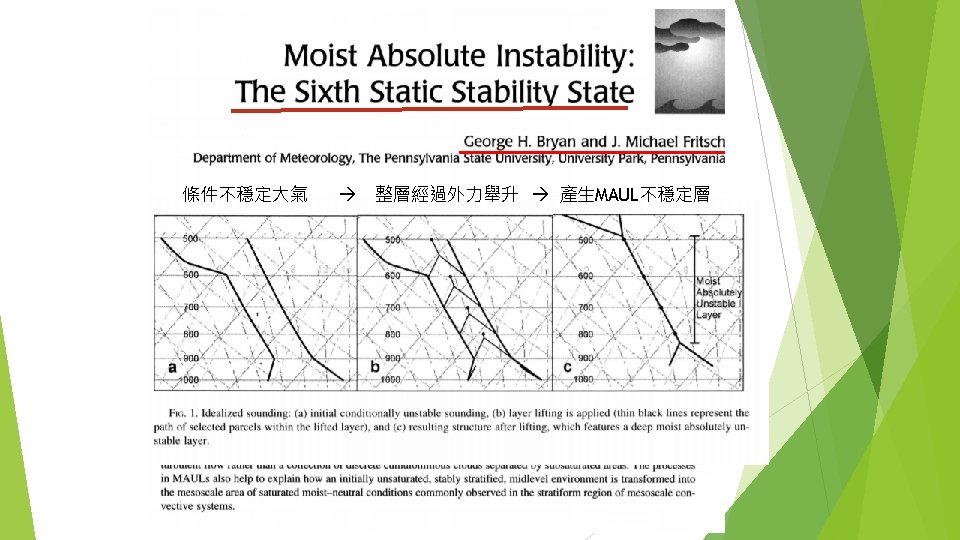

What is MAUL: 1. Saturated layer of air exhibits a lapse rate greater than moist adiabatic. (飽和環境降溫率>濕絕熱). 2. Tens of km downstream of squall line. (此實驗約距離 20~30 km) 3. Maintain more than 30 mins. In our experiment, the MAUL causes the decrease of LFC to 840 -890 m, so it can be lifted to such a height by 1000 m-MABL.

Precipitation enhancement Explain why there is a decrease in total rainfall. 1. First, MABL isn’t a good environment for convection. 2. Since the internal waves oscillate vertically, it brings low theta-e into air for a long period time. (reduce buoyancy) 3. Therefore, while internal gravity waves are a mechanism to advance storms offshore, they contribute to less intense precipitation because of their inefficiency at lifting air into the storms.
,")
Summary When the cold pool was less buoyant than the MABL (-2 K MABL), the storm remained forced by a cold pool over the stable layer, as it was over land. The convection was less intense compared to a control experiment with no MABL, in part due to the decrease in the vertical profile of instability in the presence of the stable marine layer. When the buoyancy values were equivalent (-5 K MABL), the collision between the marine layer and storm cold pool resulted in the development of a cold pool–wave hybrid. The collision of the cold pool and marine layer initiated internal gravity waves on top of the stable marine layer, specifically atmospheric bores that evolved into a soliton, when the storm outflow was more buoyant than the MABL (-8 K MABL).

Summary Waves are inefficient at lifting the unstable air into the storm. Wave motions forced air parcels downward on the backside of the waves, and lift from the trailing storm cold pool was needed for parcels to ascend into the storms updrafts. Precipitation enhancement occurred just prior to the collision of the storm cold pool and only the deepest marine layers (i. e. , 1000 m). Dynamic lift and gravity wave processes associated with the storm led to the development of a moist adiabatic unstable layer (MAUL) ahead of a system and a lowering of the level of free convection (LFC) below the top of the deep MABL, leading to an increase in accumulated precipitation. *This mechanism may indicate a greater coastal flash-flooding risk during certain observed squall-line events.
- Slides: 32