The Air Quality Scotland Website Air Quality Trends

The Air Quality Scotland Website. & Air Quality Trends for Scotland. Paul Willis March 18 th 2009

Recent Developments to the Air Quality Scotland Website.

Web Site Launched April 2 nd 2007

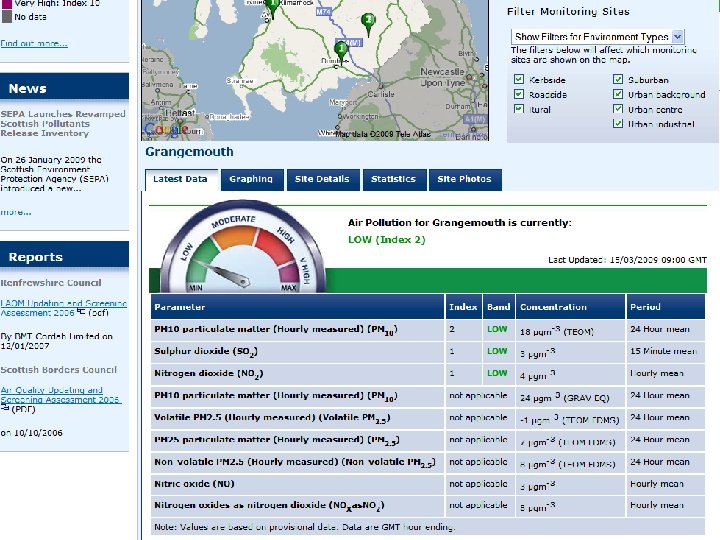
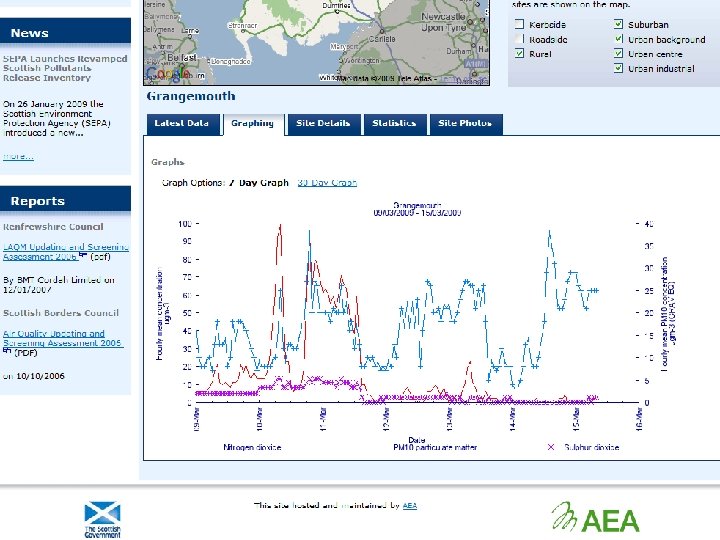
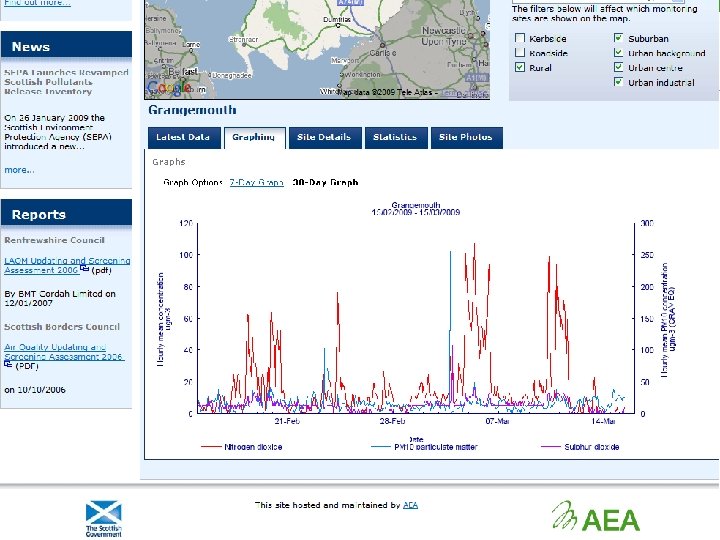
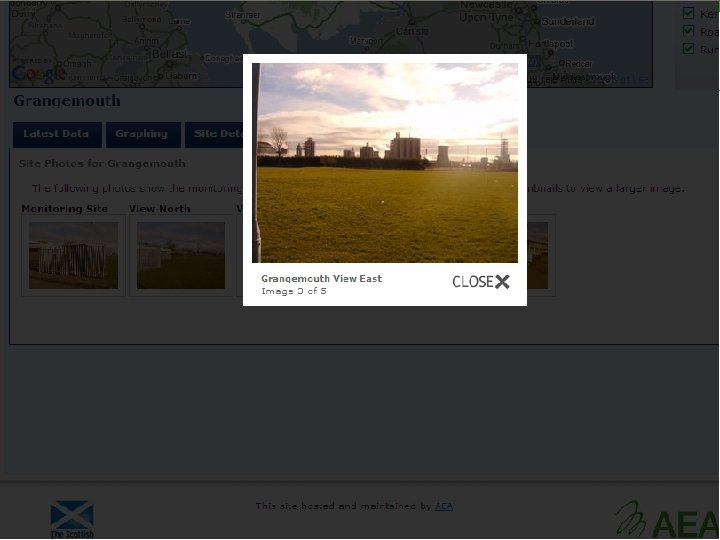
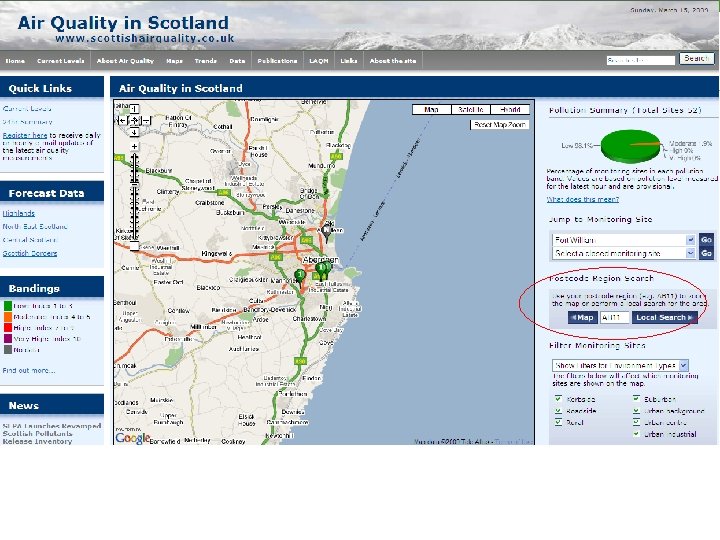
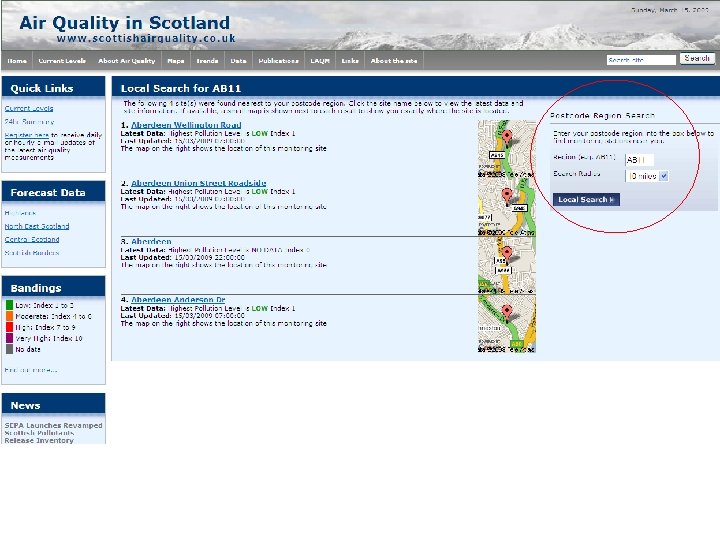
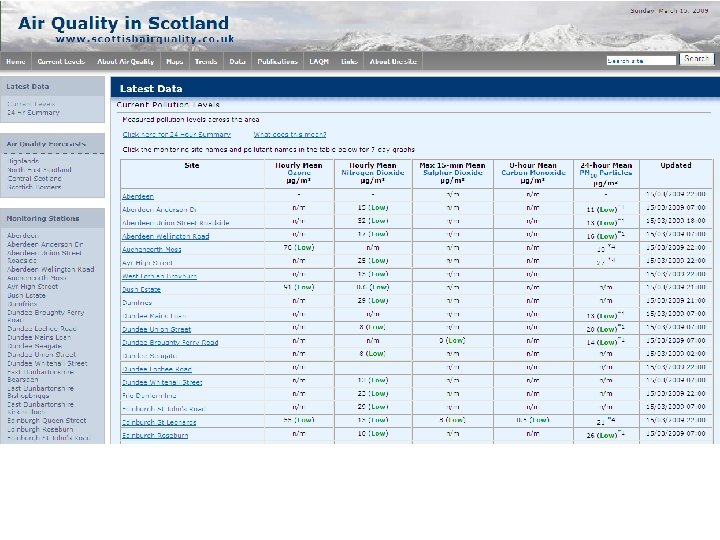
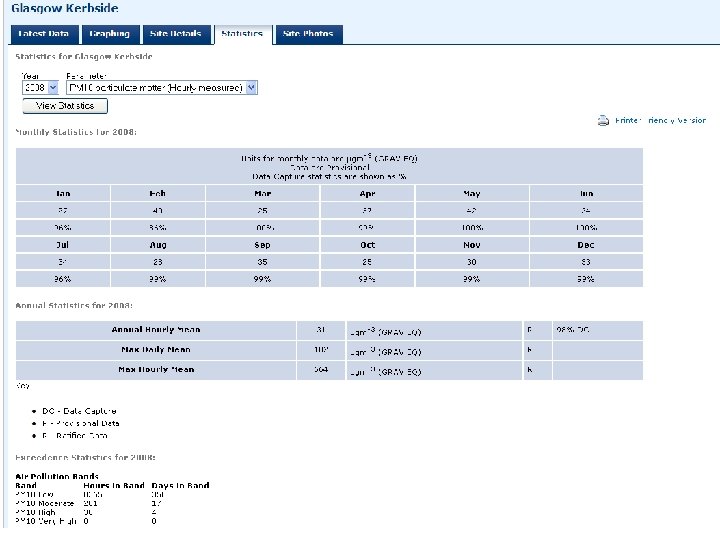
Recent New Developments • • New home page design. Google Map. TM interface to latest automatic monitoring data. Filter by pollutant or site environment. Post-code region search for: – Map zoom. – Local search list of monitoring sites. • Alternate selection through drop-down lists of open/closed sites. • Improved tabs for: – Latest data. – Graphing. – Site photos. • New tab for statistics view/print. • Monitoring site location tool.


")
Site Location Tool (Members Area)
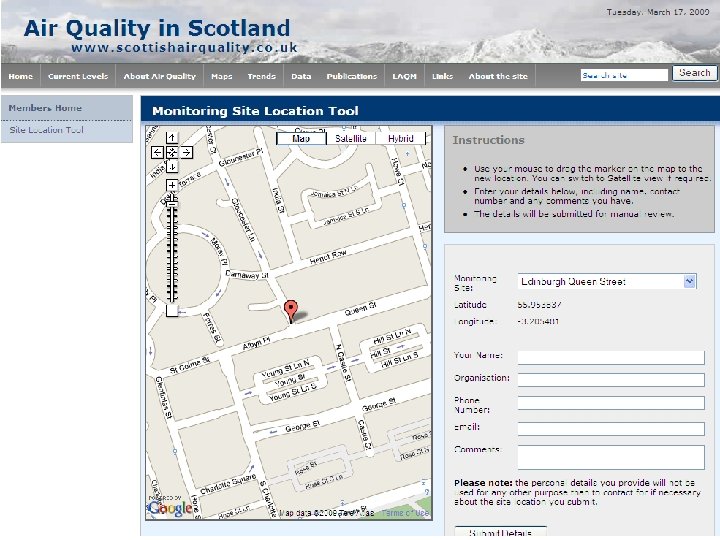
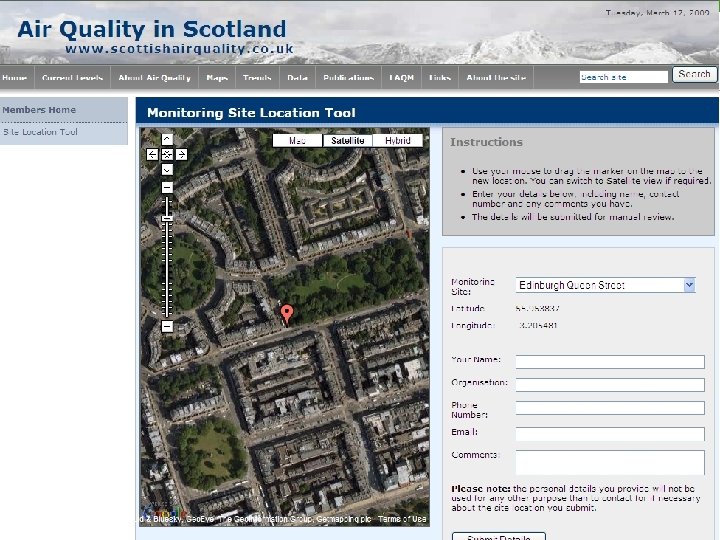

Database Updates & Site Information • New sites are added to the database once agreement is reached with the local authorities. • Site photos and co-ordinates are added as soon as AEA visit, or they are provided by the local authority. • Updates to the AURN sites are made as required (e. g. new PM instruments and/or site/instrument changes. ) • Ratified data (or any improved provisional data) load automatically to the web site from AEA’s data management software. • Statistics are automatically recalculated every night: – Daily, Monthly & Annual Means etc. – All exceedence statistics

Reminder - Air Quality Bulletins by E-mail • Users can register on the web site at http: //www. scottishairquality. co. uk/bulletin_reg. php • You can choose to receive a bulletin by e-mail at any time of the day – – Latest hour. 24 -hour summary. Including forecast. All Scotland or just your local area. • Choose to receive all the time, or just if the measurements or forecast are moderate/high. • Simple graphs are linked to the site/pollutant lists in the bulletin.

Menus for Customisable Bulletins

Bulletin Format

Local Air Quality Management • Updated monthly but please tell us if you spot any mistakes.

Future Developments? • • • Pages for younger school children? Links to emissions data? Text-only pages for dial-up or PDA users? Photo upload tool (Members Area)? More help with diffusion tube QA/QC? Know-and-respond SMS text or e-mail alerts for High Air Pollution Forecasts or Episodes ?

Air Quality Trends for Scotland.

NOx Trends Only Glasgow Kerbside till 2001

NO 2 Trends Only Glasgow Kerbside till 2001

Ozone Trends

PM 10 Trends

Any Questions ?

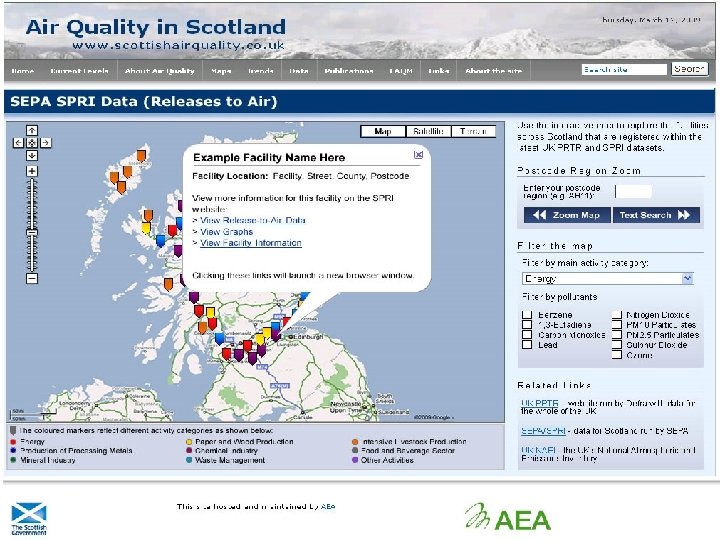

Non-automatic Monitoring Data • Still awaiting site co-ordinates from some local authorities. • Example of display of diffusion tube site locations and graphing currently under development

Glasgow University Indicators Paper • Prepared by Anna Lisa Bondi, Duncan Lee and Marian Scott of the Department of Statistics. • A review of the Scottish Trends analysis methodology and results. • A draft paper based on hourly PM 10 downloaded from the website has been provided and concludes the following: • Results are very similar to those produced by AEA (within 1 g/m 3) • Small differences are probably due to rounding method and treatment of negative TEOM data. • The indicator is robust (4 g/m 3 range) if 4 sites are used, and extremely robust (1. 4 g/m 3 range) if seven sites are used.

Usage Statistics 2008

Usage statistics 2009
- Slides: 36