
The Acoustics and Perception of American English Vowels


![Major dimensions of Vowel Articulation 1. Tongue height [e. g. , [i] (“beet”) vs.](https://slidetodoc.com/presentation_image_h/1de49d1a3d76915e5188a26aea22ec21/image-3.jpg "Major dimensions of Vowel Articulation 1. Tongue height [e. g. , [i] (“beet”) vs.")




- Slides: 46
The Acoustics and Perception of American English Vowels Hillenbrand: Vowels 1
Vowel Symbols [i] heed small i [ɪ] hid cap i, or small cap i [e] hayed, bait small e [ɛ] head epsilon [æ] had ash [ɑ] hod, pod script a (note the difference between [ɑ] and [a] [ɔ] hawed, caught open o [o] hoed, boat small o [ʊ] hood upsilon [u] who’d, boot small u [ʌ] hud, but caret or wedge or turned v [ɚ] heard schwar (you may have learned [ɝ]) [ə] schwa about, mantra
Major dimensions of Vowel Articulation 1. Tongue height [e. g. , [i] (“beet”) vs. [æ] (“bat”)] 2. Frontness or advancement [e. g. , [æ] (“pat”) vs. [ɑ] (“pot”)] 3. Lip rounding (e. g. , [u] vs. [ɑ]) (There are many secondary dimensions as well. )
Vowel Quadrilateral for English
If you are not familiar with the vowel quadrilateral – i. e. , which vowels are high, low & mid, which are front, back & central, which are rounded and which are retracted – you will need to review. If you need help finding material, let me know.
Formant Patterns for the “Non-central” (i. e. , omitting /ʌ/ and /ɚ/) Monophthongal Vowels of American English (based on Peterson & Barney averages) Hillenbrand: Vowels 6
Another Way to Visualize Formant Data for Vowels: The “Standard” F 1 -F 2 Plot Hillenbrand: Vowels 7
Hillenbrand: Vowels 8
Hillenbrand: Vowels 9
Formant Data for Men “Standard” F 1 -F 2 Plot Hillenbrand: Vowels 10
Notice that the formant values for women for a given vowel are shifted up and to the right, indicating higher values for both F 1 and F 2. This is due to the shorter vocal tracts of women vs. men. The same is true of the relationship between the formant values of children relative to women – and for the same reason; i. e. , children have shorter vocal tracts than women. Hillenbrand: Vowels 11
Q: Are the upward shifts in formants (M vs. W vs. C) also due to differences in the length and mass of the vocal folds across the three talker groups? Hillenbrand: Vowels 12
One More (apparently screwy) Way to Visualize Vowel Formant Data: The Acoustic Vowel Diagram Note that in the Acoustic Vowel Diagram: (1) the axes are reversed, (2) the numbers go backwards. Why would anyone do such a screwy thing? Hillenbrand: Vowels 13
Conventional F 1 -F 2 Plot Acoustic Vowel Diagram Hillenbrand: Vowels 14
Formant data are being plotted, but the result strongly resembles an articulatory vowel diagram, with the x axis corresponding to tongue advancement (i. e. , front vs. back) and the y axis corresponding to tongue height. This gives us a convenient way to interpret formant 15 data in articulatory terms.
What is the articulatory explanation for the differences in formant frequencies? What effect might this have on the intelligibility of the vowels spoken by the deaf talker? Data shown above are hypothetical, but this is exactly the sort of thing that has been observed in the speech of deaf talkers. For example, Monsen (1978) showed that: (a) the formant values of deaf talkers tend to be centralized relative to NH talkers, and (b) the degree of centralization is a good predictor of speech intelligibility. 16
Peterson & Barney (1952) Study conducted at Bell Labs. The 1 st big acoustic study carried out with the (at the time) recently invented sound spectrograph machine. The great Gordon Peterson – Bell Labs at the time of the study, later the Univ. of Michigan Hillenbrand: Vowels 17
Peterson & Barney (1952) This is one of the best known studies in our field, yet the design of the study is quite simple. 1. Recordings 10 vowels (i, ɪ, ɛ, æ, ɑ, ɔ, ʊ, u, ʌ, ɚ) in /h. Vd/ context (heed, hid, head, had, etc. ); 76 talkers (33 men, 28 women, 15 children) 2. Measurements: f 0, F 1 -F 3 3. Listening Study 70 listeners asked to identify each test signal as one of ten words (heed, hid, head, had, etc. ) Hillenbrand: Vowels 18
Listening Test Results Simple: The signals were highly intelligible: 94. 5% Error rate varied some across vowels; e. g. : Very low error rate for: [i] (0. 1%), [ɚ] (0. 4%), [u] (0. 8%) Higher for: [ɑ] (13. 0%) & [ɔ] (12. 1%), confused mainly with one another ___________________________ Details aside, the simple message is that the vowels were highly intelligible. Question: What information do listeners use to recognize vowels? To answer this, we need to start by 19 looking at the acoustic data.
Peterson & Barney (1952) General American English Vowel Formant Data Most striking: Lots of overlap among adjacent 20 vowels Hillenbrand: Vowels
It is mostly the case that the men occupy the lower left portion of each ellipse, the children occupy the upper right portion, and the women cluster toward the center. This is mainly due to differences in vocal- tract length. There is quite a bit of variability across individual talkers, though. (Data from Peterson & Barney, 1952. ) 21
Same Data as Previous Figure, but Plotted on a Single Graph Hillenbrand: Vowels 22
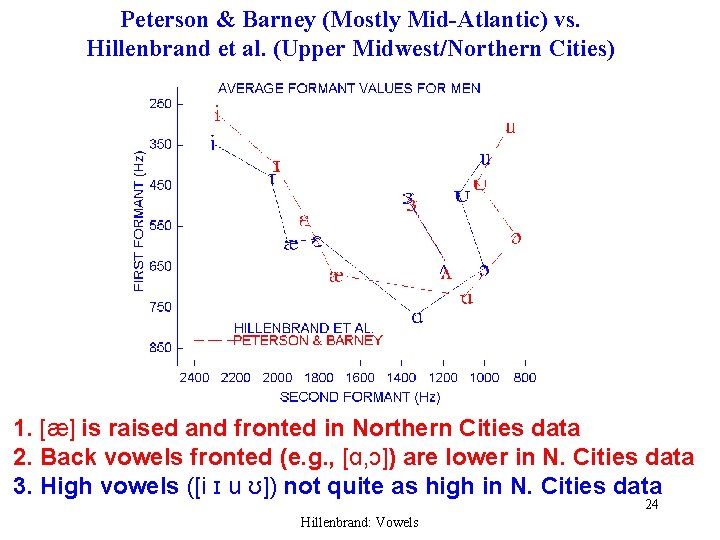
Hillenbrand, Getty, Clark & Wheeler (1995) Michigan (Northern Cities) Vowel Formant Data 1. Lots of overlap among adjacent vowels 2. [æ] and [ɛ] almost on top of one another, and out of order from Peterson & Barney (1952) Hillenbrand: Vowels 23
Peterson & Barney (Mostly Mid-Atlantic) vs. Hillenbrand et al. (Upper Midwest/Northern Cities) 1. [æ] is raised and fronted in Northern Cities data 2. Back vowels fronted (e. g. , [ɑ, ɔ]) are lower in N. Cities data 3. High vowels ([i ɪ u ʊ]) not quite as high in N. Cities data 24 Hillenbrand: Vowels
Question: How well can vowels be separated based on F 1 and F 2 alone? This is the kind of question that can be answered with a statistical pattern recognition algorithm. This is a much simpler idea than you might be thinking. Hillenbrand: Vowels 25
How a Pattern Recognizer Works Training Testing Hillenbrand: Vowels 26
Q: So, how well can vowels be separated based on F 1 and F 2 alone? A: Pretty well, but not nearly well enough to explain human listener data. ______________________________ Pattern classification results from Hillenbrand-Gayvert (1993) Automatic Human Classification Listeners Peterson & Barney vowels: 74. 9% 94. 4% Hillenbrand et al. vowels: 68. 2% 95. 4% ______________________________ Listeners must be using information to recognize vowels other than F 1 and F 2. Like what? 27 Hillenbrand: Vowels
So, listeners must be using some information to recognize vowels other than F 1 and F 2. What information? F 3: It helps some (especially for /ɚ/), but not enough: Automatic classification improves to about 80 -85% – better, but still well below human listeners. f 0: Ditto: It helps some, but not enough: Automatic classification improves to about 80 -85% – better, but still well below human listeners. F 3 and f 0: Better still (~89 -90%), but still below 28 human listeners. Hillenbrand: Vowels
What does this mean? It appears as though listeners are recognizing vowels based on information other than F 0 and F 1 F 3. What are the possibilities? Two Candidates: • Duration • Patterns of spectral change over time Hillenbrand: Vowels 29
7. Length/Duration/Quantity ___________________________________ American English Vowels Have Basic idea is simple: Any vowel __________________ can be spoken at any duration, but [i] > [ɪ] some vowels are typically longer than [u] > [ʊ] others. This is [æ] > [ɛ] called the vowel’s inherent duration or [e] > [ɛ] typical duration. [ɑ] > [ʌ] Different Typical Durations [ɔ] > [ɑ] Hillenbrand: Vowels ________________ 30
[hæd] Original Duration Short Duration Long Duration Utterances were presented at their original durations, or they were artificially shorted or lengthened – but keeping everything else the Hillenbrand: Vowels 31 same.
Logic: If duration plays no role in vowel recognition, the three signal types ought to be equally intelligible; i. e. , artificially modifying duration will not affect what vowel is heard. On the other hand, if duration plays a role in vowel perception, the OD signals ought to be more intelligible than any of the duration-modified signals. Also, there are specific kinds of changes in vowel identity that we would expect. For example: Shortened [i] ought to be heard as [ɪ] Lengthened [ɪ] ought to be heard as [i] Shortened [ɑ] ought to be heard as [ʌ] Lengthened [ʌ] ought to be heard as [ɑ] Shortened [u] ought to be heard as [ʊ] Lengthened [ʊ] ought to be heard as [u] Shortened [æ] ought to be heard as [ɛ] Lengthened [ɛ] ought to be heard as [æ] Hillenbrand: Vowels 32
RESULTS Original Duration: Short Duration: Long Duration: Hillenbrand: Vowels 96. 0% 91. 4% 90. 9% 33
Effects of Duration on Vowel Perception Original Duration, Long Duration, Short Duration Hillenbrand: Vowels 34
CONCLUSIONS 1. Duration has a measurable but fairly small overall effect on vowel perception. 2. Vowel Shortening (-2 SDs): ~5% drop in overall intelligibility 3. Vowel Lengthening (+2 SDs): ~5% drop in overall intelligibility 4. Vowels Most Affected: [ɑ]-[ɔ]-[ʌ], [æ]-[ɛ] 5. Vowels Not Affected: [i]-[ɪ], [u]-[ʊ] Hillenbrand: Vowels 35
The Role of Spectral Change in Vowel Perception Notice that some vowels – especially [æ] and [ɪ] – show a fair amount of change in formant freq’s throughout the vowel. Is it possible that these formant movements 36 are perceptually significant?
More examples. Note especially the rise in F 2 for [ʊ] and [ʌ]. Hillenbrand: Vowels 37
Another way to visualize patterns of formant frequency change in vowels: This figure shows formant frequencies measured at the beginning of the vowel and a 2 nd time at the end of the vowel. (The phonetic symbol is plotted at the 2 nd measurement). Note that some vowels (e. g. , [i] & [u]) are pretty steady over time, but others have formants that change quite a bit throughout the course of the vowel (e. g. , Hillenbrand: Vowels 38 [e, o, ʌ, ʊ, æ, ɪ]).
NAT: Naturally spoken [hæd] OF: Synthesized, preserving original formant contours FF: Synthesized with flattened formants Hillenbrand: Vowels 39
Key comparison is OF vs. FF: If the formant movements don’t matter, the recognition rates for OF and FF should be very similar. On the other hand, if the formant movements are important, the FF signals will be less intelligible than the OF signals. Conclusion Spectral change patterns do matter – quite a bit. Hillenbrand: Vowels
What can we conclude from all this about how listeners recognize which vowel was spoken? 1. Primary Cues: • F 1 and F 2 • Relationships among the formants matter, not absolute formant frequencies 2. Cues that are of secondary importance, but definitely play a role in vowel perception: • • f 0 F 3 (especially for [ɚ]) Spectral change patterns Vowel duration Hillenbrand: Vowels 41
Implications for 2 nd Language Learning Is any of this information – e. g. , the role played by vowel duration and spectral change in vowel perception – useful? These findings we just reviewed are not universal facts about vowels; they are facts about English vowels. Other languages will behave the same way only by accident. Hillenbrand: Vowels 42
English, for example, has a pretty large (and therefore crowded) vowel system. Only 12 vowels are plotted below, and it’s pretty crowded. Including diphthongs, English has 15 vowel phonemes. This almost certainly explains why duration and spectral change are important – these features give speakers two more ways to differentiate on vowel from another. 43
Example: Notice how close [æ] and [ɛ] are to one another. • How do speakers distinguish these two vowels? • How do listeners figure out which is which? (The same question posed from two points of view. ) [æ] [ɛ] 44
Why does any of this matter? Many languages have much smaller vowel systems than English. Examples: Spanish (5), Italian (7), Japanese (5), … Spanish vowels 45
The simple point is that a speaker of a language like Spanish has some work to do – as a speaker (learning many brand-new vowels) AND as a listener – learning what native English speakers learned as children: e. g. , learning that features like duration and spectral change now matter. Spanish vowels We’ll be talking about some closely related aspects of 2 nd -language learning a little later. 46