The ABC of Continuous monitoring and auditing April

The ABC of Continuous monitoring and auditing April 10 2017 AIS Seminar Miklos A. Vasarhelyi KPMG Professor of AIS, Rutgers Business School Technology consultant, AT&T Labs


Infrastructure looks bad


Outline • Conceitos de Auditoria Continua – The Real Time Economy – What is the continuous audit? – Is the system auditable? • • • A Anatomia de um estudo de dados Estudos de Auditoria Continua Onde Estamos? Implementando CA O futuro 7

THE REAL TIME ECONOMY 8

The Real Time Economy • We are going real-time – Businesses are accelerating response times – Bank balances, receivables, payables, inventory (JIT, SMI) are being updated at least daily – Electronic transactions are being posted instantly and much of the business process is automated – Many processes are monitored and potentially automatically managed (adjusted) • The real-time economy aims to – Decreasing latency (delay) decreases occupation of capital – Use the XML standard (Electronic measurement and reporting, XBRL) – Monitoring, control, and assurance 9

Latencies Time it takes to perform a process Business Process 1 Time it takes to pass informatio n between processes Business Process 2 Intra-process latency Time it takes for a decision to lead to an outcome It may take time to reach a decision Decision Outcomes latency Decision latency Inter-process latency 10

XML / XBRL 11
 • A dialect of XML • Over 300")
XBRL (e. Xtensible business reporting language) • A dialect of XML • Over 300 industries have developed their own dialects • Is now required in the US and several other countries • Eventually will replace all paper reports 12

Scope and role of XBRL Processes Business Operations XBRL GL, the Internal External Journal Taxonomy Busines ss Reporti ng s Reportin g Trading Partners Management Accountants Economic Policymaki ng “Financial Reporting” Financial Publishers and Data Aggregators Companies Participants Investme nt, Lending, Regulatio XBRL n Auditors Software Vendors Investors Regulators Central Banks


4 core elements of XBRL The XBRL standard XBRL Taxonomies XBRL Instances e. g. IBM, Dell, Microsoft XBRL style sheets

XBRL – More Than Just Definitions Standardization Presentation Presentation Comptant et Comptant 現金及び現金等価物 Гроші та їх еквіваленти Деньги и их эквиваленты Kas en Geldmiddelen 现金与现金等价物 Geld & Geld nahe Mittel Cash & Cash Equivalents References Label cash. Cash. Equivalents. An d. Short. Term. Investments XBRL XML Item Calculation Cash = Currency + Deposits Validation GAAP I. 2. (a) Instructions Ad Hoc disclosures Formulas Contexts US $ FY 2004 Budgeted Cash ≥ 0

XBRL GL And XBRL FR Source Systems Financial Systems Accounts Payable Accounts Receivable Order Entries Purchasing Fixed Assets Human Resource Payroll Manual Transaction Late Entries Adjustments Manual Entries Business Events Source Documents Internal Reporting Pipeline Journal Entries Sub Ledgers Reporting Annual(Quarte rly) Reporting Journalize Regulatory Reporting General Ledger Aggregation Consolidation Financial Reporting Business xbrl. Info xbrl. Include Extract & Activity summary. Reporting. Element Transaction Detail Transform Financial Data Mart/ Repository Monitor, Audit & Control Tax Decision Support Business Activity Management Benchmark & Analysis Budgeting & Forcasting
 • XBRL although a very positive step on the")
Electronic measurement and reporting (XBRL) • XBRL although a very positive step on the route towards automation perpetuates some of the weaknesses of the “paper oriented” reporting model – Audits to improve their social agency function should be of corporate measurement and databases not of financial reports – As most substantive regulatory based changes XBRL presents a series of unintended consequences including • Pressure toward standardization of reporting • Facilitation of more frequent reporting • Evolutionary force towards the standardization of the semantics of accounting reporting • A poor conduit to represent corporate transactions (XBRL/FR) • XBRL/FR will eventually lead to XBRL/GL –great societal effects 19
 • Sets US accounting rules for governmental entities •")
GASB (Government Accounting Standards Board) • Sets US accounting rules for governmental entities • Has set a project in electronic reporting as a top priority • We are discussing 3 projects with them – An overall strategy for government reporting (vision) – A taxonomy for governmental reporting – A prototype for the vision 20

WHAT IS THE CONTINUOUS AUDIT? 21

Continuous audit - components Risk Control Data 22

Continuous Audit: the pulse of a System • The word ‘continuous’ implies a frequency of auditing that is both difficult to achieve technically without impacting the operations of the entity’s IT systems, and probably beyond the needs of most users. • The different elements of a corporate information system have different pulses and natural rhythms. The assurance process must be coherent with these rhythms to be useful and effective. • Consequently some processes should be monitored / assured monthly, daily, hourly, immediately after the event, or even preventively. 23

An evolving audit framework Report level Assurance Process level Assurance of Reports Assurance of Key Processes • Compliance reports becoming commonplace • Traditional audit is an instance of RLA • Generated and modified by different processes • Process reviews a la Systrust • Internal or outsourced • Third party processes are to become the norm • Intra and Inter process controls an issue Data level Assurance of Data elements • XML/ XBRL datum • Generated and modified by different processes • Balkanization of data • Control / Assurance tags 24

An evolving continuous audit framework Continuous Risk Monitoring and Assessment • Automation • Sensoring • ERP Continuous Data Audit Continuous Control Monitoring • E-Commerce Continuous Audit 25
")
Continuous Assurance Architecture (Vasarhelyi et al. 2004)

KPMG Sigma Bank PPP Credit Card Insuran ce A/P Process Mining HP P&G Inventor y AT&T Inventory Dashboard Duplicate Payments CDA Duratex FCPA Sales Commissio n Audit Automation P&G: Order to Cash Auditor Judgment Siemens- AAS Automation AICPA – ADS / APS FCPA Siemen s CCM A/P J+J CA Technologies PPP Insuran ce P&G IDT HCA Supply Chain CRMA GL KPIs/KRIs Verizon Itaú- Uni. Banco Itaú-Unibanco Met. Life Claims American Wires Water / Caseware Talecris / ACL Continuous Control Monitoring Audit Methodologies • Multidimensional Clustering • Process Mining • Continuity Equations • Predictive Auditing • Visualization • Analytic Playpen


CONTINUOUS MONITORING 29
vs Continuous Monitoring (CM) Continuous Auditing Performed by Internal Audit Continuous Monitoring")
Continuous Audit (CA)vs Continuous Monitoring (CM) Continuous Auditing Performed by Internal Audit Continuous Monitoring Responsibility of Management • Gain audit evidence more effectively and efficiently • React more timely to business risks • Leverage technology to perform more efficient internal audits • Focus audits more specifically • Help monitor compliance with policies, procedures, and regulations • Improve governance – aligning business/compliance risk to internal controls and remediation • Improve transparency and react more timely to make better day-to-day decisions • Strive to reduce cost of controls and cost of testing/monitoring • Leverage technology to create efficiencies and opportunities for performance improvements From CA/CM as Preventive Care against Fraud by James R. Littley and Andrew M. Costello, KPMG 30

Continuous Assurance Model 31

IS THE SYSTEM AUDITABLE? 32

Modern systems: un-auditable because they: • Incorporate enormous quantities of both endogenous and exogenous data • Are not directly observable neither in terms of data nor in terms of controls • Encompass many real time or close to real time processes that are customer visible and sensitive • Integrate gracefully with external (outsourced) systems • Have some degree of automatic decision making built into the systems • Incorporate a range of different technologies / vendors with modified ERPs adapted to the organization’s business processes • Lack well developed automated audit trails • Sit on common cloud environments • Are part of a product ecosystem (e. g. Amazon’s Kindle, Apple Music, etc) CAR Lab Advisory Board Meeting 2/26/2021 33
 is reflected by • Data is so large that sampling")
“Traditional method un-auditability” (TMU) is reflected by • Data is so large that sampling has very little value • Data is so large that it is not practical to perform a large number of full population tests • Analytic technology is now such that forensic preventive models can be developed to filter out transactions that would have been ex-post facto reviewed • Traditional confirmations add very little evidence; new methods of third party validation [e. g. confirmatory extranets; (Vasarhelyi, 2008)] must be put in place • Relationship between non-financial and financial processes can be developed to monitor and confirm processes • Business processes are so rapid that firms may fail or processes collapse before management notices and auditors verify (Bear Sterns got a clean opinion 2 weeks before failing) CAR Lab Advisory Board Meeting 2/26/2021 34
")
Is the system auditable? / Some remedies • The audit data standard (AICPA, ASEC) • Audit analytics • Audit automation – Progressive – Predictive audit – Preventive audit 35

36

ANATOMY OF A DATA STUDY 37

The anatomy of a data study – Flowcharts of the process • Understand controls and data flows • For example who initiates, who approves 38

The anatomy of a data study – Flowcharts of the process • Understand controls and data flows • For example who initiates, who approves Occurrence of accident Client Contacting Company Payment Of Claim Filing Documents Approving The Claim Authorization Limits Checking Coverage Calculating Claim Payment (Butcher) 39

The anatomy of a data study – Understanding the population • Number of transactions and types, population integrity, timing 40

claims Insurance policies Payments claims 41

The anatomy of a data study – Understanding fields • • • Their meaning Their values Missing values Extreme values Scales (nominal, ordinal, cardinal, and ratio) Anomalies 42

Groups of COD_GARANTIA • The following slides shows the distribution of coverage codes usage per the most important reason (Death by Disease)

Groups of COD_GARANTIA • Death by Disease: • The sets of coverage codes used commonly with the “Death by Disease” claims are: – V-DEATH QQ – Death. • While the sets of coverage codes used the least with the “Death by Disease” claims are: – V-DEATH CJE (used only once) – ANTECIP. Death (used only once) – A FUNE FAMIL (used only 3 times) • But the true outliers here were claims filed against the same “COD_GARANTIA” twice (Discussed in the next slide).

Claims Filed against the same COD_GARANTIA twice • When we checked these cases we found the following: – It happened against the following GARANTIA: • 220 (V-MORTE) happened 3 times (2 x 3 records) • 250 (ASSIS. FUNERAL) happened 1 time (2 x 1 records) • 437 (MORTE) happened 1 time (2 x 1 records) – It would be filed against the same policy twice (in one record, the policy is canceled, and in the other record, the policy is not canceled). – It’s the same beneficiary for the two times. – It’s the same “DESCR_SIT_SINISTRO” for the two times. – Please see examples in the excel files: • Examples_Paid. But. Not. Canceled_Paid. Twice_2 • Examples_Paid. But. Not. Canceled_Paid. Twice_3

Groups of COD_GARANTIA • Death by Disease: • For the death by disease, we ended up having 17 different groups. • In this case the outliers will be the least used sets (less than 3%)

Excess Payments with more than 30 days till payment • From the graph we see that the obvious anomalies in this case are 7 claims with a more than 1% daily interest (after the first 30 days)
 – Exploratory data analysis • Choose areas and assertions of interest •")
Anatomy (2) – Exploratory data analysis • Choose areas and assertions of interest • Choose exploratory methods (e. g. visualization, factor analysis, multidimensional clustering, correlation analysis, etc) • Look for suspected relationships • Formulate these relationships as testable hypotheses. • Try to obtain extra data (holdout sample, new data) or perform some type of bootstrapping • Keep eyes open for anomalies • Try to establish / extrapolate exceptions 48

Multidimensional Clustering for audit fault detection Sutapat Thiprungsri Miklos A. Vasarhelyi 49

Visualizing combination of attributes, we will be able to see similarity and differences among claims

Analyzing individual variables, we will be able to see clearly that some claims have rare values 51

Cluster by Insured information 60. 00% 50. 00% POPULATION 40. 00% 663 14000 30. 00% 15500 31000 20. 00% 106103 1023000 10. 00% cluster 0 cluster 1 cluster 2 cluster 3 cluster 5 cluster 6 cluster 7 cluster 8 Population 22. 60% 47. 05% 7. 21% 17. 19% 3. 43% 0. 64% 1. 55% 0. 33% 663 28. 89% 44. 02% 3. 84% 20. 54% 1. 35% 0. 45% 0. 68% 0. 23% 14000 19. 02% 50. 92% 1. 23% 26. 99% 1. 23% 0. 00% 0. 61% 15500 14. 40% 56. 27% 2. 11% 23. 12% 2. 38% 0. 13% 0. 53% 1. 06% 31000 56. 22% 19. 40% 3. 98% 16. 92% 1. 99% 0. 00% 1. 00% 0. 50% 106103 43. 27% 35. 67% 0. 00% 20. 47% 0. 58% 0. 00% 4. 49% 52. 65% 0. 82% 39. 59% 2. 45% 0. 00% 1023000 Cluster 0 Cluster 1 Cluster 2 Cluster 3 Cluster 5 Cluster 6 Cluster 7 Cluster 8 We can cluster claims using different group of attributes and flag the claims from specific groups in specific clusters. Several clustering of different groups of attributes can make up the score.
 • Systems – – Embedded audit modules or overlay structures? Audit Data")
Anatomy (3) • Systems – – Embedded audit modules or overlay structures? Audit Data Warehouse Will auditors cause damage in systems? Choices of • • Operating environemnt (low or high platform) Extraction language / method (ERP, flat filess, etc) Audit language (ACL, IDEA, etc) Implementing scripts – scripts? • Progressive implementation 53

CONTINUOUS AUDIT STUDIES 54

Continuous Assurance studies • Continuous data assurance • Continuous control monitoring • Continuous risk management and assessment 55

AT&T HCA Unibanco Itau Unibanco HP CONTINUOUS DATA AUDITING 56
")
Continuous Process Auditing at AT&T (1986 -1991)

Follow the lifecycle of the Advanced application, analytics linked to different timing for processes, different cycles data rich, new methods CPAS effort Alerts, Causal linkage, Confirmatory extranets, CRMA • This methodology will change Audit by exception the nature of evidence, timing, procedures and effort involved in audit work. 58

reservations flights Billing colections 59

CPAS OVERVIEW System Operational Reports Workstation DF-level 2 DF-level 1 Operation al Report Operational Report Filter Alarm DF-level 0 Data Flow Diagrams Reports Analytics Database Metrics

Flow. Front - Interactive Flow Diagram Viewer - AT&T Bell Laboratories - Murray Hill, NJ fer Date: 04/01/89 Set Date Recalculate Metrics Recalculating With Check. Help Flow. Front Hierarchy Text Quit! Billing System - Customer Billing Module Trans Customer Database Bill Upda Billing Amt. Due Extract Customer Accounts 1000 Calculate Amount Due Update Billing Info 1000 Pay Journal Files Overview Format Bill Print Bill 998 Inquiry Accounts Missing: 10 2 Table Journal Files Process Errors 0 Errors 988

Flow. Front - Interactive Flow Diagram Viewer - AT&T Bell Laboratories - Murray Hill, NJ fernsu fer Date: 04/01/89 RPC: Silver Springs Set Date Recalculate Metrics Plot Request graph. level 1 PE: 60 Help Flow. Front Hierarchy Text Quit! Billing System - Overview S Graphics Percent Of Accounts Successfully Billed 98 Tra 98 99 100 97 Bill Upda 95 99 100 99 3/29 3/30 3/31 98 80 85 Billing 67 60 Percent Billed Amt. Due 40 Pay Trans Data 23 20 Overview 0 100 Inquiry Pro 3/16 3/17 3/18 3/21 3/22 3/23 3/24 3/25 3/28 4/1/89 Mean: 89. 076923 Std. Dev: 21. 872591442494 Errors 4/1

Flow. Front - Interactive Flow Diagram Viewer - AT&T Bell Laboratories - Murray Hill, NJ fe Date: 11/27/89 Set Date RPC: Silver Springs Recalculate Metrics Starting S analysis server, please wait. . . PE: 60 Help Units: Records Text Quit! 4. 3 LDS Billing Subfunctions prod/svc. request fulfillment Order Cus minutes (x 100 k)messages (x 100 k) Input Volumes to Message Validation PE: 60 RPC: Silver Springs min / msg Hierarchy 8 7 6 5 4 3 2 1 0 60 50 40 30 20 10 0 * * * * * 8. 5 8. 0 7. 5 7. 0 6. 5 * * nals CTJ * * * * * * 6. 0 paymt arr 16 17 18 19 20 21 22 23 24 25 26 27 28 29 30 31 Oct Oct 1989 1 2 3 4 5 Nov 1989 6 7 8 9 10 11 12

Flow. Front - Interactive Flow Diagram Viewer - AT&T Bell Laboratories - Murray Hill, NJ fer Date: 11/27/89 Set Date RPC: Silver Springs Recalculate Metrics PE: 60 Help MPS. CAM Flow. Front Hierarchy NEXT Order Processing GOR TOPAS AT&T 55626 Msg. Tr 677951 rej drop BNA. r Toll. m EHDB Journal CAM MIU. ca UCase NError CCase lub and transfer msgs CError return, lub, transfer 248773 Pay. RP FIRST LAST Text SAVE Quit! QUIT Page 1 of 5 Flowchart: Message Processing Functional Level: UPE, RPE Hierarchical Level: 1 Parent Process: CAM Primary Source of Information: Business LDS 4. 3 Functional and System Process Flows: AT&T End User Profile usage LEC PREVIOUS Update S MPFB MPS. ca Text Request for MPS. cam 1. 0 PURPOSE • To edit messages entering system • To guide and rate messages • To reject messages that are in error to the Message Investigation Unit (MIU) • To send messages that should be billed in another PE or by the LEC there via the Returns and Transfer function 2. 0 MAJOR INPUTS • Usage tapes from the Local Exchange Companies • Independent Telephone Companies (ICOs) • Recorded Information Collection System (RICS) • Correct Messages from MIU • Messages from other parts of the Billing system • Control Accounts (formerly Auditors Prefix) 3. 0 MAJOR OUTPUTS • Guided and rated messages passed to APE billers for bill preparation • Messages sent to other parts of the billing system or returned to the LEC • Dropped messages that should be billed in another billing system • Errors to MIU 4. 0 PROCESSES

CONTINUITY EQUATIONS FOR HCA 65
 at HCA • HSP is a large national provider of")
Continuous Data Assurance (CDA) at HCA • HSP is a large national provider of healthcare services, composed of locally managed facilities that include numerous hospitals and outpatient surgery centers. • IT internal audit provided access to unfiltered extracts from their transactional databases, comprising all procurement cycle daily transactions from October 1 st, 2003 through June 30 th, 2004: Over 500, 000 data points. • Dataset mimics what a CDA system has to deal with: highly disaggregate data flowing through CA system in real time. • Audit procedures have to be developed for this environment. 66

Ordering Process Receiving Process Voucher Payment Process 67

BRANCH MONITORING AT UNIBANCO 68

Branch Monitoring • Heuristics for 17 monitoring procedures that monitor about 1400 branches are being re-calculated • Have retained IBM as the “systems integrator” for hardware expansion and systems implementation of continuous audit analytics • Is focusing on transitory accounts – About 10, 000 general ledger accounts – Unclear how many are transitory – Range a large number of business units 69

Unibanco – Some CA Program Features • Automated monitoring of over 5 million customer accounts on a daily basis using 25 automated procedures to: – – Detect errors Deter inappropriate events & behaviors Reduce or avoid financial losses Help assure compliance with existing laws, policies, norms and procedures • Examples of “low hanging fruit: ” – – – Customer advances Excess over credit limit Returned checks Federal tax payment cancellations TED emissions (should this be omissions? ) 70

Unibanco – Advances to Clients Monitoring 71

TRANSITORY ACCOUNTS AT UNIBANCO 72

Transitory Accounts • Level 1 – Analytic review of all accounts • Level 2 – Monitoring of risky accounts at the mainframe level • Level 3 – Daily analytics on transactions and generic characteristics of high risk accounts – Generic filter to analyze daily transactions of particular accounts flagged in daily level 2 monitoring • Level 4 (future) – Continuity equations and relationships 73

Data Description • Summary statistics – 16 transitory accounts – 17 variables – 418, 971 transactions • Data cleaning – – 418, 971: Source data 50: wrong entries (due to wrong data extraction) 18, 504: out of date bounds (01/15/08 ~ 11/19/08, 310 days) 400, 417: Final data set 74

Level 2 Screening All transactions 2 -stage screening Selecting days by sum screening Selecting transactions by TR Screening 1 -stage screening Selecting transactions of the days by TR Screening Alarmed transactions 75 Union of two screenings
")
Overall features of P-Rules • • Red line (Skewness > 1 and Kurtosis >1) Blue line (Skewness < 1 and Kurtosis <1) • If there is a certain absolutely significant amount that should be examined, its location represented by percentile will be changed according to the skewness and kurtosis. • Assumptions about two datasets – The same number of the transactions – The same mean and ranges (min and max). • Extremely positively skewed and peaked Only a few observations may exceed the material level. • Less positively skewed and less peaked The more observations are likely to exceed the cutoff point. 76
 N Peaked")
The P-Rule N Skewed (skewness > 1 Y Peaked (Kurtosis > 1) N Peaked (Kurtosis > 1) Y Y Highest Bound (e. g. , P 99) Normal Bound (e. g. , P 95) or 77 N Lowest Bound (e. g. , P 90)
 17 183 5 9 Manual:")
Suggested for further examination Duplicates: 99 cases (214 obs) 17 183 5 9 Manual: 579 493 72 Branch>=2: 106 branches (1, 936 obs) 1, 672 78

PG 79
 • KPI projects • Automating order to")
P&G (work with the audit innovation team) • KPI projects • Automating order to cash • Vendor files / duplicate payments • IA Engagements & control selfassessment 80

Hussein Issa and Alexander Kogan AUDIT AND CONTROL RISK ASSESSMENT 81

Analytics Control Risk Assessments • Objective: Quality review of control risk assessments, learning tool for non-experts, Risk-based sampling • Methodology: Ordered Logistic Regression • Software: SAS • Model: Risk Level= f( Critical+Major+Non-Major) • Dataset: issues identified and overall risk assessment score Identify Issues related to business processes IEMBA-March 2012 Classify Issues as Critical, Major, or Non-Major (CC, MC, NMC) 2/26/2021 Assign an aggregate risk level for the overall process (L, M, H) 82

Methodology Outliers Identification and Ranking • IEMBA-March 2012 2/26/2021 83

Methodology Outliers Identification and Ranking • Record CC MC NMC Calc_H Calc_M Calc_L Assign. Class Pred. Class Ratio Diff. 123456 0 2 3 0. 60719 0. 39195 0. 00086 M H 0. 64551 0. 21524 IEMBA-March 2012 2/26/2021 84

PROBLEM

Problem What do we end up with? • Results are too numerous to investigate! (e. g. 165 outliers out of 924 records in the control risk assessment study) • Too many false positives (observations that are flagged by the system, but are legitimate in fact) • Overload of exceptions for the auditors, leading to prohibitively costly investigation • Auditors resort to investigating a sample of the exceptions • How should they sample? And which exceptions to analyze first? IEMBA-March 2012 2/26/2021 86

EXCEPTIONS OF EXCEPTIONS IEMBA-March 2012 2/26/2021 87

Exceptions of Exceptions What we would like to do? • Improve the audit effectiveness and efficiency • Prioritizing of the exceptions is crucial • Identify the most suspicious records first (mitigating the effects of the numerous false positives) • Exceptions of Exceptions: – Behavioral research (e. g. experiments, expert panel’s opinion) – Machine learning techniques and expert systems (e. g. audit scores ranking system) IEMBA-March 2012 2/26/2021 88
 Michael Alles (Rutgers Univ. ) 89")
Process mining Mieke Jens (Hasselt University) Michael Alles (Rutgers Univ. ) 89

What is Process Mining of Event Logs? • The basic idea of process mining is to extract knowledge from event logs recorded by an information system. Until recently, the information in these event logs was rarely used to analyze the underlying processes. Process mining aims at improving this by providing techniques and tools for discovering process, control, data, organizational, and social structures from event logs. Fuelled by the omnipresence of event logs in transactional information systems… process mining has become a vivid research area. • http: //is. tm. tue. nl/staff/wvdaalst/BPMcenter/process%20 mining. htm 9090

An Example of An Event Log of an Invoice 9191

PREDICTIVE AUDIT: TRANSACTION STATUS PREDICTION

Predictive Audit • A predictive audit could help auditors and management to block a problem before it spreads. • It is better to look forward than just look back at the historical information • Continuous audit is used to monitor present transactions • Can we use CA to predict the future? – Audit by exception – Alarm and warning system 93

Transaction status prediction • Revenue cycle is a high risk area. – Channel stuffing • This study aims to predict future sales cancellations, an indicator of a suspicious transaction. • If there is any suspicious transaction, the system should have a warning or an alarm report. • What prediction model(s) will more accurately forecast business transaction outcomes? 94

Results and analysis • Models comparison of cost-sensitive approach • 1: 14 ratio 1: 16 ratio Accuracy False negative rate False positive rate 0. 64 0. 48 0. 35 0. 53 0. 36 0. 48 Logistic regression 0. 70 0. 50 0. 28 0. 57 0. 39 0. 44 Support vector machine 0. 79 0. 63 0. 18 0. 73 0. 56 0. 25 Model/ Measureme nts J 48 95

Conclusion • Predictive audit lets auditors monitor and audit controls in a preventive basis. • The result of prediction model could alert auditors for suspicious transactions. 96

Siemens Talecris CONTINUOUS CONTROL MONITORING AT SIEMENS 97

CCM C O N T R O L S COM PAR E B A S E L I N E Determini stic exception s Automat able actions Residuals 98

Siemens projects • Focused on audit automation – First project looked at automating CCM in SAP – Second project focused on a wider scope of automation – A third project would think about reengineering the audit action sheets – The fourth project aims at formalizing SOD, activities, and control structures 99

The Siemens project learnings e r a s m d e t n s ya y s k d e n n u i l e l c c r i r A ften ou s t o ou • ERPs are very opaque • Ratings schema are used and desirable • 20 -40% of the controls may be deterministically monitored • Maybe other 20 -40% may be convertible to be monitorable • New form of alarm evidence that we do not know how to deal • Continuous risk management and assessment needed for weighting evidence and choice of procedures 100

Continuous Risk Monitoring and Assessment Assurance on Risk Management 101


Continuous Risk Monitoring and Assessment Environmental Risks Corporate ERM Ongoing CDA Risk Monitoring Risk Assess ment Models Ongoing CCM Changing Evidence Assessment
 Risk")
Process risks Environmental risks Black Swans KRIs Variable selection algorithms (heuristics expert based) Risk minimization / audit return maximization algorithms Audit Procs. Rearrange d 2/26/2021 104

DASHBOARDS, VISUALIZATION, KPI’S, KRI’S, CONTROL PANELS 106

Inventory dashboard 1 107

Inventory dashboard 2 108

Control dashboard 109

MODELING AND FILTERINGTHE PREVENTIVE AUDIT 110

Combining forensic analysis, forensic experience and real time technology • Patterns detected/ examined in forensic analysis can / should be used in CA/CM filtering • If faults are searched/found in forensic examination they can be impounded in process filtering, exception reporting, and audit by exception • If faults are not found it does not mean that they do not or will not exist 111

Incorporating Forensics into an CA/CM philosophy Operations Forensic models archives controls Forensic Filtering by Forensic models Audit By Exception analysis 112

WHERE ARE WE? 113

114

115
 116")
Hype cycle (dan o’leary) 116

Measuring the Degree of CA Adoption • We have developed an “Audit Maturity Model” that corresponds to the Technology Adoption Lifecycle model of Bohlen et at (1957) and Rogers (1962). • Our model emphasizes on how products and markets change as the technology becomes more refined and widely adopted. The Rogers’ Product Life Cycle Curve 117
 Stage 1 Stage 2 Stage 3 Stage 4 Traditional")
The Audit Maturity Model (1/2) Stage 1 Stage 2 Stage 3 Stage 4 Traditional Audit Emerging Maturing Continuous Audit Objectives • Assurance on the financial reports presented by management • Effective control monitoring • Verification of the quality of controls and operational results Approach • Traditional interim and year-end audit IT/Data access • Case by case basis • Data is captured during the audit process • Traditional plus some key monitoring processes • Repeating key extractions on cycles • Usage of alarms as evidence • Continuous control monitoring • Systematic monitoring of processes with data capture • Improvements in the quality of data • Creation of a critical meta-control structure • Audit by exception Audit Automation • Manual processes & separate IT audit • Audit management software • Work paper preparation software • Automated monitoring module • Alarm and follow-up process • Complete data access • Audit data warehouse, production, finance, benchmarking and error history • Continuous monitoring and immediate response • Most of audit automated 118
 Stage 1 Stage 2 Stage 3 Stage 4 Traditional")
The Audit Maturity Model (2/2) Stage 1 Stage 2 Stage 3 Stage 4 Traditional Audit Emerging Maturing Continuous Audit and management sharing • Independent and Adversarial • Independent with some core monitoring shared • Purposeful Parallel systems and common infrastructures Management of audit functions • Financial organization supervises audit and matrix to Board of director • Some degree of coordination between the areas of risk, auditing and compliance IT audit works independently Analytic methods • Financial ratios at sector level/account level • Shared systems and resources where natural process synergies allow • IA and IT audit coordinate risk management and share automatic audit processes • Auditing links financial to operational processes • KPI level monitoring • Structural continuity equations • Monitoring at transaction level • Centralized and integrates with risk management, compliance and SOX/ layer with external audit. • Corporate models of the main sectors of the business • Early warning system 119

The Audit Maturity Model Objectives Insurance Approach Bank 1 IT/Data access Bank 2 Hi-tech 1 Audit automation Hi-tech 2 Consumer 1 Audit &MGT sharing Consumer 2 MGT of audit fnc. Consumer 3 Consumer 4 Analytical methods 0 Traditional Emerging Maturing Continuous 1 2 3 4 120
 1. Most of the companies are at the foundation stage")
Results and analysis (1/2) 1. Most of the companies are at the foundation stage of CA/CM adoption. • Contrasts with the findings and internal audit surveys previously conducted. 2. Some companies have a certain level of CA/CM technology adoption such as Hi-tech 1, Hi-tech 2 and Bank 1. – External auditor can rely on internal audit work at some level. 3. Lacking audit aid tools such as working paper management and data analysis tools. • i. e. Consumer 1 121
 4. IA wants to improve audit competency and technology skill")
Results and analysis (2/2) 4. IA wants to improve audit competency and technology skill set. • Bank 2 hires Big 4 as a consultant to help in internal audit areas. 5. Lack of training for Audit aid tools and staff rotation • Consumer 1 is not successful with the ACL data analysis adoption. • Several companies have staff rotation program. 6. Audit like organizations: Internal Audit, Fraud, Sarbanes, compliance, Basel, etc. . 7. With advanced auditing technology, sufficient access to data is facilitated; for instance, the continuous monitoring system of Bank 1 and the audit tools of Hi-tech 1. 122 • Analyze data in various dimensions and at a deeper level

Assurance Coordination: Managing the Organization’s Urton Anderson Assurance Network The University of Texas at Austin 1 2 2/22/2012

Organization as a Web of Assurance 1 2 2/22/2012
 1 2 2/22/2012")
Assurance Net (PWC) 1 2 2/22/2012

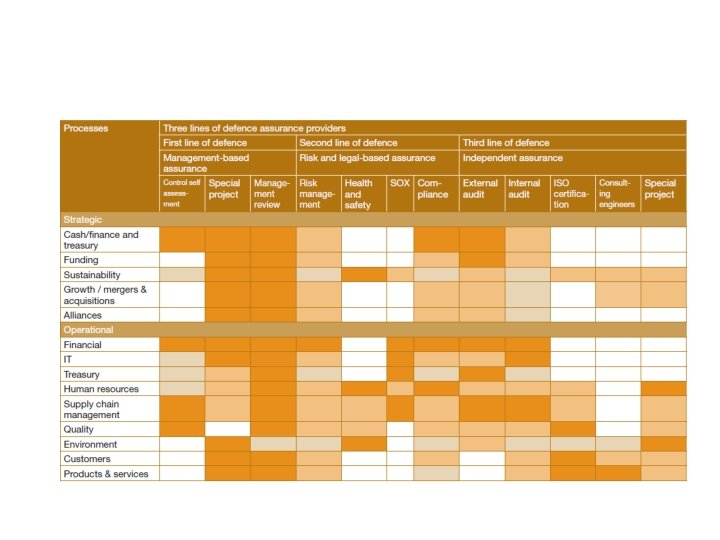
3 Lines of Defense • Basel II - Basel Committee on Banking Supervision, UK, ECIIA 1 2 Line 1 Management oversight - management review, control self-assessment, and continuous monitoring mechanisms Line 2 Staff functions – Risk management, SOX review, compliance Line 3 Independent and objective assurance – IA, EA, ISO, regulatory audits and other impendent reviews 2/22/2012

COMBINED ASSURANCE King III Principle 3. 5 The audit committee should ensure that a combined assurance model is applied to provide a coordinated approach to all assurance activities. 1 2 2/22/2012

IMPLEMENTING CONTINUOUS ASSURANCE - THE MECHANICS

• Background – While technologies of continuous audit have been extensively discussed and are progressively emerging the more mundane issues of their implementation in a sociotechnical environment have been neglected – http: //www. theiia. org/itaudit/features/in-depthfeatures-2 -10 -08/feature-2/ 130

1. Priority Areas 6. Action and Reaction 2. Rule Audit Control Panel 5. Follow-up 3. Frequency 4. Parameterization Six steps of process implementation 131

EVOLVING TO THE FUTURE 132

The future • Everything electronic – how? ? ? ? • Data integrity / data quality is the objective of assurance • Assurance is the umbrella of many different methodologies including the traditional (enhanced) audit of financial statement, quality assurance, environmental assurance, etc. • An audit eco-system must be developed • Many AI techniques will be built in 133

134/33

A new world in assurance • Companies are based on “big data” and respond often on a close to real time basis • The financial cycles are now bipolar – Internal ERP based management data respond close to real-time, accounts like cash, A/R, A/P, and manufacturing are close to real-time – Statutory financial reporting is quarterly • while internal financial management is close to real-time to decrease occupation of capital 135

Continuous audit systems • The continuous audit will need to be a highly formalized system independent in the first and second harmonic of human reaction interference – These systems will be conceptually analogous to meta-controls and will force redefinition of audit independence, materiality and audit roles – They will be constructed in a hybrid mode with progressive automation of key elements 136

The new audit ecosystem • • Embedded into corporate ERPs? Producing audit evidence and evaluating on a frequent basis? Cloud-based tapping information at all locations? Implementing audit heuristics at process levels? – Issues with knowledge capture – Issues with knowledge creation (how will experience be obtained / developed? ) • Delivering evidence on an alert basis with scores and frequent indicators • Depending on much higher standardization than just ADS • How will the profession (external) integrate into this scenario? 137

Cloud points of entry Duplicate Detection Manual agent entry flag Split Krons & Daemons’Single transaction agent (agents) function Cooperating agent (discriminant Function) Activity Monitoring Populatio n integrity agent Exception Selection methods Auditor Exception evaluation Assurance Ecosystem Processes sale Collect cash 138

Imagineering Audit 4. 0 Jun Dai and Miklos A Vasarhelyi

Agenda • Background • Definition of Audit 4. 0 • Key Elements • Imagneering of Audit 4. 0 • Challenges • Conclusion and Future Research Questions 140
, Internet of Things (Io. T), Internet of")
Background • Advances in Cyber-Physical Systems (CPS), Internet of Things (Io. T), Internet of Service (Io. S), and Smart factory promote a new industry revolution • Industry 4. 0 (Industrie 4. 0) became publicly known at Hannover Fair in 2011 The German federal government announced Industry 4. 0 as one of the key initiatives to implement the German high-tech strategy 2020 • “Industry 4. 0 is a collective term for technologies and concepts of value chain organization. Within the modular structured Smart Factories of Industry 4. 0, CPS monitor physical processes, create a virtual copy of the physical world and make decentralized decisions. Over Io. T, CPS communicate and cooperate with each other and humans in real time. Via the Io. S, both internal and crossorganizational services are offered and utilized by participants of the value chain. ” (Hermann et al. 2015) 141

Audit 4. 0 Definition • Audit 4. 0 will piggyback on technology promoted by Industry 4. 0, especially the Io. T, Io. S, CPS, and smart factories, to collect financial and operational information, as well as other audit-related data from an organization and its associated parties • It analyzes, models, and visualizes data in order to discover patterns, identify anomalies, and extract other useful information for the purpose of providing effective, efficient, and real-time assurance • It is typically an overlay of Industry 4. 0 business management processes and uses a similar infrastructure, but for assurance purposes 142

Evolution of Auditing: From 1. 0 to 4. 0 143

Four Elements • Standards • Principles • Technology • Auditors 144

Standards • Assurance, in the world of Industry 4. 0, will be largely dominated by formal inter-object protocols, the technical capabilities of “things”, and the objective functions of the interlinked objects. • Examples: – Inventory measurement would be automated by obtaining and tracking the current values of purchases – Products will autonomously issue alerts if they are obsolete, slow-moving, or damaged, to prevent including or overstating the value of obsolete inventory – Manufactured inventory can be constantly measured by collecting real-time data regarding energy consumptions of production lines and labor costs. Many items that were overhead allocation will be measured directly 145

Principles • Interoperability: Traffic lights and cars, automatic confirmation between two related parties • Virtualization: a virtual copy of the physical world – the Mirror World • Decentralization: each machine or device can individual decisions and adjustments • Real-time capability: continuous auditing and control monitoring • Service orientation: any resource could be served as a service via networks • Modularity: using apps for analytics 146

Technology • Sensors: collect real-time accounting information, such as quantity and quality of inventory, working hours of employees, energy consumption. . . • Cyber-physical systems: embedded computers and networks monitor and control the physical processes, usually with feedback loops where physical processes affect computations and vice versa • Internet of things: objects linked through a network • Internet of service: service vendors can offer their services via the internet • Smart factories : use CPS, and Io. T/S to assist people and machines in the execution of their tasks • Others: RFID, GPS, and data analytics 147

Auditors • In a world of intense automation and process scrutiny, the skillset of auditors is to change dramatically. – The auditor must be much more technically trained, but processes must also be built with untrained users in mind. – Auditors will have specialized dashboards that will include close to real time alerts – Byrnes (2015) developed a “super-app” to supplement auditor usage of clustering. This tool not only performs clusterization but also applies statistical knowledge to complement auditor knowledge. 148

Imagineering Audit 4. 0 - Overall 149

Imagineering Audit 4. 0 – Inter-businesses 150

Imagineering Audit 4. 0 – Intra-business 151

Imagineering Audit 4. 0 –Audit Service 152

Challenges • Digital crime: technique given, technique taken • Security and privacy issues of companies’ data • Standardization of information and data 153

Conclusion • This paper foresees the impacts of the fourth industrial revolution on the auditing profession, imagineers the use of new schemata promoted by Industry 4. 0 for audit purposes, and identifies challenges in the transformation towards the new generation of auditing. 154

Future Research Questions • What new types of audit evidence can be generated and collected in the context of Audit 4. 0? • As more data will be collected in Audit 4. 0, how can auditors avoid information overload to find relevant auditing information? • How should the auditing standards be changed to adapt to the next auditing environment? • What are the new audit procedures to be developed/ created in Audit 4. 0? • What new knowledge should auditors obtain to perform audits in Audit 4. 0? • What should be done to protect the security and privacy of companies’ sensitive information in Audit 4. 0? 155
 • How should external and internal auditors cooperate to")
Future Research Questions (cont. ) • How should external and internal auditors cooperate to enable Audit 4. 0? • Will the current audit model be changed in Audit 4. 0? • What are the new roles of the different lines of defense? • How can predictive and prescriptive audits be used in Audit 4. 0? • Audit 4. 0 will considerably lower the cost of auditing procedures. These are typically the result of tradeoffs of the cost of a particular procedure versus the benefits of such examination. How will this change the depth of examination, the procedures used, and their frequency of usage? • As many emerging technologies/systems are used in Audit 4. 0, what are new controls that should take place to examine whether the technologies/systems operate as they are supposed to do? 156

• http: //raw. rutgers. edu – A wide range of presentations / videos and papers from the multiple CA and CR conferences promoted by Rutgers • http: //raw. rutgers. edu/itaum aio 2013 157

- Slides: 157