The 2 Test of Independence Consider this table

The Χ 2 Test of Independence Consider this table: • How many people are in the sample? – How many males? – How many females? • This is called a 2 x 2 contingency table.

Gender vs. Regular Exercise • How are gender and regular exercise related?

Gender vs. Regular Exercise • The variables may be dependent: – Females may be more likely to exercise regularly than males. • The variables may be independent: – Gender has no effect on whether they exercise regularly. A chi-squared test is used to determine whether two variables from the sample are independent.

Contingency Tables Ø Observed Frequencies Column 1 Column 2 Totals Row 1 a b sum row 1 Row 2 c d sum row 2 Totals Sum column 1 Sum column 2 total Ø Expected Frequencies Column 1 Column 2 Totals Row 1 sum row 1 Row 2 sum row 2 Totals sum column 1 sum column 2 total

Χ 2 Statistic • Calculating Χ 2: To test whether gender and regular exercise are independent, we first consider only the sum values of the contingency table. We then calculate the values we would expect to obtain if the variables were independent.

Χ 2 Statistic • If gender and exercise were independent, then • So, in the sample of 400 adults, we would except

• We can perform similar calculations for each cell to complete an expected frequency table. • The Χ 2 test examines the difference between the observed values we obtained from our sample, and the expected values we have calculated.

• If the variables are independent, the observed and expected values will be similar. This means the value of ( f 0 – fe ) will be small, and hence Χ 2 calc will be small. • If the variables are not independent, the observed will differ greatly from the expected values. This means the value of ( f 0 – fe ) will be large, and hence Χ 2 calc will be large.

Χ 2 Statistic • On TI-84 • Put observed data in Matrix A • • Stat> Tests > C: χ2 -Test Calculate


Χ 2 Statistic • On TI-84 • • • Put observed data in Matrix A Stat> Tests > C: χ2 -Test Calculate Output: Χ 2 calculated value df degrees of freedom in Matrix B expected values
 Write the null hypothesis (H 0)and the alternate hypothesis (H 1).")
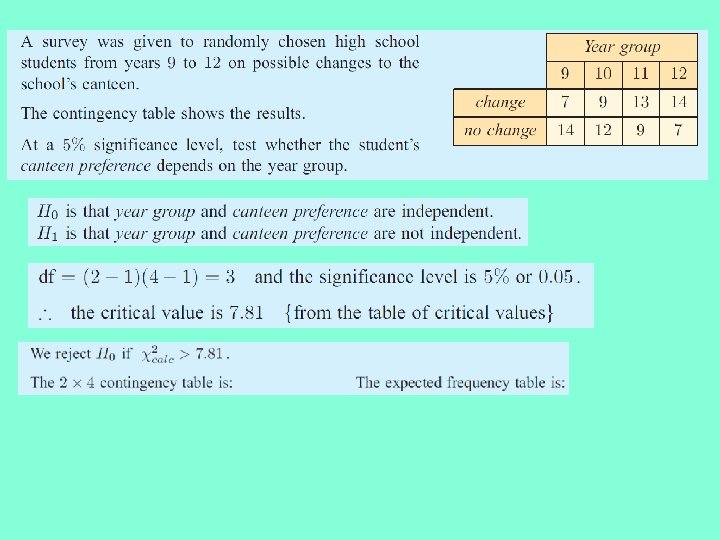
Formula Test: 1) Write the null hypothesis (H 0)and the alternate hypothesis (H 1). 2) Create contingency tables for observed and expected values. 3) Calculate the chi-square statistic and degrees of freedom. 4) Find the chi-squared critical value (booklet). • Depends on the level of significance (p) and the degrees of freedom (v). 5) Determine whether or not to accept the null hypothesis.

1. Null and Alternate Hypothesis • H 0: ____ is independent of ____ • H 1: ____ is dependent on ____

2&3. Χ 2 Statistic • On TI-84 • • • Put observed data in Matrix A Stat> Tests > C: χ2 -Test Calculate Output: Χ 2 calculated value df degrees of freedom in Matrix B expected values

4. Find the Critical Value • Get this from the formula booklet. • Significance level (p) is always given in the problem. § A 5% significance level = 95% confidence level • Degrees of freedom: df = (c - 1)(r – 1) where c = number of columns in table and r = number of rows in table

Gender vs. Regular Exercise • The variables may be dependent: – Females may be more likely to exercise regularly than males. • The variables may be independent: – Gender has no effect on whether they exercise regularly. A chi-squared test is used to determine whether two variables from the sample are independent.

4. Find the Critical Value

5. Accept Null Hypothesis? If X 2 calc< Critical Value ACCEPT the null hypothesis If X 2 calc> Critical Value REJECT the null hypothesis Can this be determined from the p-value?

On the calculator: Put your contingency table in matrix A § STAT § TESTS § C: χ2 Test § Observed: [A] § Expected: [B] (this is where you want to go) § Calculate

- Slides: 21